Slovenia Natural Vanillin Market (2026-2032) | Trends, Size, Industry, Value, Forecast, Companies, Segmentation, Outlook, Analysis, Growth, Revenue & Share
Market Forecast By Source (Vanilla Bean Extract, Ferulic Acid Synthesis, Eugenol Synthesis), By Application (Food & Beverages, Pharmaceuticals, Cosmetics & Personal Care) And Competitive Landscape
| Product Code: ETC5791035 | Publication Date: Nov 2023 | Updated Date: Apr 2026 | Product Type: Market Research Report | |
| Publisher: 6Wresearch | Author: Ravi Bhandari | No. of Pages: 60 | No. of Figures: 30 | No. of Tables: 5 |
Slovenia Natural Vanillin Market Size (2020-2030)
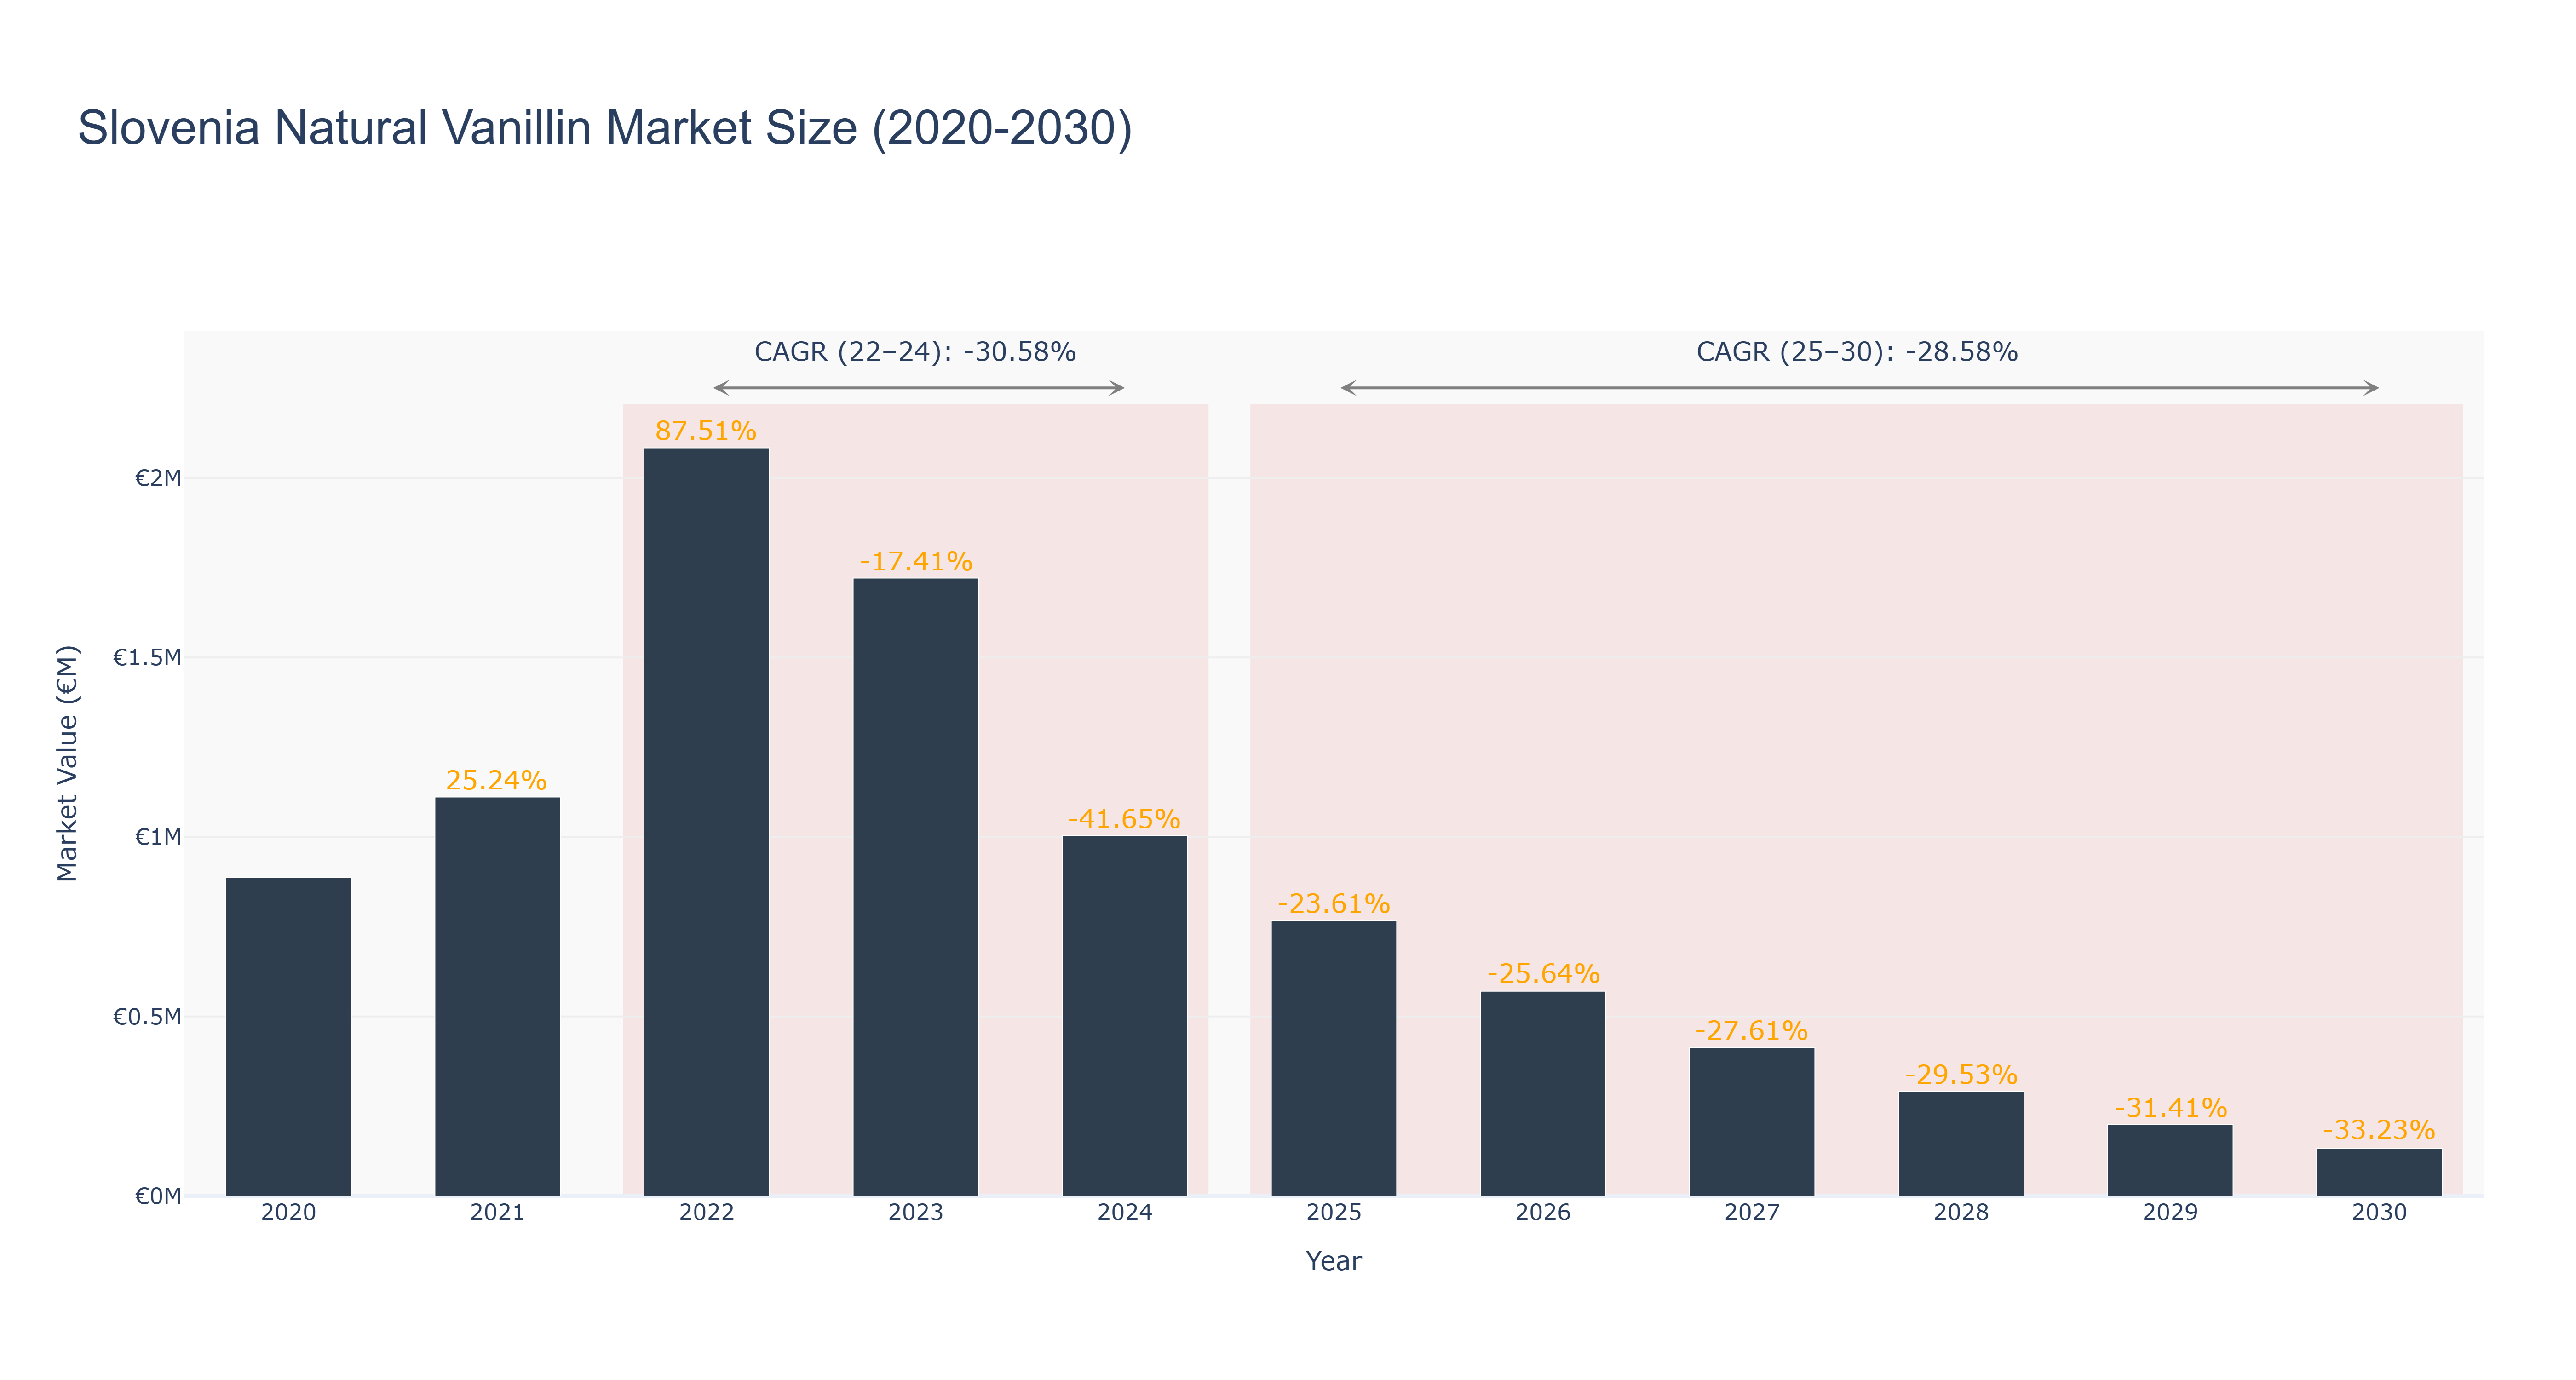
The Slovenia Natural Vanillin Market experienced a peak market size of €2.08 million in 2022, followed by a decline to €0.77 million in 2025. The market is projected to continue decreasing to €0.13 million by 2030, with a CAGR of -28.58% from 2025 to 2030. The significant drop in market size can be attributed to factors such as changing consumer preferences, increased competition, and regulatory challenges impacting the natural vanillin industry. However, despite the downward trend, recent developments indicate a shift towards sustainable sourcing practices and innovative product offerings in the natural vanillin market in Slovenia. Future projects focusing on enhancing production efficiency and product quality are expected to drive growth in the market in the coming years. Industry drivers for the Slovenia Natural Vanillin Market include increasing awareness about health and wellness, demand for clean label ingredients, and the rising popularity of natural flavors in food and beverage products.
Slovenia Natural Vanillin Market: Production & Trade Performance (2019-2025)
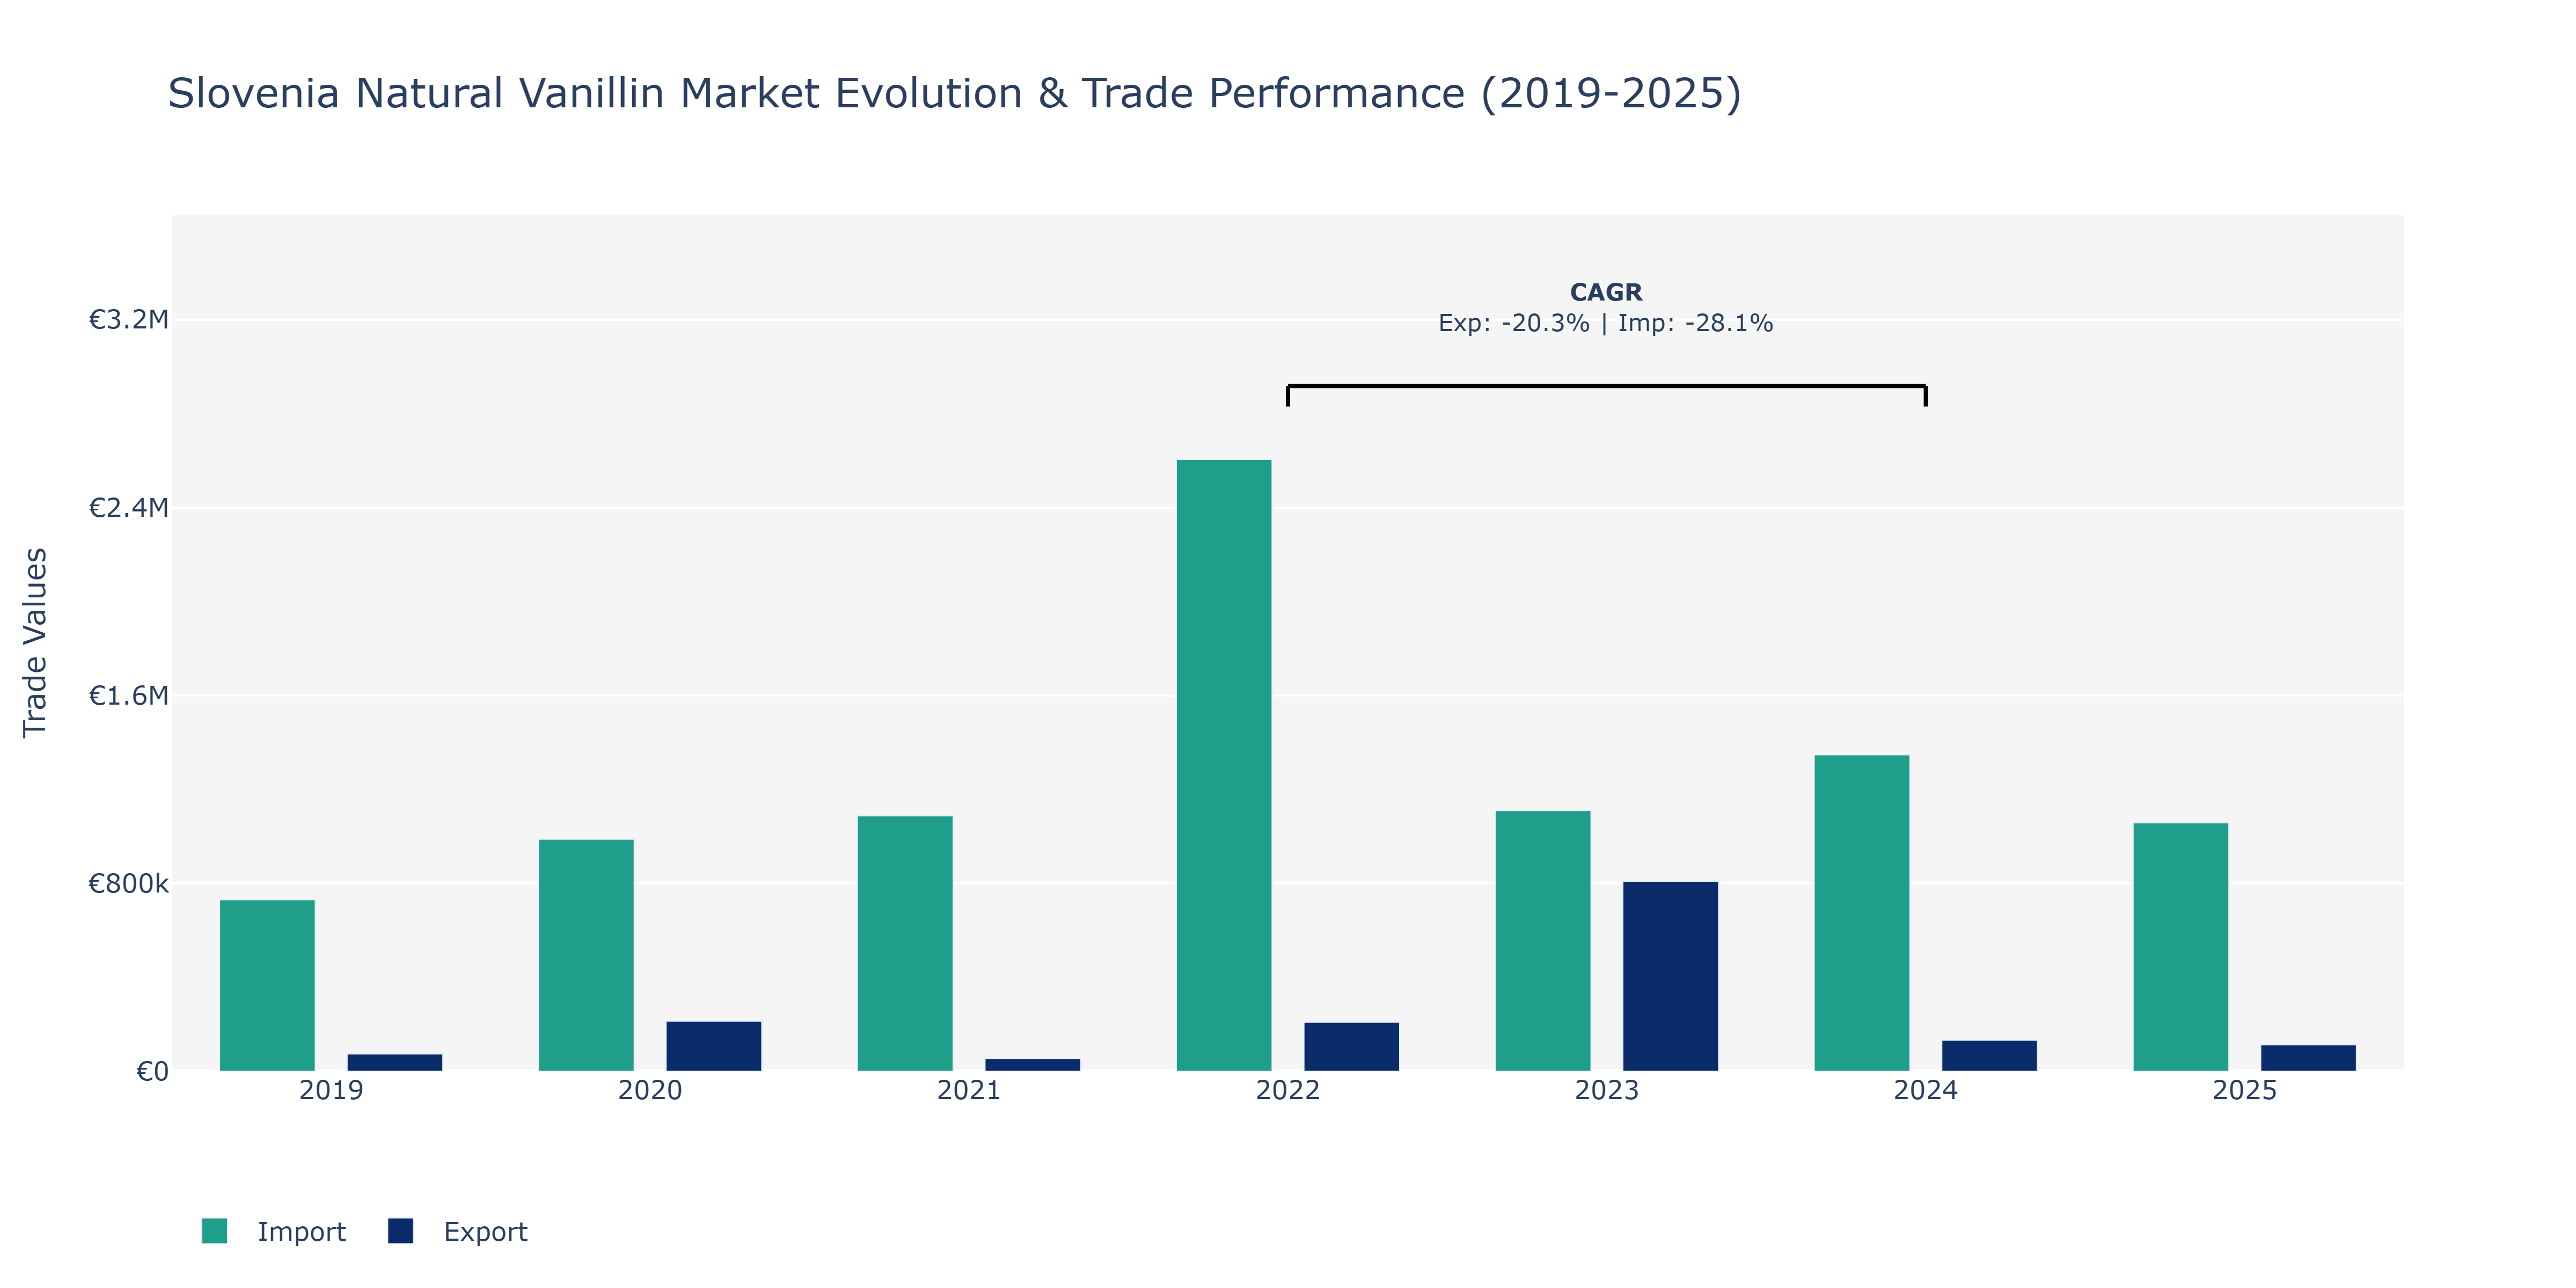
The Slovenia Natural Vanillin Market saw notable fluctuations in both exports and imports from 2019 to 2025. In 2023, exports surged to €807.51 thousand, marking a significant peak, possibly driven by increased demand or favorable market conditions. Conversely, in 2021, exports dropped to €54.47 thousand, reflecting a substantial decline, which could be attributed to supply chain disruptions or shifting consumer preferences. Imports, on the other hand, peaked in 2022 at €2.61 million, showcasing a substantial increase, possibly indicating growing demand for natural vanillin in Slovenia. The market experienced a decline in imports in 2024, reaching €1.35 million, which could be influenced by regulatory changes impacting trade dynamics. These fluctuations highlight the market's sensitivity to various internal and external factors, emphasizing the importance of strategic planning and adaptability for stakeholders in the natural vanillin industry in Slovenia.
Key Highlights of the Report:
- Slovenia Natural Vanillin Market Outlook
- Market Size of Slovenia Natural Vanillin Market, 2025
- Forecast of Slovenia Natural Vanillin Market, 2032
- Historical Data and Forecast of Slovenia Natural Vanillin Revenues & Volume for the Period 2022-2032F
- Slovenia Natural Vanillin Market Trend Evolution
- Slovenia Natural Vanillin Market Drivers and Challenges
- Slovenia Natural Vanillin Price Trends
- Slovenia Natural Vanillin Porter`s Five Forces
- Slovenia Natural Vanillin Industry Life Cycle
- Historical Data and Forecast of Slovenia Natural Vanillin Market Revenues & Volume By Source for the Period 2022-2032F
- Historical Data and Forecast of Slovenia Natural Vanillin Market Revenues & Volume By Vanilla Bean Extract for the Period 2022-2032F
- Historical Data and Forecast of Slovenia Natural Vanillin Market Revenues & Volume By Ferulic Acid Synthesis for the Period 2022-2032F
- Historical Data and Forecast of Slovenia Natural Vanillin Market Revenues & Volume By Eugenol Synthesis for the Period 2022-2032F
- Historical Data and Forecast of Slovenia Natural Vanillin Market Revenues & Volume By Application for the Period 2022-2032F
- Historical Data and Forecast of Slovenia Natural Vanillin Market Revenues & Volume By Food & Beverages for the Period 2022-2032F
- Historical Data and Forecast of Slovenia Natural Vanillin Market Revenues & Volume By Pharmaceuticals for the Period 2022-2032F
- Historical Data and Forecast of Slovenia Natural Vanillin Market Revenues & Volume By Cosmetics & Personal Care for the Period 2022-2032F
- Slovenia Natural Vanillin Import Export Trade Statistics
- Market Opportunity Assessment By Source
- Market Opportunity Assessment By Application
- Slovenia Natural Vanillin Top Companies Market Share
- Slovenia Natural Vanillin Competitive Benchmarking By Technical and Operational Parameters
- Slovenia Natural Vanillin Company Profiles
- Slovenia Natural Vanillin Key Strategic Recommendations
Frequently Asked Questions About the Market Study (FAQs):
6Wresearch actively monitors the Slovenia Natural Vanillin Market and publishes its comprehensive annual report, highlighting emerging trends, growth drivers, revenue analysis, and forecast outlook. Our insights help businesses to make data-backed strategic decisions with ongoing market dynamics. Our analysts track relevent industries related to the Slovenia Natural Vanillin Market, allowing our clients with actionable intelligence and reliable forecasts tailored to emerging regional needs.
Yes, we provide customisation as per your requirements. To learn more, feel free to contact us on sales@6wresearch.com
1 Executive Summary |
2 Introduction |
2.1 Key Highlights of the Report |
2.2 Report Description |
2.3 Market Scope & Segmentation |
2.4 Research Methodology |
2.5 Assumptions |
3 Slovenia Natural Vanillin Market Overview |
3.1 Slovenia Country Macro Economic Indicators |
3.2 Slovenia Natural Vanillin Market Revenues & Volume, 2022 & 2032F |
3.3 Slovenia Natural Vanillin Market - Industry Life Cycle |
3.4 Slovenia Natural Vanillin Market - Porter's Five Forces |
3.5 Slovenia Natural Vanillin Market Revenues & Volume Share, By Source, 2022 & 2032F |
3.6 Slovenia Natural Vanillin Market Revenues & Volume Share, By Application, 2022 & 2032F |
4 Slovenia Natural Vanillin Market Dynamics |
4.1 Impact Analysis |
4.2 Market Drivers |
4.2.1 Increasing consumer preference for natural ingredients in food and beverages |
4.2.2 Growing awareness about the health benefits of natural vanillin compared to synthetic alternatives |
4.2.3 Rising demand for clean label products in the food industry |
4.3 Market Restraints |
4.3.1 Fluctuating prices of raw materials used in natural vanillin production |
4.3.2 Limited availability of natural vanillin sources leading to supply chain challenges |
4.3.3 Stringent regulations and certifications required for natural vanillin production |
5 Slovenia Natural Vanillin Market Trends |
6 Slovenia Natural Vanillin Market Segmentations |
6.1 Slovenia Natural Vanillin Market, By Source |
6.1.1 Overview and Analysis |
6.1.2 Slovenia Natural Vanillin Market Revenues & Volume, By Vanilla Bean Extract, 2022-2032F |
6.1.3 Slovenia Natural Vanillin Market Revenues & Volume, By Ferulic Acid Synthesis, 2022-2032F |
6.1.4 Slovenia Natural Vanillin Market Revenues & Volume, By Eugenol Synthesis, 2022-2032F |
6.2 Slovenia Natural Vanillin Market, By Application |
6.2.1 Overview and Analysis |
6.2.2 Slovenia Natural Vanillin Market Revenues & Volume, By Food & Beverages, 2022-2032F |
6.2.3 Slovenia Natural Vanillin Market Revenues & Volume, By Pharmaceuticals, 2022-2032F |
6.2.4 Slovenia Natural Vanillin Market Revenues & Volume, By Cosmetics & Personal Care, 2022-2032F |
7 Slovenia Natural Vanillin Market Import-Export Trade Statistics |
7.1 Slovenia Natural Vanillin Market Export to Major Countries |
7.2 Slovenia Natural Vanillin Market Imports from Major Countries |
8 Slovenia Natural Vanillin Market Key Performance Indicators |
8.1 Percentage of food and beverage products in Slovenia using natural vanillin as an ingredient |
8.2 Number of new product launches featuring natural vanillin in the Slovenian market |
8.3 Consumer perception and acceptance of natural vanillin through surveys and focus groups |
8.4 Research and development investment in natural vanillin technologies and applications |
9 Slovenia Natural Vanillin Market - Opportunity Assessment |
9.1 Slovenia Natural Vanillin Market Opportunity Assessment, By Source, 2022 & 2032F |
9.2 Slovenia Natural Vanillin Market Opportunity Assessment, By Application, 2022 & 2032F |
10 Slovenia Natural Vanillin Market - Competitive Landscape |
10.1 Slovenia Natural Vanillin Market Revenue Share, By Companies, 2025 |
10.2 Slovenia Natural Vanillin Market Competitive Benchmarking, By Operating and Technical Parameters |
11 Company Profiles |
12 Recommendations | 13 Disclaimer |
Global Go To Market Strategy - 2030
Export potential enables firms to identify high-growth global markets with greater confidence by combining advanced trade intelligence with a structured quantitative methodology. The framework analyzes emerging demand trends and country-level import patterns while integrating macroeconomic and trade datasets such as GDP and population forecasts, bilateral import–export flows, tariff structures, elasticity differentials between developed and developing economies, geographic distance, and import demand projections. Using weighted trade values from 2020–2024 as the base period to project country-to-country export potential for 2030, these inputs are operationalized through calculated drivers such as gravity model parameters, tariff impact factors, and projected GDP per-capita growth. Through an analysis of hidden potentials, demand hotspots, and market conditions that are most favorable to success, this method enables firms to focus on target countries, maximize returns, and global expansion with data, backed by accuracy.
By factoring in the projected importer demand gap that is currently unmet and could be potential opportunity, it identifies the potential for the Exporter (Country) among 190 countries, against the general trade analysis, which identifies the biggest importer or exporter.
To discover high-growth global markets and optimize your business strategy:
Click Here
Pricing
- Single User License$ 1,995
- Department License$ 2,400
- Site License$ 3,120
- Global License$ 3,795

Leadership Perspectives from Industry Events
Search
Thought Leadership and Analyst Meet


Our Clients
6WResearch In News
- Doha a strategic location for EV manufacturing hub: IPA Qatar
- Demand for luxury TVs surging in the GCC, says Samsung
- Empowering Growth: The Thriving Journey of Bangladesh’s Cable Industry
- Demand for luxury TVs surging in the GCC, says Samsung
- Video call with a traditional healer? Once unthinkable, it’s now common in South Africa
- Intelligent Buildings To Smooth GCC’s Path To Net Zero
Latest Reports
- New Zealand Aseptic Manufacturing Market (2026-2032)
- Netherlands Aseptic Manufacturing Market (2026-2032)
- Nauru Aseptic Manufacturing Market (2026-2032)
- Namibia Aseptic Manufacturing Market (2026-2032)
- Mozambique Aseptic Manufacturing Market (2026-2032)
- Montenegro Aseptic Manufacturing Market (2026-2032)
- Mongolia Aseptic Manufacturing Market (2026-2032)
- Monaco Aseptic Manufacturing Market (2026-2032)
- Micronesia Aseptic Manufacturing Market (2026-2032)
- Mauritius Aseptic Manufacturing Market (2026-2032)
Industry Events and Analyst Meet

HIMTEX 2026

India Refining Summit 2026

India EV Show 2026

EV tech India Expo 2026

Auto Tech Asia 2026
Whitepaper
- Middle East & Africa Commercial Security Market Click here to view more.
- Middle East & Africa Fire Safety Systems & Equipment Market Click here to view more.
- GCC Drone Market Click here to view more.
- Middle East Lighting Fixture Market Click here to view more.
- GCC Physical & Perimeter Security Market Click here to view more.