Slovenia Noble Gases Market (2026-2032) | Growth, Investment Trends, Revenue, Companies, Pricing Analysis, Competition, Size, Drivers, Restraints, Value, Challenges, Strategy, Demand, Competitive, Opportunities, Consumer Insights, Supply, Segments, Strategic Insights, Trends, Outlook, Segmentation, Industry, Share, Analysis, Forecast
Market Forecast By Type (Helium, Neon, Argon, Krypton), By Application (Cryogenics, Lighting, Welding, Insulation), By End User (Healthcare, Electronics, Metal Industry, Construction) And Competitive Landscape
| Product Code: ETC12753828 | Publication Date: Apr 2025 | Updated Date: Apr 2026 | Product Type: Market Research Report | |
| Publisher: 6Wresearch | Author: Sachin Kumar Rai | No. of Pages: 65 | No. of Figures: 34 | No. of Tables: 19 |
Slovenia Noble Gases Market Size (2020-2030)
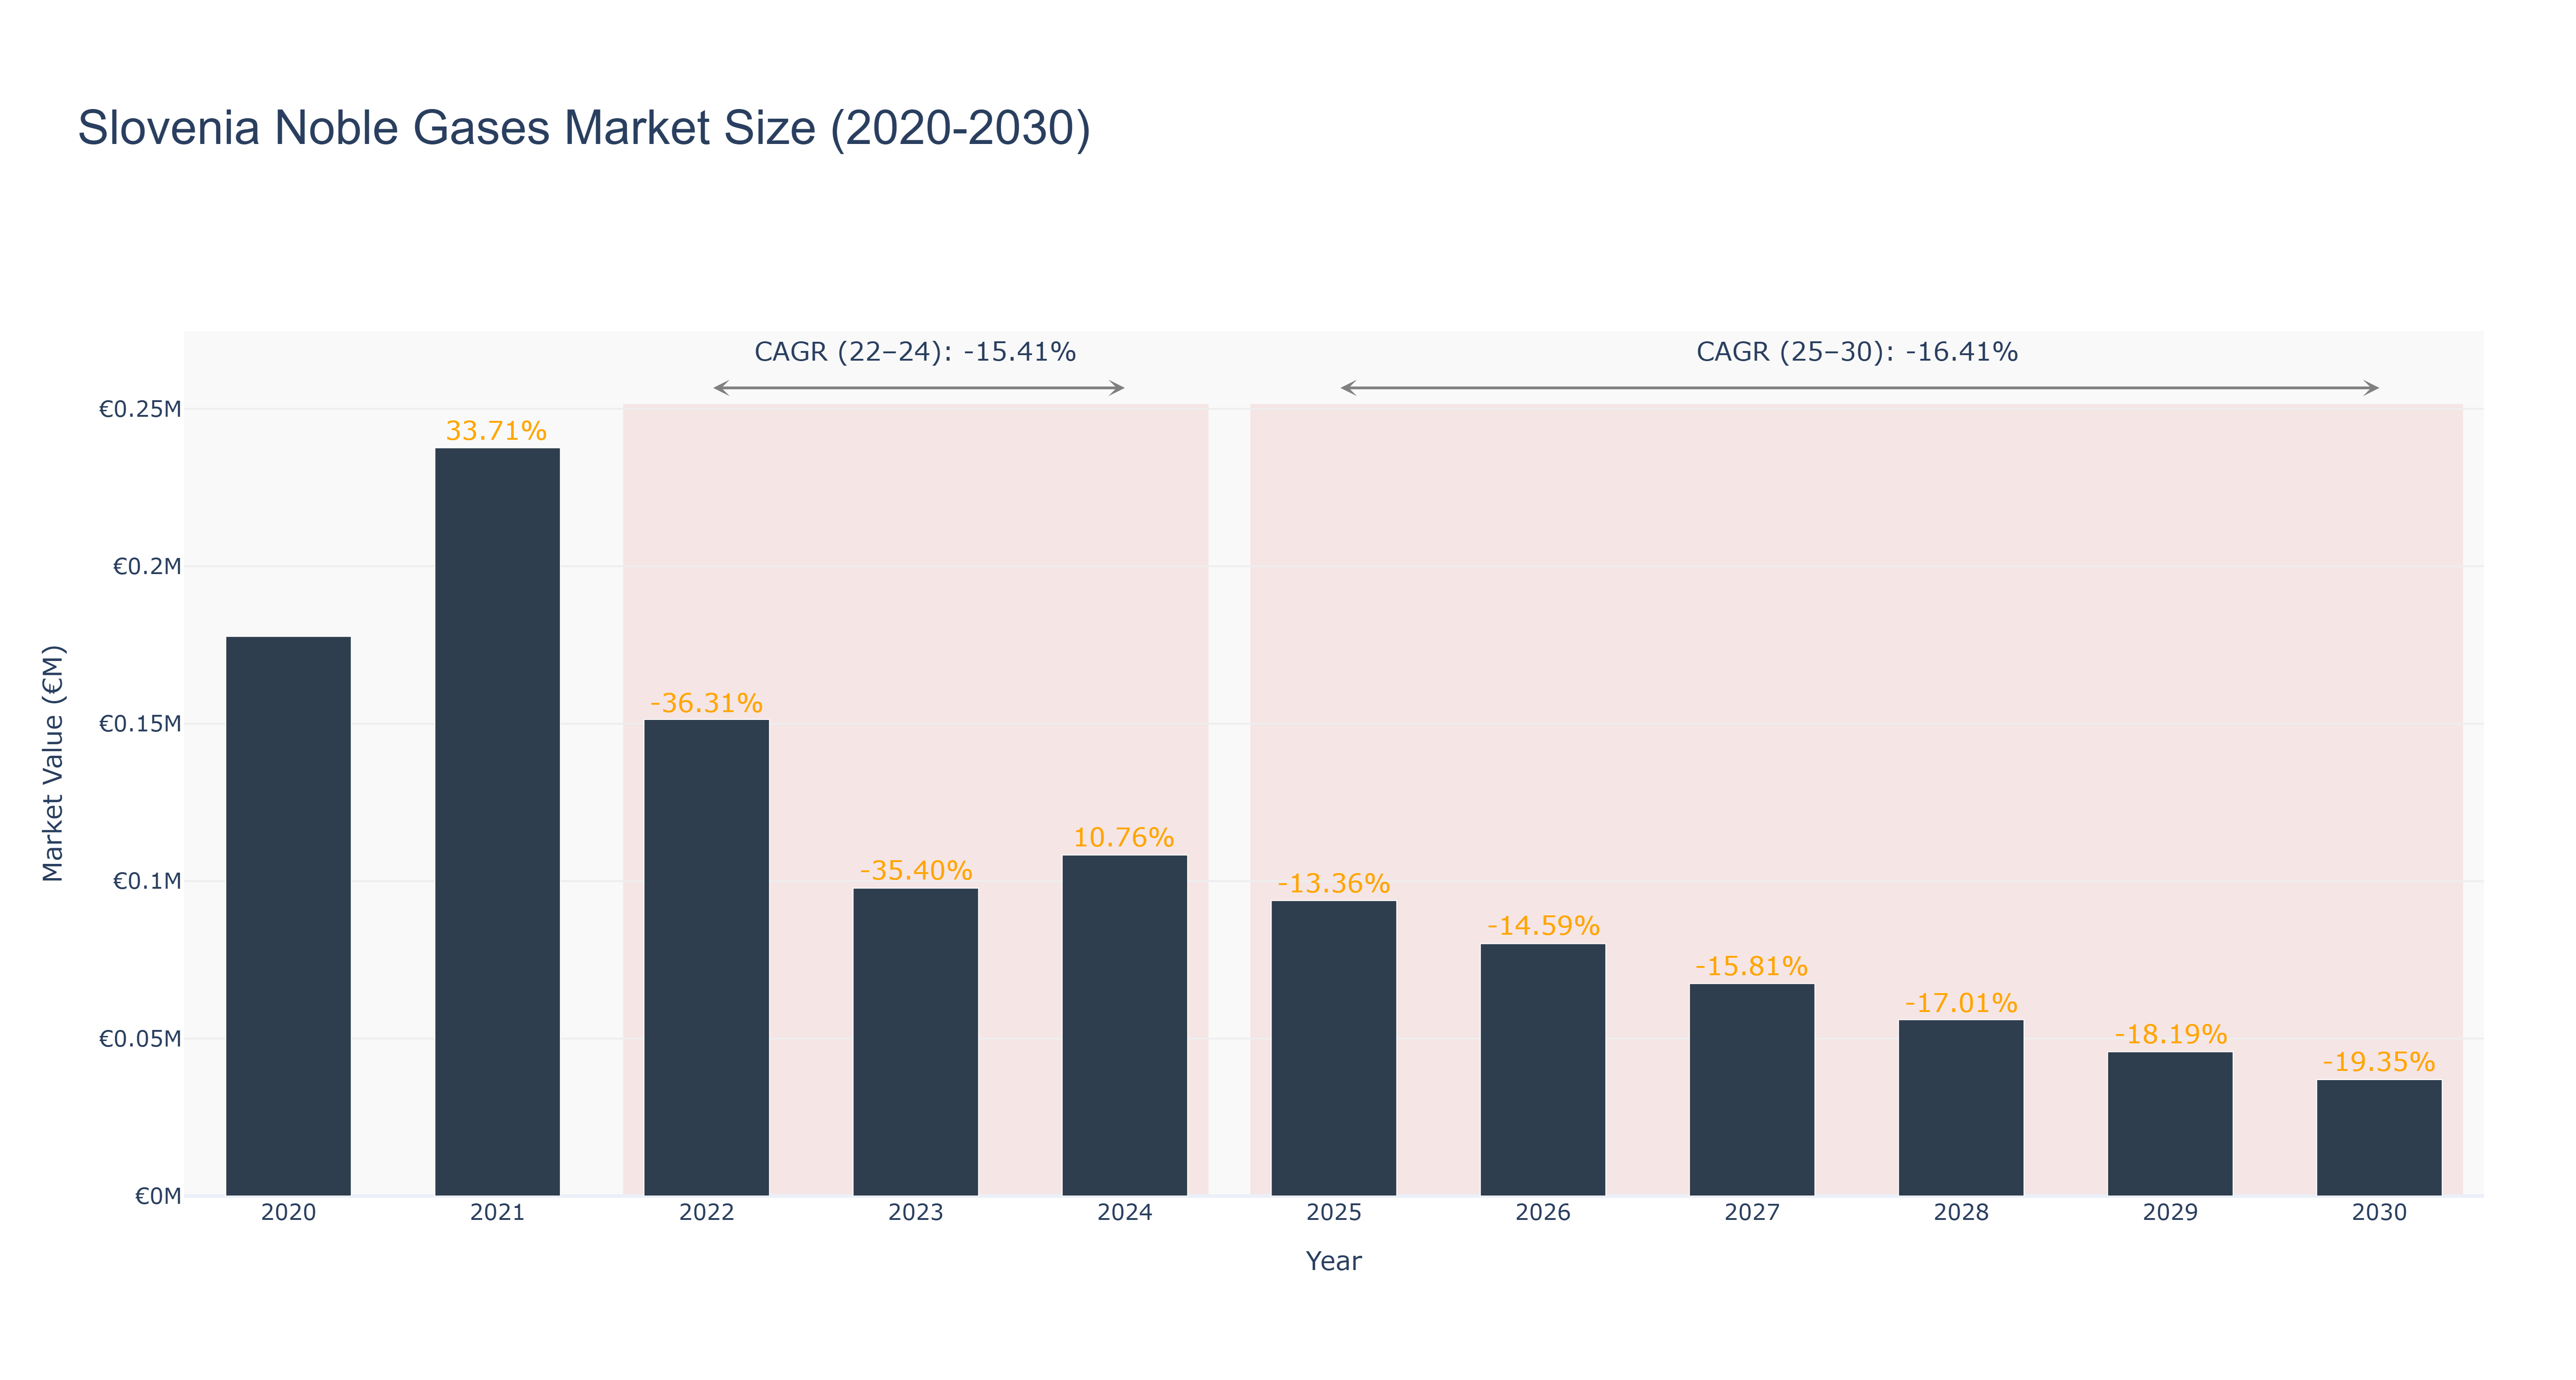
The Slovenia Noble Gases Market experienced a peak size of €0.24 million in 2021, followed by a decline to €0.11 million in 2024. The market is forecasted to continue shrinking, reaching an estimated size of €0.04 million by 2030. The CAGR for the period 2022-24 is -15.41%, while for 2025-30, it is projected at -16.41%. The downward trend in market size can be attributed to factors such as technological advancements leading to reduced demand for noble gases, economic fluctuations impacting industrial usage, and increasing focus on sustainable energy solutions. Looking ahead, Slovenia is set to invest in renewable energy projects to reduce reliance on noble gases, aligning with global sustainability goals and driving innovation in the energy sector. These developments aim to reshape the market landscape and foster long-term growth opportunities.
Slovenia Noble Gases Market: Production & Trade Performance (2019-2025)
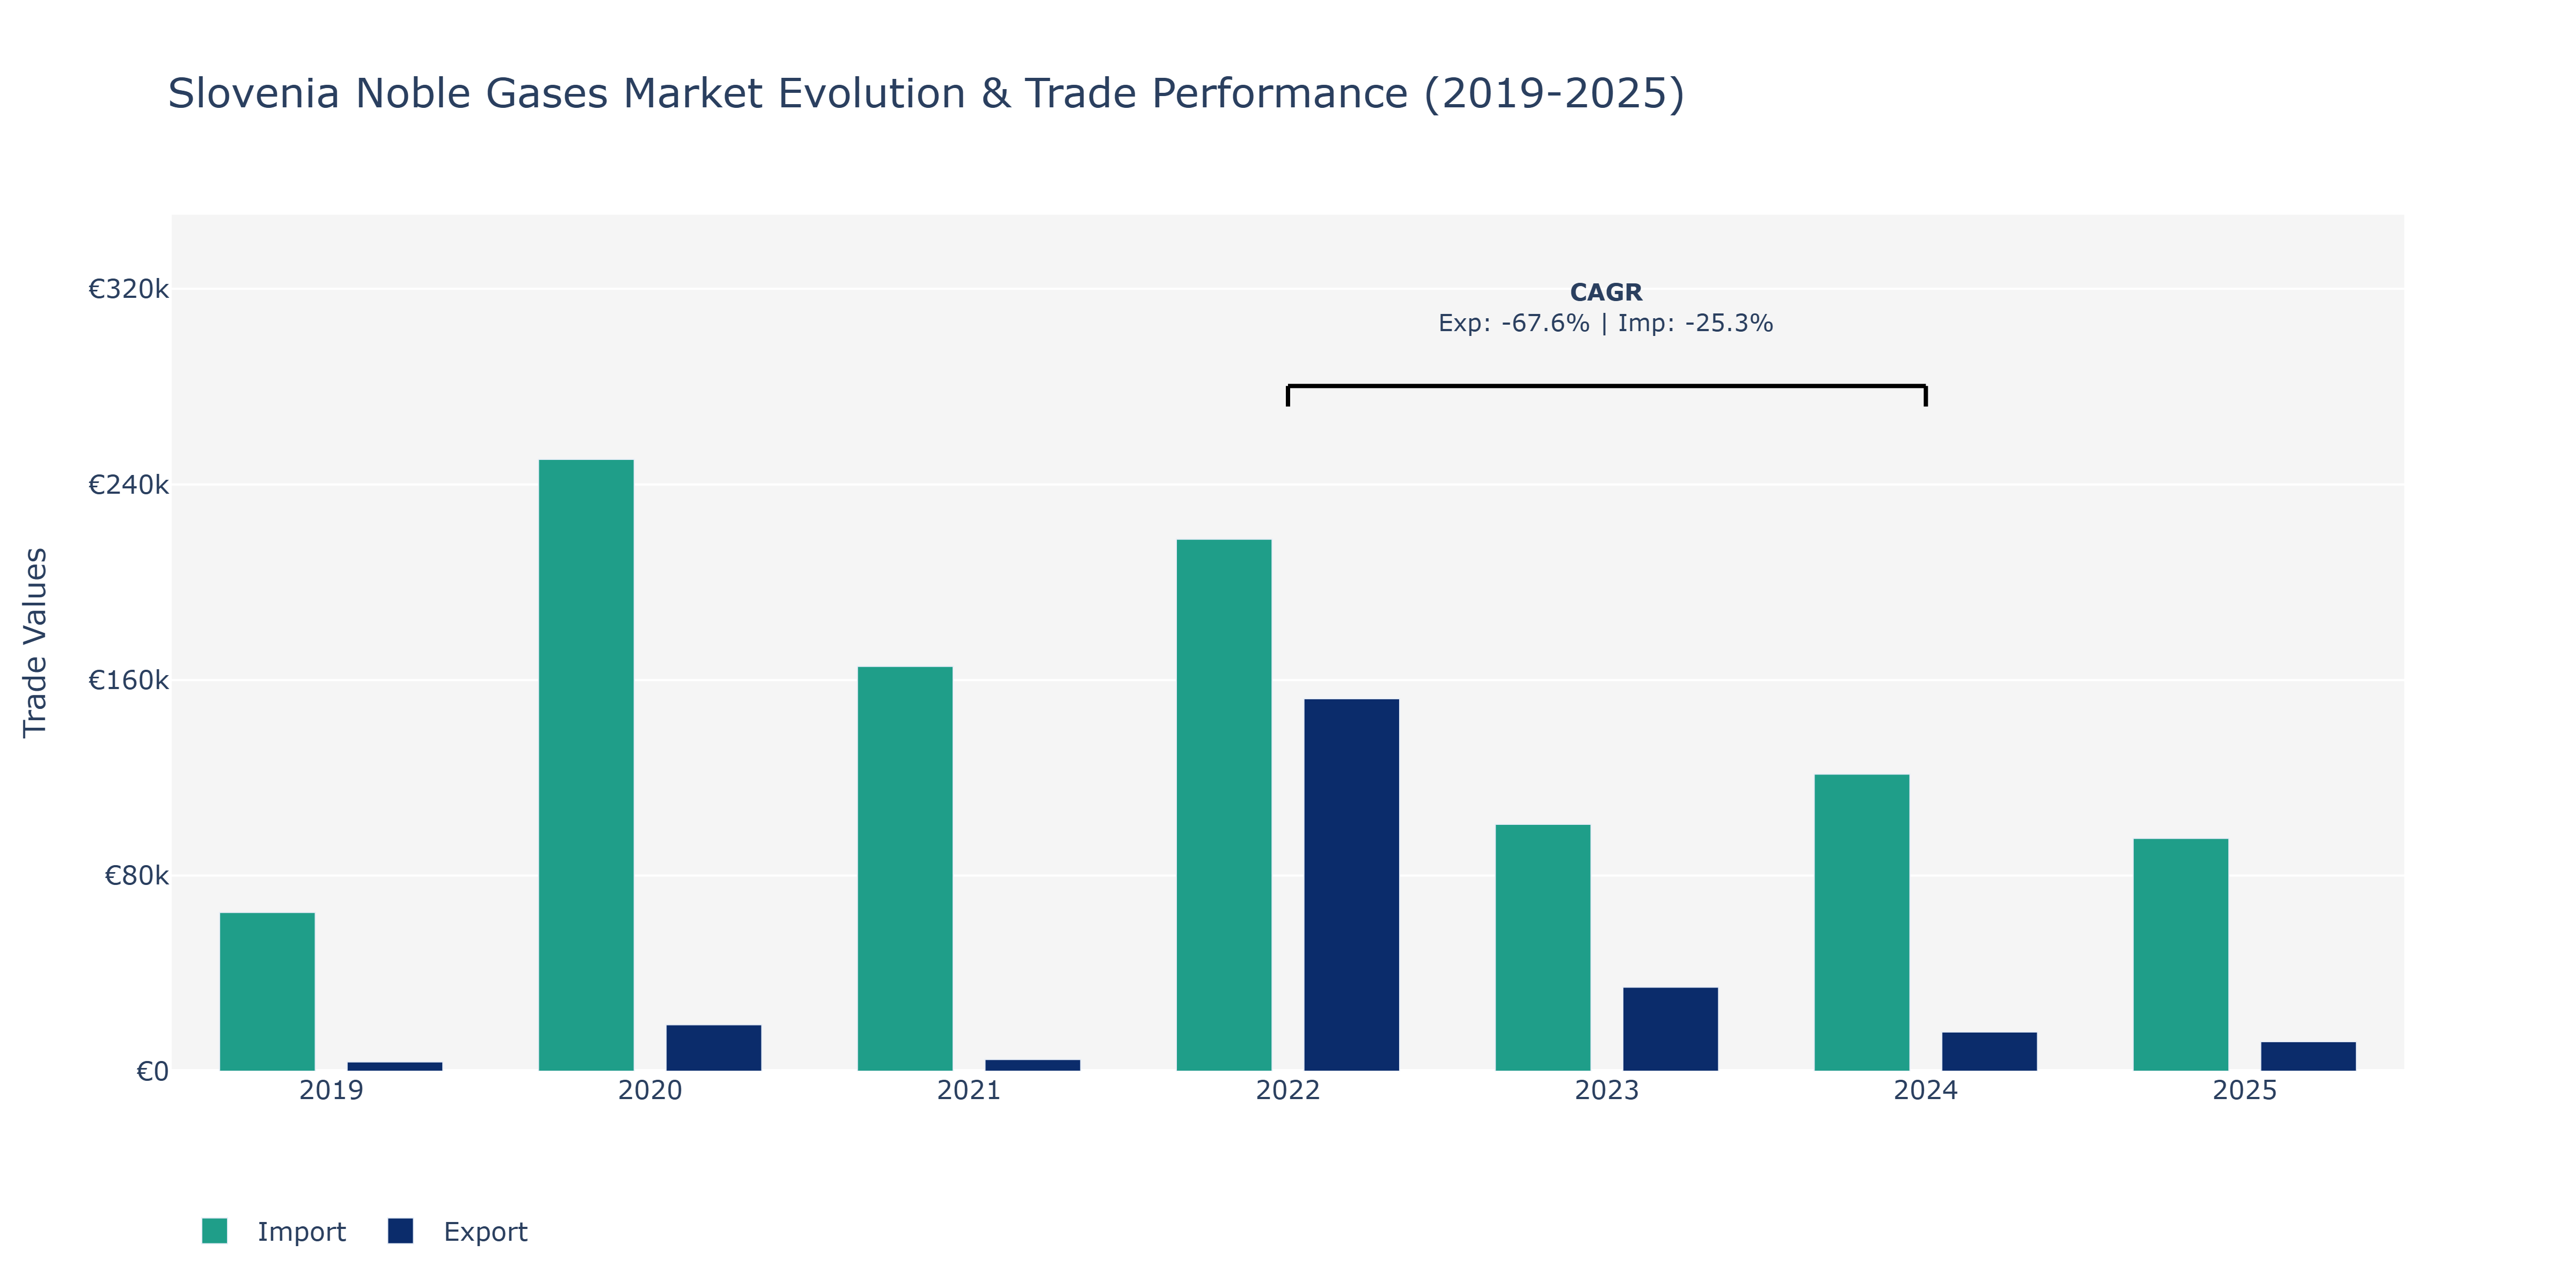
In the Slovenia Noble Gases Market, exports and imports displayed notable fluctuations over the years. In 2019, exports stood at €3.77 thousand and experienced a sharp increase to reach €19.0 thousand in 2020, marking a peak. However, a substantial decline followed, with exports decreasing to €4.75 thousand in 2021. Conversely, imports surged from €64.92 thousand in 2019 to €250.26 thousand in 2020, indicating a substantial peak, possibly driven by increased industrial demand or specific projects. The subsequent years saw varying trends, with exports rebounding to €152.37 thousand in 2022, while imports decreased to €100.96 thousand in 2023 before stabilizing around €121.53 thousand in 2024 and €95.24 thousand in 2025. The fluctuations in exports and imports could be attributed to global market dynamics, shifts in domestic consumption patterns, or changes in regulatory frameworks impacting trade volumes within the noble gases sector in Slovenia.
Key Highlights of the Report:
- Slovenia Noble Gases Market Outlook
- Market Size of Slovenia Noble Gases Market, 2025
- Forecast of Slovenia Noble Gases Market, 2032
- Historical Data and Forecast of Slovenia Noble Gases Revenues & Volume for the Period 2022-2032F
- Slovenia Noble Gases Market Trend Evolution
- Slovenia Noble Gases Market Drivers and Challenges
- Slovenia Noble Gases Price Trends
- Slovenia Noble Gases Porter's Five Forces
- Slovenia Noble Gases Industry Life Cycle
- Historical Data and Forecast of Slovenia Noble Gases Market Revenues & Volume By Type for the Period 2022-2032F
- Historical Data and Forecast of Slovenia Noble Gases Market Revenues & Volume By Helium for the Period 2022-2032F
- Historical Data and Forecast of Slovenia Noble Gases Market Revenues & Volume By Neon for the Period 2022-2032F
- Historical Data and Forecast of Slovenia Noble Gases Market Revenues & Volume By Argon for the Period 2022-2032F
- Historical Data and Forecast of Slovenia Noble Gases Market Revenues & Volume By Krypton for the Period 2022-2032F
- Historical Data and Forecast of Slovenia Noble Gases Market Revenues & Volume By Application for the Period 2022-2032F
- Historical Data and Forecast of Slovenia Noble Gases Market Revenues & Volume By Cryogenics for the Period 2022-2032F
- Historical Data and Forecast of Slovenia Noble Gases Market Revenues & Volume By Lighting for the Period 2022-2032F
- Historical Data and Forecast of Slovenia Noble Gases Market Revenues & Volume By Welding for the Period 2022-2032F
- Historical Data and Forecast of Slovenia Noble Gases Market Revenues & Volume By Insulation for the Period 2022-2032F
- Historical Data and Forecast of Slovenia Noble Gases Market Revenues & Volume By End User for the Period 2022-2032F
- Historical Data and Forecast of Slovenia Noble Gases Market Revenues & Volume By Healthcare for the Period 2022-2032F
- Historical Data and Forecast of Slovenia Noble Gases Market Revenues & Volume By Electronics for the Period 2022-2032F
- Historical Data and Forecast of Slovenia Noble Gases Market Revenues & Volume By Metal Industry for the Period 2022-2032F
- Historical Data and Forecast of Slovenia Noble Gases Market Revenues & Volume By Construction for the Period 2022-2032F
- Slovenia Noble Gases Import Export Trade Statistics
- Market Opportunity Assessment By Type
- Market Opportunity Assessment By Application
- Market Opportunity Assessment By End User
- Slovenia Noble Gases Top Companies Market Share
- Slovenia Noble Gases Competitive Benchmarking By Technical and Operational Parameters
- Slovenia Noble Gases Company Profiles
- Slovenia Noble Gases Key Strategic Recommendations
Frequently Asked Questions About the Market Study (FAQs):
6Wresearch actively monitors the Slovenia Noble Gases Market and publishes its comprehensive annual report, highlighting emerging trends, growth drivers, revenue analysis, and forecast outlook. Our insights help businesses to make data-backed strategic decisions with ongoing market dynamics. Our analysts track relevent industries related to the Slovenia Noble Gases Market, allowing our clients with actionable intelligence and reliable forecasts tailored to emerging regional needs.
Yes, we provide customisation as per your requirements. To learn more, feel free to contact us on sales@6wresearch.com
1 Executive Summary |
2 Introduction |
2.1 Key Highlights of the Report |
2.2 Report Description |
2.3 Market Scope & Segmentation |
2.4 Research Methodology |
2.5 Assumptions |
3 Slovenia Noble Gases Market Overview |
3.1 Slovenia Country Macro Economic Indicators |
3.2 Slovenia Noble Gases Market Revenues & Volume, 2022 & 2032F |
3.3 Slovenia Noble Gases Market - Industry Life Cycle |
3.4 Slovenia Noble Gases Market - Porter's Five Forces |
3.5 Slovenia Noble Gases Market Revenues & Volume Share, By Type, 2022 & 2032F |
3.6 Slovenia Noble Gases Market Revenues & Volume Share, By Application, 2022 & 2032F |
3.7 Slovenia Noble Gases Market Revenues & Volume Share, By End User, 2022 & 2032F |
4 Slovenia Noble Gases Market Dynamics |
4.1 Impact Analysis |
4.2 Market Drivers |
4.2.1 Growing demand for noble gases in various industries such as healthcare, electronics, and manufacturing |
4.2.2 Increasing adoption of noble gases in analytical and diagnostic applications |
4.2.3 Advancements in technology leading to new applications of noble gases |
4.3 Market Restraints |
4.3.1 High cost associated with the production and purification of noble gases |
4.3.2 Limited availability of noble gases in the market |
4.3.3 Stringent regulations related to the handling and storage of noble gases |
5 Slovenia Noble Gases Market Trends |
6 Slovenia Noble Gases Market, By Types |
6.1 Slovenia Noble Gases Market, By Type |
6.1.1 Overview and Analysis |
6.1.2 Slovenia Noble Gases Market Revenues & Volume, By Type, 2022 - 2032F |
6.1.3 Slovenia Noble Gases Market Revenues & Volume, By Helium, 2022 - 2032F |
6.1.4 Slovenia Noble Gases Market Revenues & Volume, By Neon, 2022 - 2032F |
6.1.5 Slovenia Noble Gases Market Revenues & Volume, By Argon, 2022 - 2032F |
6.1.6 Slovenia Noble Gases Market Revenues & Volume, By Krypton, 2022 - 2032F |
6.2 Slovenia Noble Gases Market, By Application |
6.2.1 Overview and Analysis |
6.2.2 Slovenia Noble Gases Market Revenues & Volume, By Cryogenics, 2022 - 2032F |
6.2.3 Slovenia Noble Gases Market Revenues & Volume, By Lighting, 2022 - 2032F |
6.2.4 Slovenia Noble Gases Market Revenues & Volume, By Welding, 2022 - 2032F |
6.2.5 Slovenia Noble Gases Market Revenues & Volume, By Insulation, 2022 - 2032F |
6.3 Slovenia Noble Gases Market, By End User |
6.3.1 Overview and Analysis |
6.3.2 Slovenia Noble Gases Market Revenues & Volume, By Healthcare, 2022 - 2032F |
6.3.3 Slovenia Noble Gases Market Revenues & Volume, By Electronics, 2022 - 2032F |
6.3.4 Slovenia Noble Gases Market Revenues & Volume, By Metal Industry, 2022 - 2032F |
6.3.5 Slovenia Noble Gases Market Revenues & Volume, By Construction, 2022 - 2032F |
7 Slovenia Noble Gases Market Import-Export Trade Statistics |
7.1 Slovenia Noble Gases Market Export to Major Countries |
7.2 Slovenia Noble Gases Market Imports from Major Countries |
8 Slovenia Noble Gases Market Key Performance Indicators |
8.1 Research and development investment in noble gas applications |
8.2 Number of patents filed for new noble gas technologies |
8.3 Adoption rate of noble gases in emerging industries |
9 Slovenia Noble Gases Market - Opportunity Assessment |
9.1 Slovenia Noble Gases Market Opportunity Assessment, By Type, 2022 & 2032F |
9.2 Slovenia Noble Gases Market Opportunity Assessment, By Application, 2022 & 2032F |
9.3 Slovenia Noble Gases Market Opportunity Assessment, By End User, 2022 & 2032F |
10 Slovenia Noble Gases Market - Competitive Landscape |
10.1 Slovenia Noble Gases Market Revenue Share, By Companies, 2025 |
10.2 Slovenia Noble Gases Market Competitive Benchmarking, By Operating and Technical Parameters |
11 Company Profiles |
12 Recommendations |
13 Disclaimer |
Export potential assessment - trade Analytics for 2030
Export potential enables firms to identify high-growth global markets with greater confidence by combining advanced trade intelligence with a structured quantitative methodology. The framework analyzes emerging demand trends and country-level import patterns while integrating macroeconomic and trade datasets such as GDP and population forecasts, bilateral import–export flows, tariff structures, elasticity differentials between developed and developing economies, geographic distance, and import demand projections. Using weighted trade values from 2020–2024 as the base period to project country-to-country export potential for 2030, these inputs are operationalized through calculated drivers such as gravity model parameters, tariff impact factors, and projected GDP per-capita growth. Through an analysis of hidden potentials, demand hotspots, and market conditions that are most favorable to success, this method enables firms to focus on target countries, maximize returns, and global expansion with data, backed by accuracy.
By factoring in the projected importer demand gap that is currently unmet and could be potential opportunity, it identifies the potential for the Exporter (Country) among 190 countries, against the general trade analysis, which identifies the biggest importer or exporter.
To discover high-growth global markets and optimize your business strategy:
Click Here
Pricing
- Single User License$ 1,995
- Department License$ 2,400
- Site License$ 3,120
- Global License$ 3,795

Thought Leadership
Search
Thought Leadership and Analyst Meet


Our Clients
Latest Reports
- New Zealand Aseptic Manufacturing Market (2026-2032)
- Netherlands Aseptic Manufacturing Market (2026-2032)
- Nauru Aseptic Manufacturing Market (2026-2032)
- Namibia Aseptic Manufacturing Market (2026-2032)
- Mozambique Aseptic Manufacturing Market (2026-2032)
- Montenegro Aseptic Manufacturing Market (2026-2032)
- Mongolia Aseptic Manufacturing Market (2026-2032)
- Monaco Aseptic Manufacturing Market (2026-2032)
- Micronesia Aseptic Manufacturing Market (2026-2032)
- Mauritius Aseptic Manufacturing Market (2026-2032)
Industry Events and Analyst Meet

HIMTEX 2026

India Refining Summit 2026

India EV Show 2026

EV tech India Expo 2026

Auto Tech Asia 2026
Whitepaper
- Middle East & Africa Commercial Security Market Click here to view more.
- Middle East & Africa Fire Safety Systems & Equipment Market Click here to view more.
- GCC Drone Market Click here to view more.
- Middle East Lighting Fixture Market Click here to view more.
- GCC Physical & Perimeter Security Market Click here to view more.
6WResearch In News
- Doha a strategic location for EV manufacturing hub: IPA Qatar
- Demand for luxury TVs surging in the GCC, says Samsung
- Empowering Growth: The Thriving Journey of Bangladesh’s Cable Industry
- Demand for luxury TVs surging in the GCC, says Samsung
- Video call with a traditional healer? Once unthinkable, it’s now common in South Africa
- Intelligent Buildings To Smooth GCC’s Path To Net Zero