Slovenia Paint Can Market (2026-2032) | Size & Revenue, Growth, Analysis, Competitive Landscape, Companies, Trends, Share, Outlook, Forecast, Segmentation, Industry, Value
Market Forecast By Type (Metal Paint Cans, Plastic Paint Cans), By Application (Chemical, Building, Painting, Other) And Competitive Landscape
| Product Code: ETC9323855 | Publication Date: Sep 2024 | Updated Date: Apr 2026 | Product Type: Market Research Report | |
| Publisher: 6Wresearch | Author: Summon Dutta | No. of Pages: 75 | No. of Figures: 35 | No. of Tables: 20 |
Slovenia Paint Can Market Size (2020-2030)
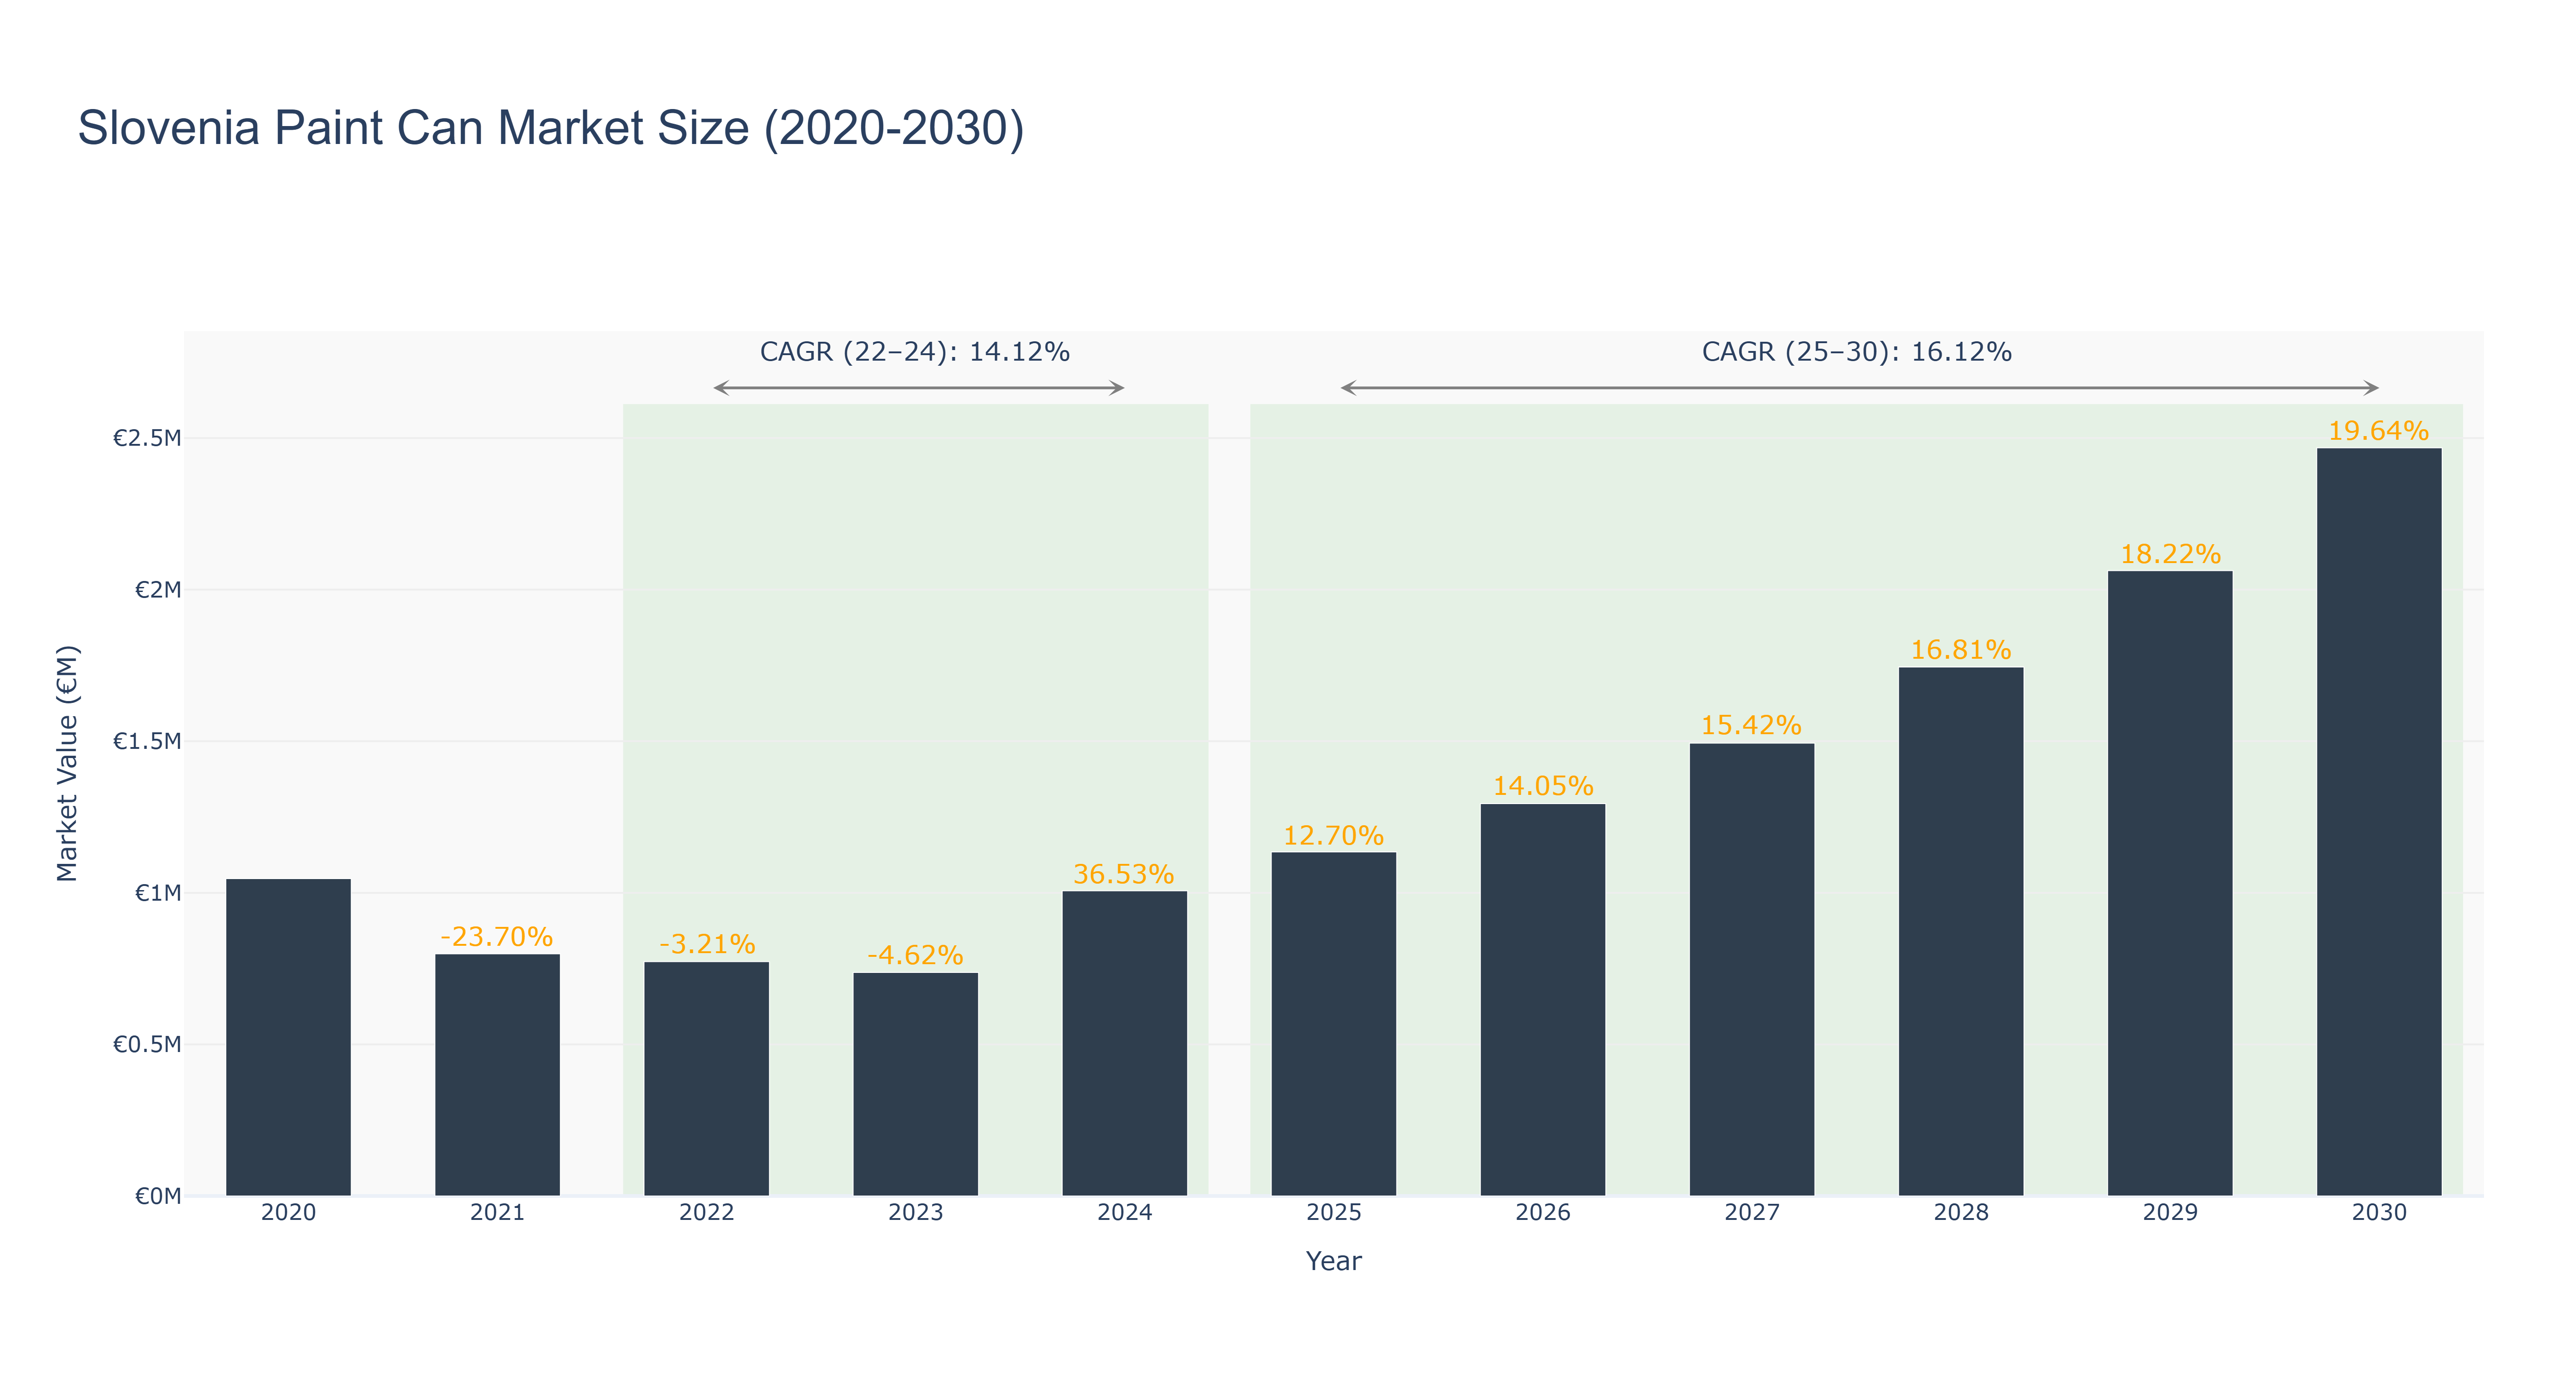
The Slovenia Paint Can Market experienced a notable peak in 2020, reaching a market size of €1.05 million, followed by a decline in subsequent years, with 2021 witnessing a significant drop of 23.70% to €798.79 thousand. The actual market sizes for 2022 and 2023 were €773.12 thousand and €737.40 thousand, respectively, reflecting a challenging environment primarily driven by fluctuating demand and economic uncertainties. However, a robust recovery is anticipated from 2024 onwards, with the market projected to grow to €1.01 million, driven by increased construction activities and home improvement trends, leading to a CAGR of 14.12% through 2024. The forecasted period from 2025 to 2030 shows promising growth, with the market expected to reach €2.47 million, supported by a CAGR of 16.12%, as innovation in sustainable packaging and rising environmental awareness further enhance market dynamics.
Slovenia Paint Can Market: Production & Trade Performance (2019-2025)
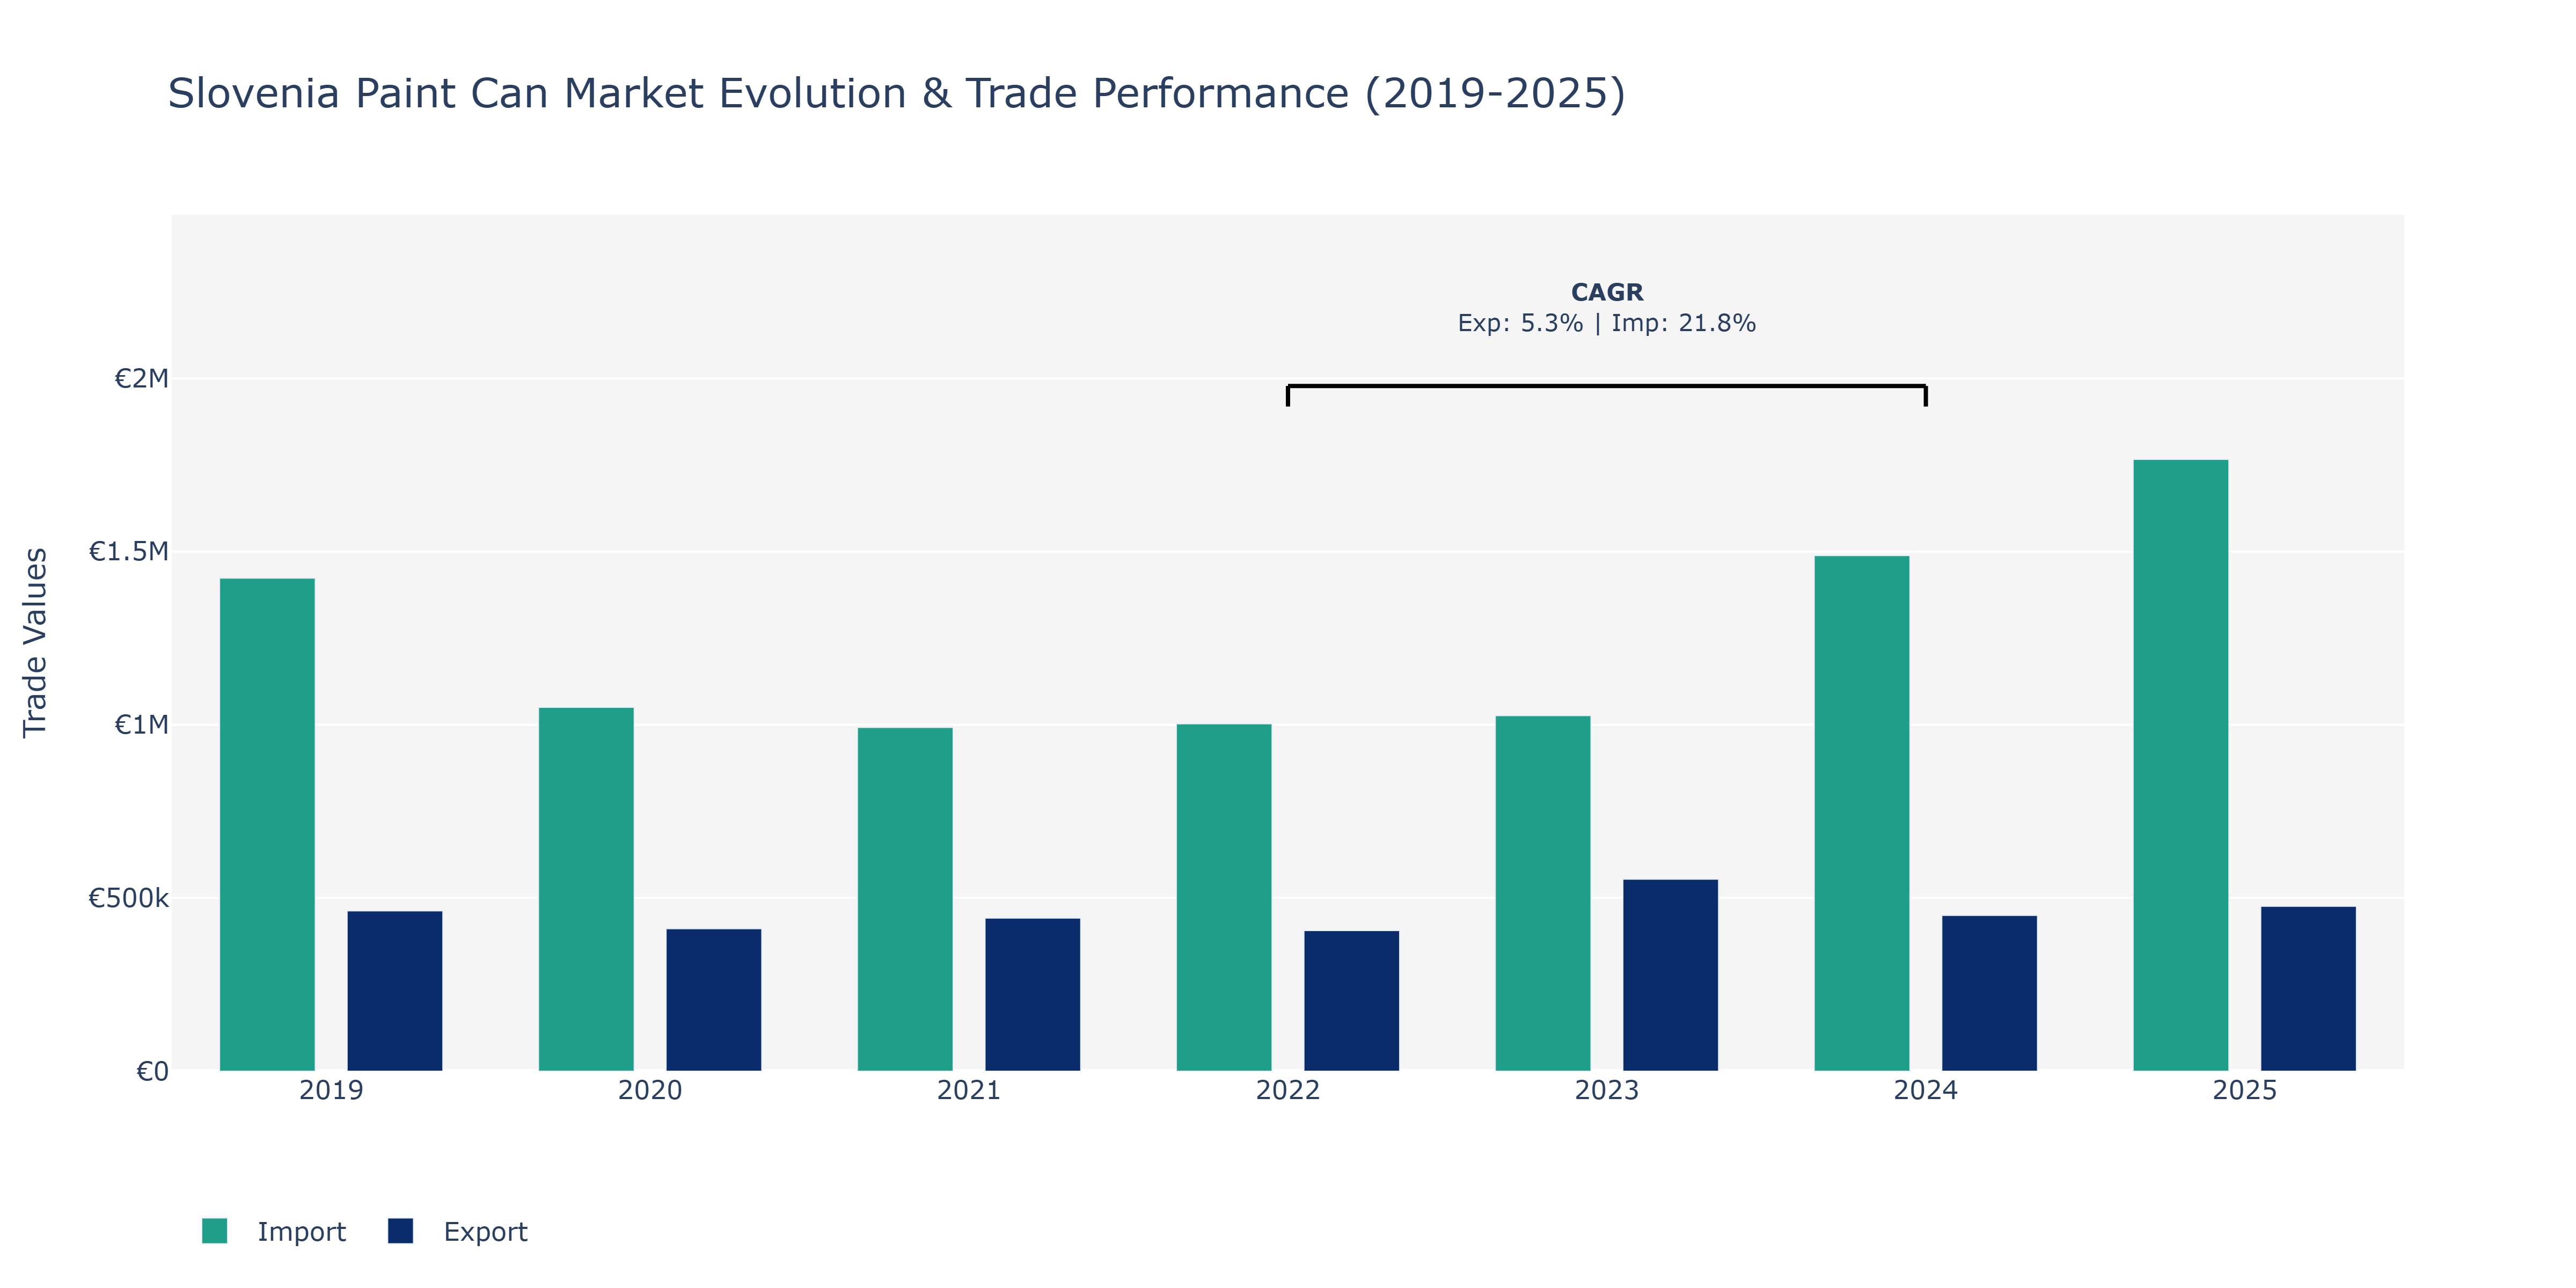
Between 2019 and 2025, Slovenia's Paint Can Market witnessed fluctuations in both exports and imports. In 2019, exports were at €462.9 thousand, followed by a decline to €411.42 thousand in 2020, likely due to global economic uncertainties impacting demand. However, exports rebounded in 2021 to €441.94 thousand and peaked in 2023 at €554.3 thousand, reflecting potential market expansion or new international partnerships. On the other hand, imports fluctuated, decreasing from €1.42 million in 2019 to €1.05 million in 2020, possibly due to supply chain disruptions. Imports then rose gradually, reaching €1.77 million in 2025, indicating growing demand for foreign paint cans in the Slovenian market. The increase in imports could be attributed to technological advancements in manufacturing processes, encouraging the import of specialized paint cans not produced domestically.
Key Highlights of the Report:
- Slovenia Paint Can Market Outlook
- Market Size of Slovenia Paint Can Market, 2025
- Forecast of Slovenia Paint Can Market, 2032
- Historical Data and Forecast of Slovenia Paint Can Revenues & Volume for the Period 2022-2032F
- Slovenia Paint Can Market Trend Evolution
- Slovenia Paint Can Market Drivers and Challenges
- Slovenia Paint Can Price Trends
- Slovenia Paint Can Porter's Five Forces
- Slovenia Paint Can Industry Life Cycle
- Historical Data and Forecast of Slovenia Paint Can Market Revenues & Volume By Type for the Period 2022-2032F
- Historical Data and Forecast of Slovenia Paint Can Market Revenues & Volume By Metal Paint Cans for the Period 2022-2032F
- Historical Data and Forecast of Slovenia Paint Can Market Revenues & Volume By Plastic Paint Cans for the Period 2022-2032F
- Historical Data and Forecast of Slovenia Paint Can Market Revenues & Volume By Application for the Period 2022-2032F
- Historical Data and Forecast of Slovenia Paint Can Market Revenues & Volume By Chemical for the Period 2022-2032F
- Historical Data and Forecast of Slovenia Paint Can Market Revenues & Volume By Building for the Period 2022-2032F
- Historical Data and Forecast of Slovenia Paint Can Market Revenues & Volume By Painting for the Period 2022-2032F
- Historical Data and Forecast of Slovenia Paint Can Market Revenues & Volume By Other for the Period 2022-2032F
- Slovenia Paint Can Import Export Trade Statistics
- Market Opportunity Assessment By Type
- Market Opportunity Assessment By Application
- Slovenia Paint Can Top Companies Market Share
- Slovenia Paint Can Competitive Benchmarking By Technical and Operational Parameters
- Slovenia Paint Can Company Profiles
- Slovenia Paint Can Key Strategic Recommendations
Frequently Asked Questions About the Market Study (FAQs):
6Wresearch actively monitors the Slovenia Paint Can Market and publishes its comprehensive annual report, highlighting emerging trends, growth drivers, revenue analysis, and forecast outlook. Our insights help businesses to make data-backed strategic decisions with ongoing market dynamics. Our analysts track relevent industries related to the Slovenia Paint Can Market, allowing our clients with actionable intelligence and reliable forecasts tailored to emerging regional needs.
Yes, we provide customisation as per your requirements. To learn more, feel free to contact us on sales@6wresearch.com
1 Executive Summary |
2 Introduction |
2.1 Key Highlights of the Report |
2.2 Report Description |
2.3 Market Scope & Segmentation |
2.4 Research Methodology |
2.5 Assumptions |
3 Slovenia Paint Can Market Overview |
3.1 Slovenia Country Macro Economic Indicators |
3.2 Slovenia Paint Can Market Revenues & Volume, 2022 & 2032F |
3.3 Slovenia Paint Can Market - Industry Life Cycle |
3.4 Slovenia Paint Can Market - Porter's Five Forces |
3.5 Slovenia Paint Can Market Revenues & Volume Share, By Type, 2022 & 2032F |
3.6 Slovenia Paint Can Market Revenues & Volume Share, By Application, 2022 & 2032F |
4 Slovenia Paint Can Market Dynamics |
4.1 Impact Analysis |
4.2 Market Drivers |
4.2.1 Increasing construction activities in Slovenia leading to higher demand for paint cans |
4.2.2 Growing focus on sustainable and eco-friendly packaging solutions |
4.2.3 Innovation in paint can design and material to enhance product appeal and functionality |
4.3 Market Restraints |
4.3.1 Fluctuating raw material prices impacting production costs |
4.3.2 Stringent regulations related to packaging materials and recycling processes |
5 Slovenia Paint Can Market Trends |
6 Slovenia Paint Can Market, By Types |
6.1 Slovenia Paint Can Market, By Type |
6.1.1 Overview and Analysis |
6.1.2 Slovenia Paint Can Market Revenues & Volume, By Type, 2022-2032F |
6.1.3 Slovenia Paint Can Market Revenues & Volume, By Metal Paint Cans, 2022-2032F |
6.1.4 Slovenia Paint Can Market Revenues & Volume, By Plastic Paint Cans, 2022-2032F |
6.2 Slovenia Paint Can Market, By Application |
6.2.1 Overview and Analysis |
6.2.2 Slovenia Paint Can Market Revenues & Volume, By Chemical, 2022-2032F |
6.2.3 Slovenia Paint Can Market Revenues & Volume, By Building, 2022-2032F |
6.2.4 Slovenia Paint Can Market Revenues & Volume, By Painting, 2022-2032F |
6.2.5 Slovenia Paint Can Market Revenues & Volume, By Other, 2022-2032F |
7 Slovenia Paint Can Market Import-Export Trade Statistics |
7.1 Slovenia Paint Can Market Export to Major Countries |
7.2 Slovenia Paint Can Market Imports from Major Countries |
8 Slovenia Paint Can Market Key Performance Indicators |
8.1 Percentage of paint cans made from recycled materials |
8.2 Number of new paint can designs introduced in the market |
8.3 Adoption rate of eco-friendly paint can options by major paint manufacturers |
9 Slovenia Paint Can Market - Opportunity Assessment |
9.1 Slovenia Paint Can Market Opportunity Assessment, By Type, 2022 & 2032F |
9.2 Slovenia Paint Can Market Opportunity Assessment, By Application, 2022 & 2032F |
10 Slovenia Paint Can Market - Competitive Landscape |
10.1 Slovenia Paint Can Market Revenue Share, By Companies, 2025 |
10.2 Slovenia Paint Can Market Competitive Benchmarking, By Operating and Technical Parameters |
11 Company Profiles |
12 Recommendations |
13 Disclaimer |
Global Go To Market Strategy - 2030
Export potential enables firms to identify high-growth global markets with greater confidence by combining advanced trade intelligence with a structured quantitative methodology. The framework analyzes emerging demand trends and country-level import patterns while integrating macroeconomic and trade datasets such as GDP and population forecasts, bilateral import–export flows, tariff structures, elasticity differentials between developed and developing economies, geographic distance, and import demand projections. Using weighted trade values from 2020–2024 as the base period to project country-to-country export potential for 2030, these inputs are operationalized through calculated drivers such as gravity model parameters, tariff impact factors, and projected GDP per-capita growth. Through an analysis of hidden potentials, demand hotspots, and market conditions that are most favorable to success, this method enables firms to focus on target countries, maximize returns, and global expansion with data, backed by accuracy.
By factoring in the projected importer demand gap that is currently unmet and could be potential opportunity, it identifies the potential for the Exporter (Country) among 190 countries, against the general trade analysis, which identifies the biggest importer or exporter.
To discover high-growth global markets and optimize your business strategy:
Click Here
Pricing
- Single User License$ 1,995
- Department License$ 2,400
- Site License$ 3,120
- Global License$ 3,795

Leadership Perspectives from Industry Events
Search
Thought Leadership and Analyst Meet


Our Clients
6WResearch In News
- Doha a strategic location for EV manufacturing hub: IPA Qatar
- Demand for luxury TVs surging in the GCC, says Samsung
- Empowering Growth: The Thriving Journey of Bangladesh’s Cable Industry
- Demand for luxury TVs surging in the GCC, says Samsung
- Video call with a traditional healer? Once unthinkable, it’s now common in South Africa
- Intelligent Buildings To Smooth GCC’s Path To Net Zero
Latest Reports
- New Zealand Aseptic Manufacturing Market (2026-2032)
- Netherlands Aseptic Manufacturing Market (2026-2032)
- Nauru Aseptic Manufacturing Market (2026-2032)
- Namibia Aseptic Manufacturing Market (2026-2032)
- Mozambique Aseptic Manufacturing Market (2026-2032)
- Montenegro Aseptic Manufacturing Market (2026-2032)
- Mongolia Aseptic Manufacturing Market (2026-2032)
- Monaco Aseptic Manufacturing Market (2026-2032)
- Micronesia Aseptic Manufacturing Market (2026-2032)
- Mauritius Aseptic Manufacturing Market (2026-2032)
Industry Events and Analyst Meet

HIMTEX 2026

India Refining Summit 2026

India EV Show 2026

EV tech India Expo 2026

Auto Tech Asia 2026
Whitepaper
- Middle East & Africa Commercial Security Market Click here to view more.
- Middle East & Africa Fire Safety Systems & Equipment Market Click here to view more.
- GCC Drone Market Click here to view more.
- Middle East Lighting Fixture Market Click here to view more.
- GCC Physical & Perimeter Security Market Click here to view more.