Slovenia Sandblasting Machines Market (2026-2032) | Segmentation, Outlook, Revenue, Growth, Share, Forecast, Analysis, Trends, Value, Size, Industry & Companies
Market Forecast By Blasting Type (Dry Blasting, Wet Blasting), By Control System (Automatic, Semi-automatic, Manual), By Tank Capacity (Less than 1000L, 1000L - 2000L, 2000L - 3000L, More than 3000L), By Product (Portable, Stationary), By End-user (Automotive, Construction, Marine, Oil & Gas, Petrochemicals, Others) And Competitive Landscape
| Product Code: ETC5212504 | Publication Date: Nov 2023 | Updated Date: Apr 2026 | Product Type: Market Research Report | |
| Publisher: 6Wresearch | Author: Shubham Padhi | No. of Pages: 60 | No. of Figures: 30 | No. of Tables: 5 |
Slovenia Sandblasting Machines Market Size (2020-2030)
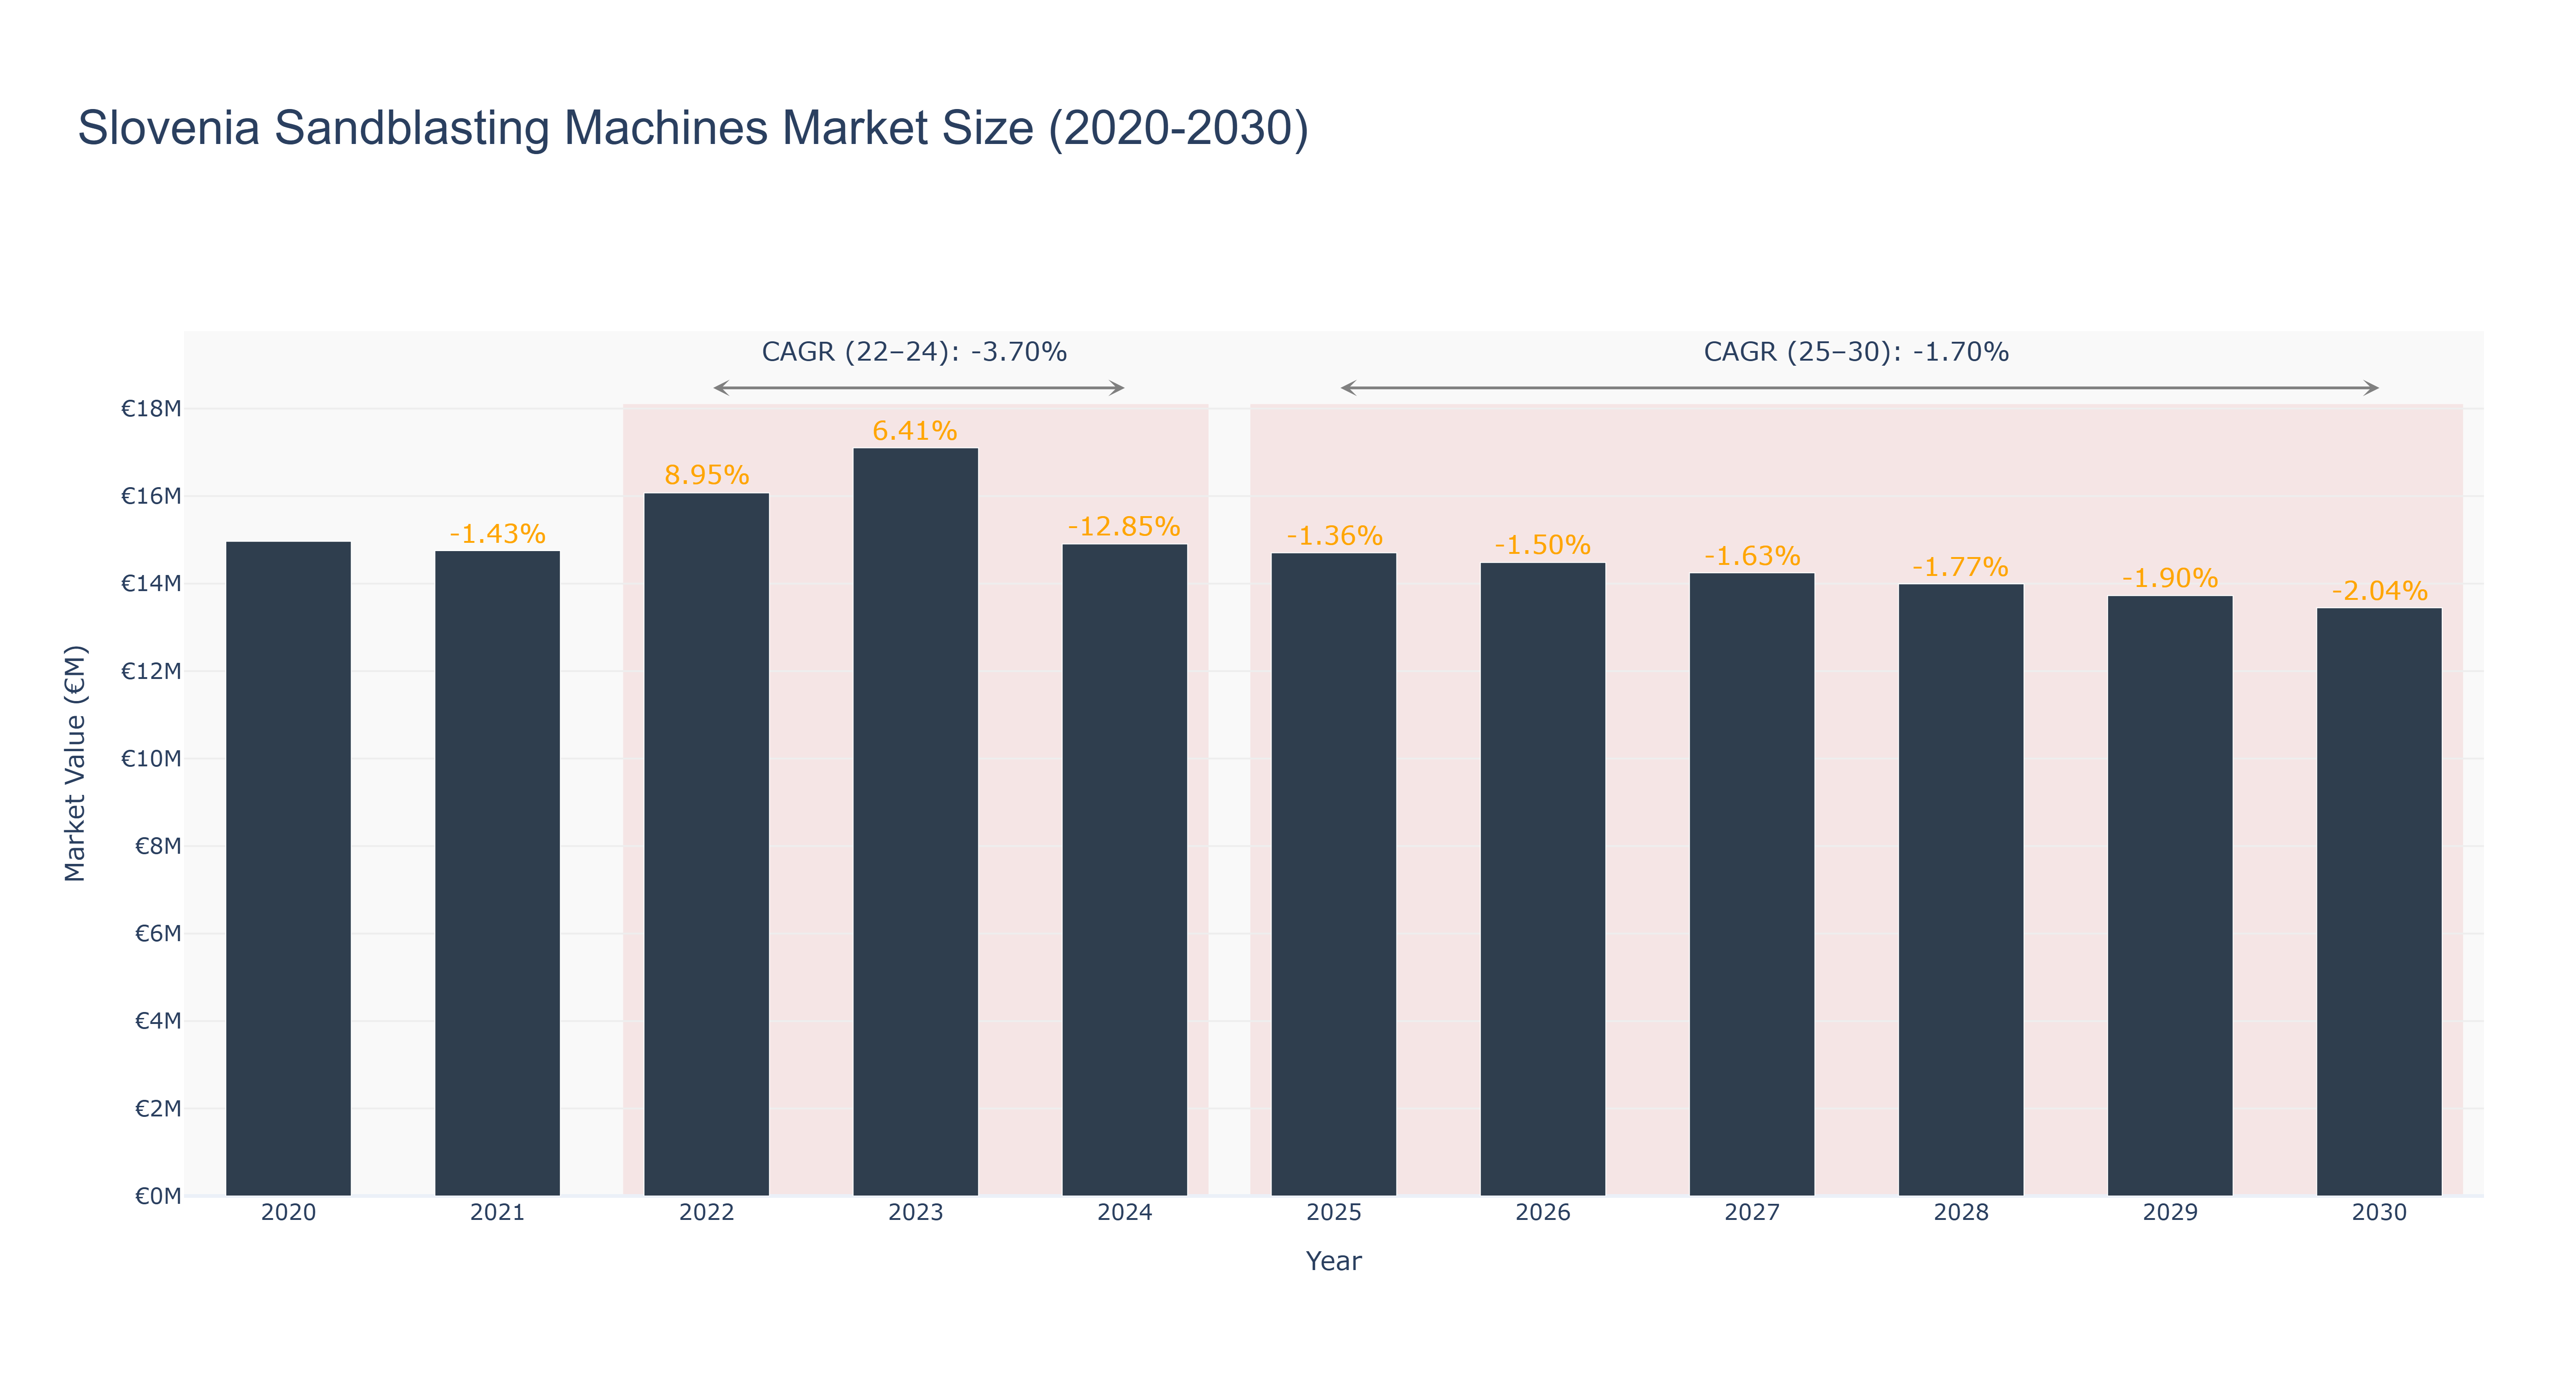
The Slovenia Sandblasting Machines Market experienced fluctuations from 2020 to 2024, peaking at €16.07 million in 2022 before declining to €14.91 million in 2024, reflecting a negative CAGR of -3.70% during this actual period. The market saw a notable growth of 8.95% in 2022, driven by increased investments in manufacturing and construction sectors, but faced challenges in subsequent years due to economic uncertainties and shifts in demand. Looking ahead, the forecasted period from 2025 to 2030 indicates a continued decline, with projected market sizes decreasing from €14.70 million in 2025 to €13.45 million by 2030, corresponding to a CAGR of -1.70%. This downturn may be attributed to technological advancements and a shift towards more efficient surface preparation methods. While no specific upcoming projects are highlighted, macroeconomic trends and evolving industry standards will significantly influence market dynamics moving forward.
Slovenia Sandblasting Machines Market: Production & Trade Performance (2019-2025)
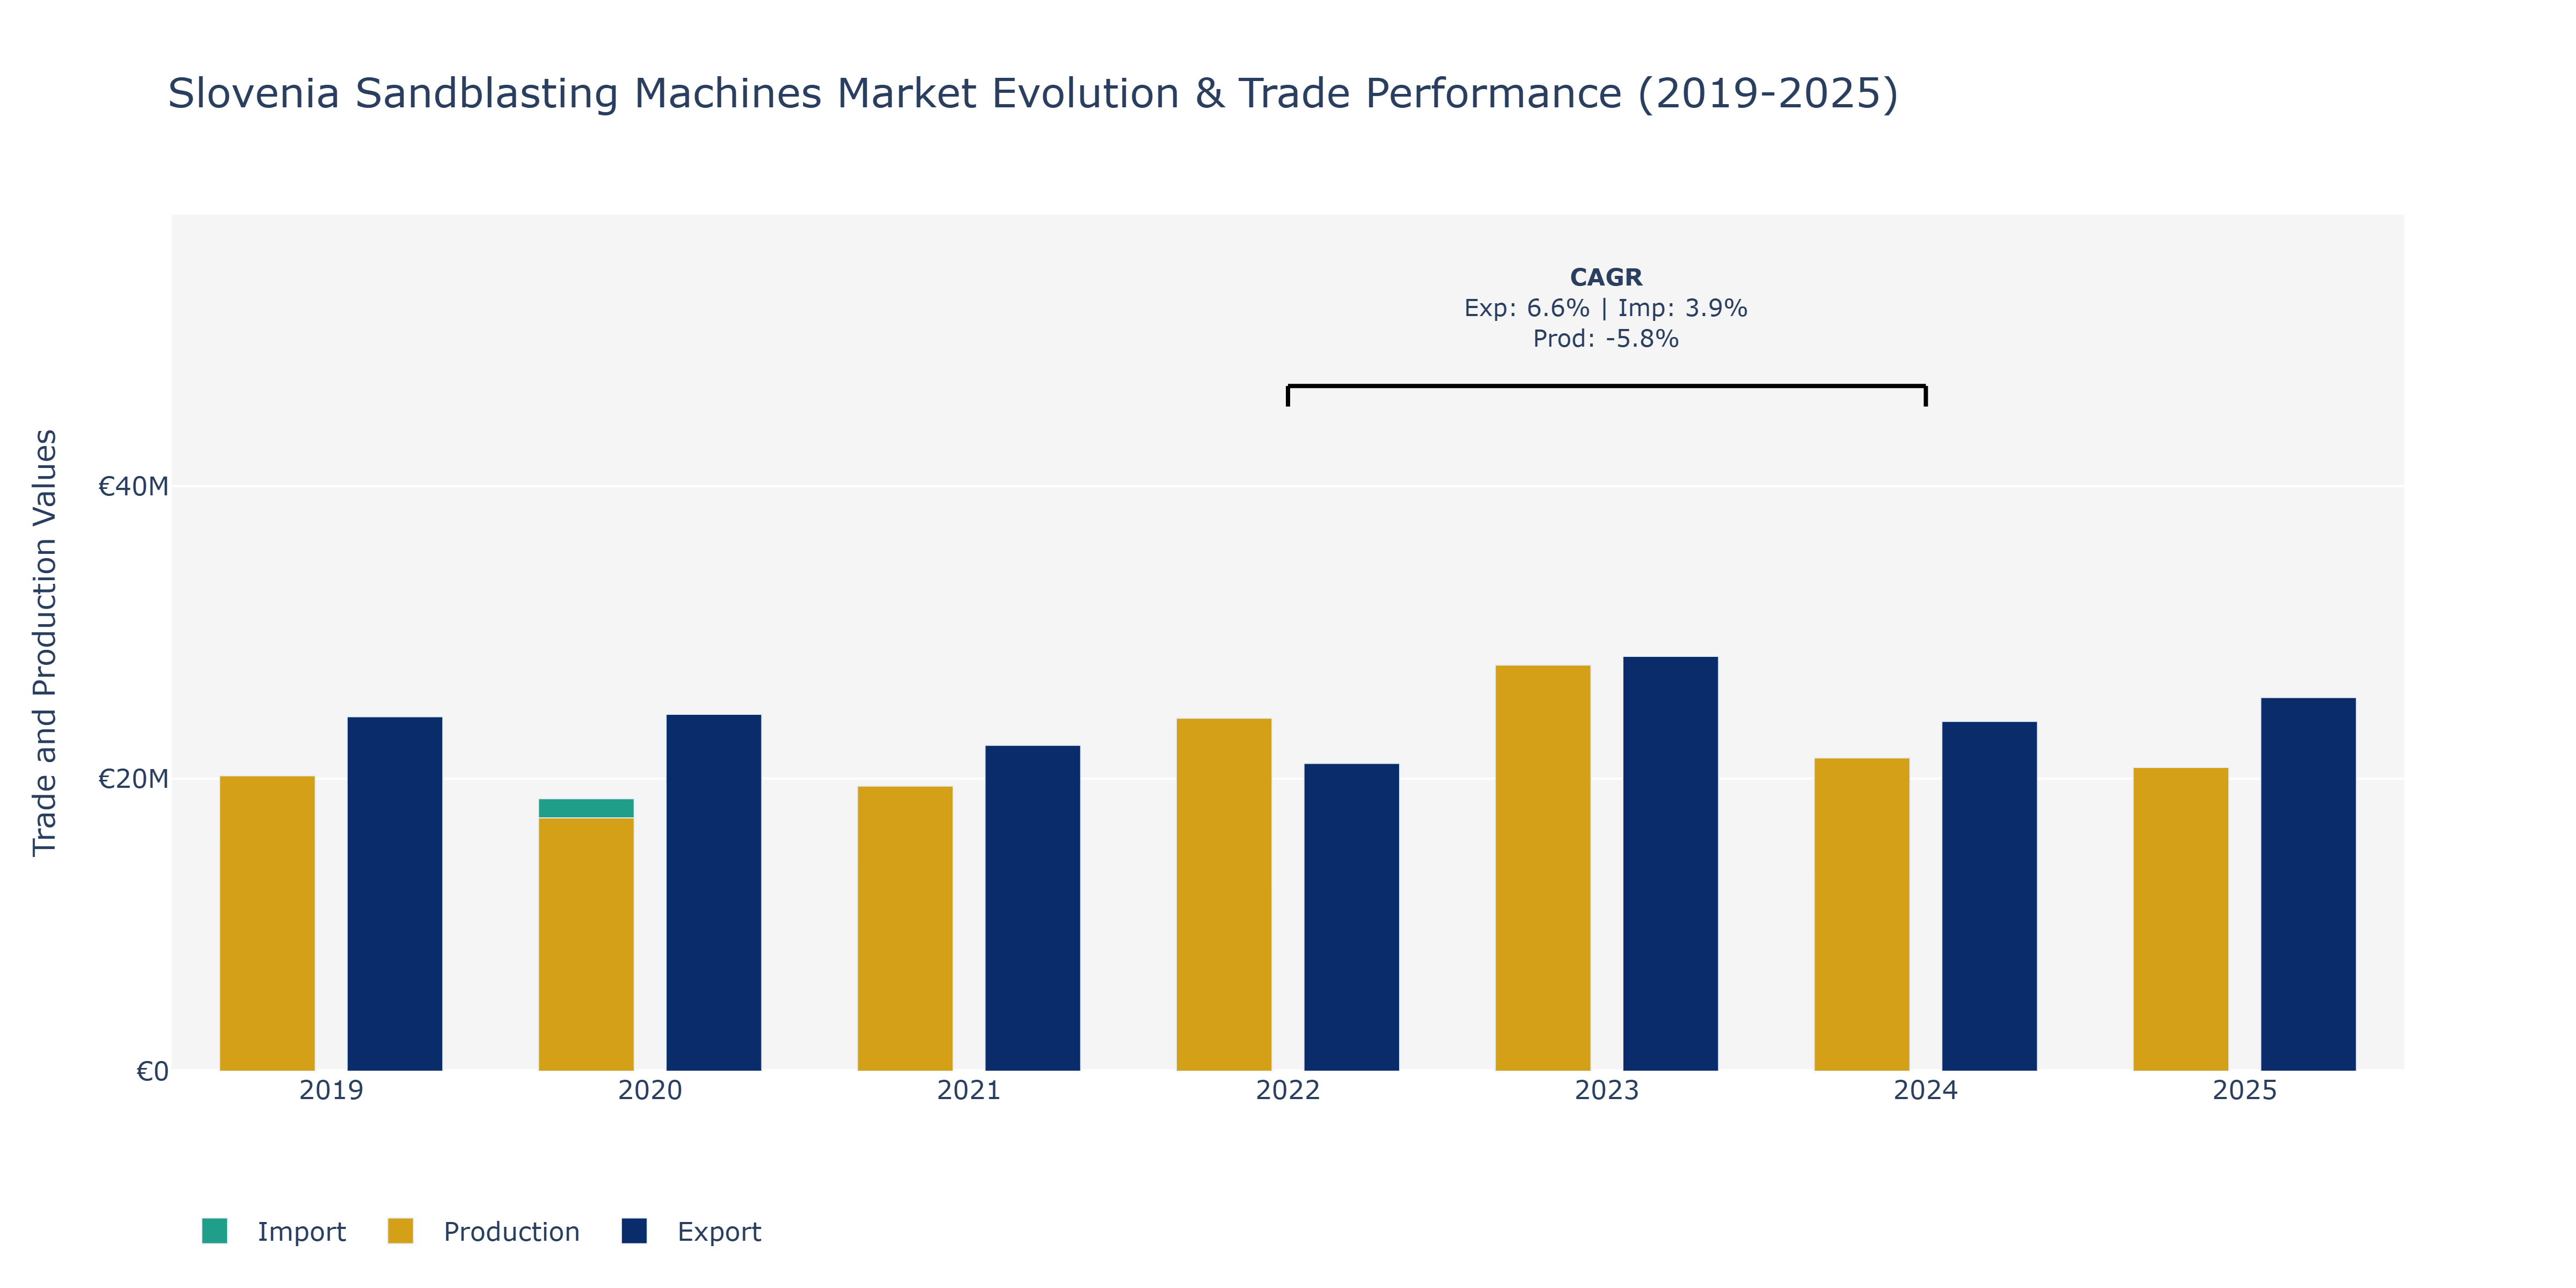
Between 2019 and 2025, Slovenia's Sandblasting Machines Market witnessed fluctuations in exports, imports, and production. In 2023, exports peaked at approximately €28.36 million before declining slightly in 2024 and then stabilizing in 2025 around €25.55 million. Imports followed a similar trajectory, reaching a high of €18.63 million in 2020, dropping in 2021 to about €14.18 million, and then slowly increasing to €13.99 million by 2025. Production, on the other hand, experienced a decline from €24.14 million in 2022 to €21.42 million in 2025, marking a challenging period for local sandblasting machine manufacturers. These fluctuations could be attributed to factors such as global economic uncertainties impacting trade volumes, technological advancements affecting production efficiencies, and evolving market demands driving changes in export and import patterns. To maintain competitiveness, companies in the sector may need to focus on innovation, product diversification, and strategic partnerships to navigate market dynamics successfully.
Key Highlights of the Report:
- Slovenia Sandblasting Machines Market Outlook
- Market Size of Slovenia Sandblasting Machines Market, 2025
- Forecast of Slovenia Sandblasting Machines Market, 2032
- Historical Data and Forecast of Slovenia Sandblasting Machines Revenues & Volume for the Period 2022-2032F
- Slovenia Sandblasting Machines Market Trend Evolution
- Slovenia Sandblasting Machines Market Drivers and Challenges
- Slovenia Sandblasting Machines Price Trends
- Slovenia Sandblasting Machines Porter`s Five Forces
- Slovenia Sandblasting Machines Industry Life Cycle
- Historical Data and Forecast of Slovenia Sandblasting Machines Market Revenues & Volume By Blasting Type for the Period 2022-2032F
- Historical Data and Forecast of Slovenia Sandblasting Machines Market Revenues & Volume By Dry Blasting for the Period 2022-2032F
- Historical Data and Forecast of Slovenia Sandblasting Machines Market Revenues & Volume By Wet Blasting for the Period 2022-2032F
- Historical Data and Forecast of Slovenia Sandblasting Machines Market Revenues & Volume By Control System for the Period 2022-2032F
- Historical Data and Forecast of Slovenia Sandblasting Machines Market Revenues & Volume By Automatic for the Period 2022-2032F
- Historical Data and Forecast of Slovenia Sandblasting Machines Market Revenues & Volume By Semi-automatic for the Period 2022-2032F
- Historical Data and Forecast of Slovenia Sandblasting Machines Market Revenues & Volume By Manual for the Period 2022-2032F
- Historical Data and Forecast of Slovenia Sandblasting Machines Market Revenues & Volume By Tank Capacity for the Period 2022-2032F
- Historical Data and Forecast of Slovenia Sandblasting Machines Market Revenues & Volume By Less than 1000L for the Period 2022-2032F
- Historical Data and Forecast of Slovenia Sandblasting Machines Market Revenues & Volume By 1000L - 2000L for the Period 2022-2032F
- Historical Data and Forecast of Slovenia Sandblasting Machines Market Revenues & Volume By 2000L - 3000L for the Period 2022-2032F
- Historical Data and Forecast of Slovenia Sandblasting Machines Market Revenues & Volume By More than 3000L for the Period 2022-2032F
- Historical Data and Forecast of Slovenia Sandblasting Machines Market Revenues & Volume By Product for the Period 2022-2032F
- Historical Data and Forecast of Slovenia Sandblasting Machines Market Revenues & Volume By Portable for the Period 2022-2032F
- Historical Data and Forecast of Slovenia Sandblasting Machines Market Revenues & Volume By Stationary for the Period 2022-2032F
- Historical Data and Forecast of Slovenia Sandblasting Machines Market Revenues & Volume By End-user for the Period 2022-2032F
- Historical Data and Forecast of Slovenia Sandblasting Machines Market Revenues & Volume By Automotive for the Period 2022-2032F
- Historical Data and Forecast of Slovenia Sandblasting Machines Market Revenues & Volume By Construction for the Period 2022-2032F
- Historical Data and Forecast of Slovenia Sandblasting Machines Market Revenues & Volume By Marine for the Period 2022-2032F
- Historical Data and Forecast of Slovenia Sandblasting Machines Market Revenues & Volume By Oil & Gas for the Period 2022-2032F
- Historical Data and Forecast of Slovenia Sandblasting Machines Market Revenues & Volume By Petrochemicals for the Period 2022-2032F
- Historical Data and Forecast of Slovenia Sandblasting Machines Market Revenues & Volume By Others for the Period 2022-2032F
- Slovenia Sandblasting Machines Import Export Trade Statistics
- Market Opportunity Assessment By Blasting Type
- Market Opportunity Assessment By Control System
- Market Opportunity Assessment By Tank Capacity
- Market Opportunity Assessment By Product
- Market Opportunity Assessment By End-user
- Slovenia Sandblasting Machines Top Companies Market Share
- Slovenia Sandblasting Machines Competitive Benchmarking By Technical and Operational Parameters
- Slovenia Sandblasting Machines Company Profiles
- Slovenia Sandblasting Machines Key Strategic Recommendations
Frequently Asked Questions About the Market Study (FAQs):
6Wresearch actively monitors the Slovenia Sandblasting Machines Market and publishes its comprehensive annual report, highlighting emerging trends, growth drivers, revenue analysis, and forecast outlook. Our insights help businesses to make data-backed strategic decisions with ongoing market dynamics. Our analysts track relevent industries related to the Slovenia Sandblasting Machines Market, allowing our clients with actionable intelligence and reliable forecasts tailored to emerging regional needs.
Yes, we provide customisation as per your requirements. To learn more, feel free to contact us on sales@6wresearch.com
1 Executive Summary |
2 Introduction |
2.1 Key Highlights of the Report |
2.2 Report Description |
2.3 Market Scope & Segmentation |
2.4 Research Methodology |
2.5 Assumptions |
3 Slovenia Sandblasting Machines Market Overview |
3.1 Slovenia Country Macro Economic Indicators |
3.2 Slovenia Sandblasting Machines Market Revenues & Volume, 2022 & 2032F |
3.3 Slovenia Sandblasting Machines Market - Industry Life Cycle |
3.4 Slovenia Sandblasting Machines Market - Porter's Five Forces |
3.5 Slovenia Sandblasting Machines Market Revenues & Volume Share, By Blasting Type, 2022 & 2032F |
3.6 Slovenia Sandblasting Machines Market Revenues & Volume Share, By Control System, 2022 & 2032F |
3.7 Slovenia Sandblasting Machines Market Revenues & Volume Share, By Tank Capacity, 2022 & 2032F |
3.8 Slovenia Sandblasting Machines Market Revenues & Volume Share, By Product, 2022 & 2032F |
3.9 Slovenia Sandblasting Machines Market Revenues & Volume Share, By End-user, 2022 & 2032F |
4 Slovenia Sandblasting Machines Market Dynamics |
4.1 Impact Analysis |
4.2 Market Drivers |
4.2.1 Growing demand for sandblasting machines in industries such as automotive, construction, and aerospace |
4.2.2 Increasing focus on surface preparation and cleaning in manufacturing processes |
4.2.3 Advancements in technology leading to more efficient and precise sandblasting machines |
4.3 Market Restraints |
4.3.1 High initial investment cost associated with purchasing sandblasting machines |
4.3.2 Environmental concerns related to dust and abrasive materials used in sandblasting processes |
4.3.3 Intense competition in the market leading to pricing pressures for sandblasting machine manufacturers |
5 Slovenia Sandblasting Machines Market Trends |
6 Slovenia Sandblasting Machines Market Segmentations |
6.1 Slovenia Sandblasting Machines Market, By Blasting Type |
6.1.1 Overview and Analysis |
6.1.2 Slovenia Sandblasting Machines Market Revenues & Volume, By Dry Blasting, 2022-2032F |
6.1.3 Slovenia Sandblasting Machines Market Revenues & Volume, By Wet Blasting, 2022-2032F |
6.2 Slovenia Sandblasting Machines Market, By Control System |
6.2.1 Overview and Analysis |
6.2.2 Slovenia Sandblasting Machines Market Revenues & Volume, By Automatic, 2022-2032F |
6.2.3 Slovenia Sandblasting Machines Market Revenues & Volume, By Semi-automatic, 2022-2032F |
6.2.4 Slovenia Sandblasting Machines Market Revenues & Volume, By Manual, 2022-2032F |
6.3 Slovenia Sandblasting Machines Market, By Tank Capacity |
6.3.1 Overview and Analysis |
6.3.2 Slovenia Sandblasting Machines Market Revenues & Volume, By Less than 1000L, 2022-2032F |
6.3.3 Slovenia Sandblasting Machines Market Revenues & Volume, By 1000L - 2000L, 2022-2032F |
6.3.4 Slovenia Sandblasting Machines Market Revenues & Volume, By 2000L - 3000L, 2022-2032F |
6.3.5 Slovenia Sandblasting Machines Market Revenues & Volume, By More than 3000L, 2022-2032F |
6.4 Slovenia Sandblasting Machines Market, By Product |
6.4.1 Overview and Analysis | 6.4.2 Slovenia Sandblasting Machines Market Revenues & Volume, By Portable, 2022-2032F |
6.4.3 Slovenia Sandblasting Machines Market Revenues & Volume, By Stationary, 2022-2032F |
6.5 Slovenia Sandblasting Machines Market, By End-user |
6.5.1 Overview and Analysis |
6.5.2 Slovenia Sandblasting Machines Market Revenues & Volume, By Automotive, 2022-2032F |
6.5.3 Slovenia Sandblasting Machines Market Revenues & Volume, By Construction, 2022-2032F |
6.5.4 Slovenia Sandblasting Machines Market Revenues & Volume, By Marine, 2022-2032F |
6.5.5 Slovenia Sandblasting Machines Market Revenues & Volume, By Oil & Gas, 2022-2032F |
6.5.6 Slovenia Sandblasting Machines Market Revenues & Volume, By Petrochemicals, 2022-2032F |
6.5.7 Slovenia Sandblasting Machines Market Revenues & Volume, By Others, 2022-2032F |
7 Slovenia Sandblasting Machines Market Import-Export Trade Statistics |
7.1 Slovenia Sandblasting Machines Market Export to Major Countries |
7.2 Slovenia Sandblasting Machines Market Imports from Major Countries |
8 Slovenia Sandblasting Machines Market Key Performance Indicators |
8.1 Average utilization rate of sandblasting machines in manufacturing facilities |
8.2 Number of new product developments and technological innovations in the sandblasting machine market |
8.3 Percentage of repeat customers or customer retention rate for sandblasting machine suppliers |
9 Slovenia Sandblasting Machines Market - Opportunity Assessment |
9.1 Slovenia Sandblasting Machines Market Opportunity Assessment, By Blasting Type, 2022 & 2032F |
9.2 Slovenia Sandblasting Machines Market Opportunity Assessment, By Control System, 2022 & 2032F |
9.3 Slovenia Sandblasting Machines Market Opportunity Assessment, By Tank Capacity, 2022 & 2032F |
9.4 Slovenia Sandblasting Machines Market Opportunity Assessment, By Product, 2022 & 2032F |
9.5 Slovenia Sandblasting Machines Market Opportunity Assessment, By End-user, 2022 & 2032F |
10 Slovenia Sandblasting Machines Market - Competitive Landscape |
10.1 Slovenia Sandblasting Machines Market Revenue Share, By Companies, 2025 |
10.2 Slovenia Sandblasting Machines Market Competitive Benchmarking, By Operating and Technical Parameters |
11 Company Profiles |
12 Recommendations | 13 Disclaimer |
Global Go To Market Strategy - 2030
Export potential enables firms to identify high-growth global markets with greater confidence by combining advanced trade intelligence with a structured quantitative methodology. The framework analyzes emerging demand trends and country-level import patterns while integrating macroeconomic and trade datasets such as GDP and population forecasts, bilateral import–export flows, tariff structures, elasticity differentials between developed and developing economies, geographic distance, and import demand projections. Using weighted trade values from 2020–2024 as the base period to project country-to-country export potential for 2030, these inputs are operationalized through calculated drivers such as gravity model parameters, tariff impact factors, and projected GDP per-capita growth. Through an analysis of hidden potentials, demand hotspots, and market conditions that are most favorable to success, this method enables firms to focus on target countries, maximize returns, and global expansion with data, backed by accuracy.
By factoring in the projected importer demand gap that is currently unmet and could be potential opportunity, it identifies the potential for the Exporter (Country) among 190 countries, against the general trade analysis, which identifies the biggest importer or exporter.
To discover high-growth global markets and optimize your business strategy:
Click Here
Pricing
- Single User License$ 1,995
- Department License$ 2,400
- Site License$ 3,120
- Global License$ 3,795

Leadership Perspectives from Industry Events
Search
Thought Leadership and Analyst Meet


Our Clients
6WResearch In News
- India Air Conditioner Market Set for Strong Rebound in 2026 After Weather-Led Correction and GST-Driven Recovery: 6Wresearch
- ADAS in India: How Automatic Emergency Braking, Blind Spot Detection & Driver Monitoring are Transforming Road Safety
- Doha a strategic location for EV manufacturing hub: IPA Qatar
- Demand for luxury TVs surging in the GCC, says Samsung
- Empowering Growth: The Thriving Journey of Bangladesh’s Cable Industry
- Demand for luxury TVs surging in the GCC, says Samsung
Latest Reports
- Nicaragua RPG Gaming Market (2026-2032)
- New Zealand RPG Gaming Market (2026-2032)
- Netherlands RPG Gaming Market (2026-2032)
- Nauru RPG Gaming Market (2026-2032)
- Namibia RPG Gaming Market (2026-2032)
- Mozambique RPG Gaming Market (2026-2032)
- Montenegro RPG Gaming Market (2026-2032)
- Mongolia RPG Gaming Market (2026-2032)
- Monaco RPG Gaming Market (2026-2032)
- Micronesia RPG Gaming Market (2026-2032)
Industry Events and Analyst Meet

EV India Expo 2026

HIMTEX 2026

India Refining Summit 2026

India EV Show 2026

EV tech India Expo 2026
Whitepaper
- Middle East & Africa Commercial Security Market Click here to view more.
- Middle East & Africa Fire Safety Systems & Equipment Market Click here to view more.
- GCC Drone Market Click here to view more.
- Middle East Lighting Fixture Market Click here to view more.
- GCC Physical & Perimeter Security Market Click here to view more.