Slovenia Sodium Nitrate Market (2026-2032) | Revenue, Trends, Size, Value, Forecast, Share, Companies, Outlook, Growth, Industry, Analysis & Segmentation
Market Forecast By Type (Sodium Nitrate Crystal, Industrial Sodium Nitrate), By Application (Glass, Explosives, Agricultural, Chemical Industry, Other) And Competitive Landscape
| Product Code: ETC4820819 | Publication Date: Nov 2023 | Updated Date: Apr 2026 | Product Type: Market Research Report | |
| Publisher: 6Wresearch | Author: Shubham Padhi | No. of Pages: 60 | No. of Figures: 30 | No. of Tables: 5 |
Slovenia Sodium Nitrate Market Size (2020-2030)
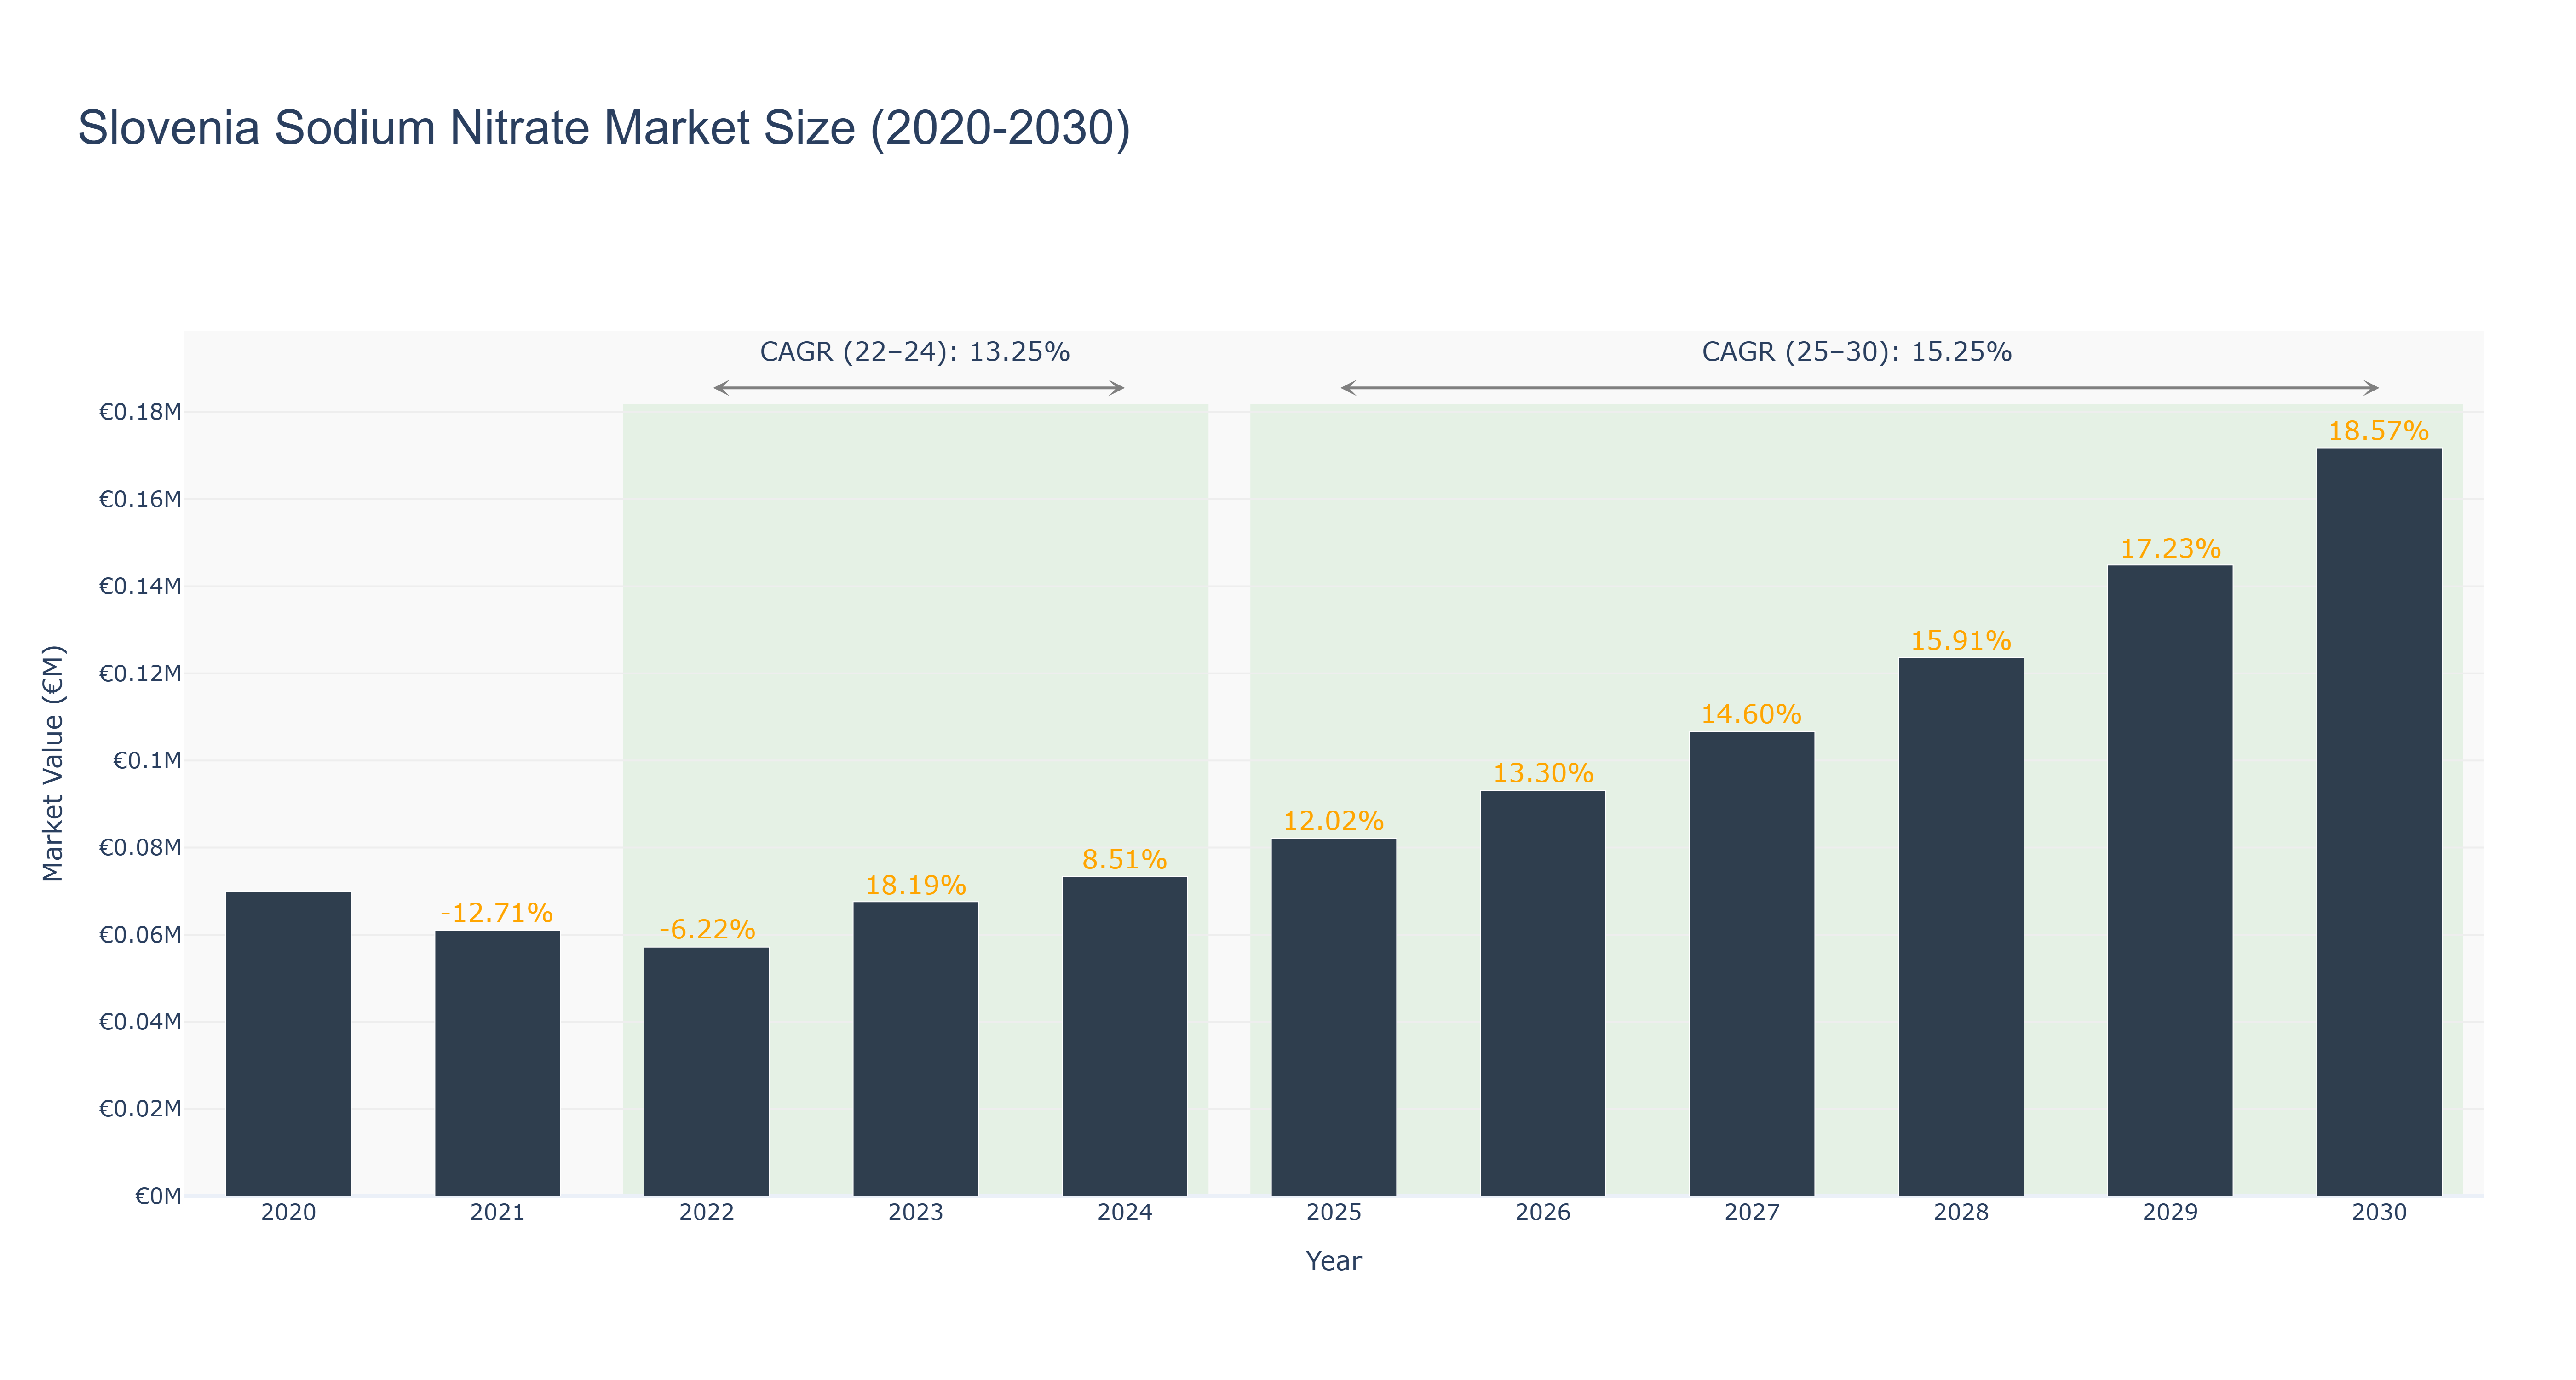
The Slovenia Sodium Nitrate Market exhibited notable fluctuations in its market size over the past few years, achieving a peak of €69.82 thousand in 2020 before declining to €57.16 thousand in 2022, reflecting a compound annual growth rate (CAGR) of -6.22%. However, the market rebounded in 2023, reaching €67.56 thousand, with a growth rate of 18.19% and further increasing to €73.31 thousand in 2024, demonstrating a positive CAGR of 13.25% for the actual data period (2022-2024). Looking ahead, the projected market size is expected to grow significantly, with a forecasted CAGR of 15.25% from 2025 to 2030, culminating in a market size of €171.79 thousand by 2030. This growth will likely be driven by increasing agricultural demand for fertilizers and the rising awareness of sodium nitrate's benefits in various applications, bolstered by potential government initiatives and investments in sustainable agricultural practices.
Slovenia Sodium Nitrate Market: Production & Trade Performance (2019-2025)
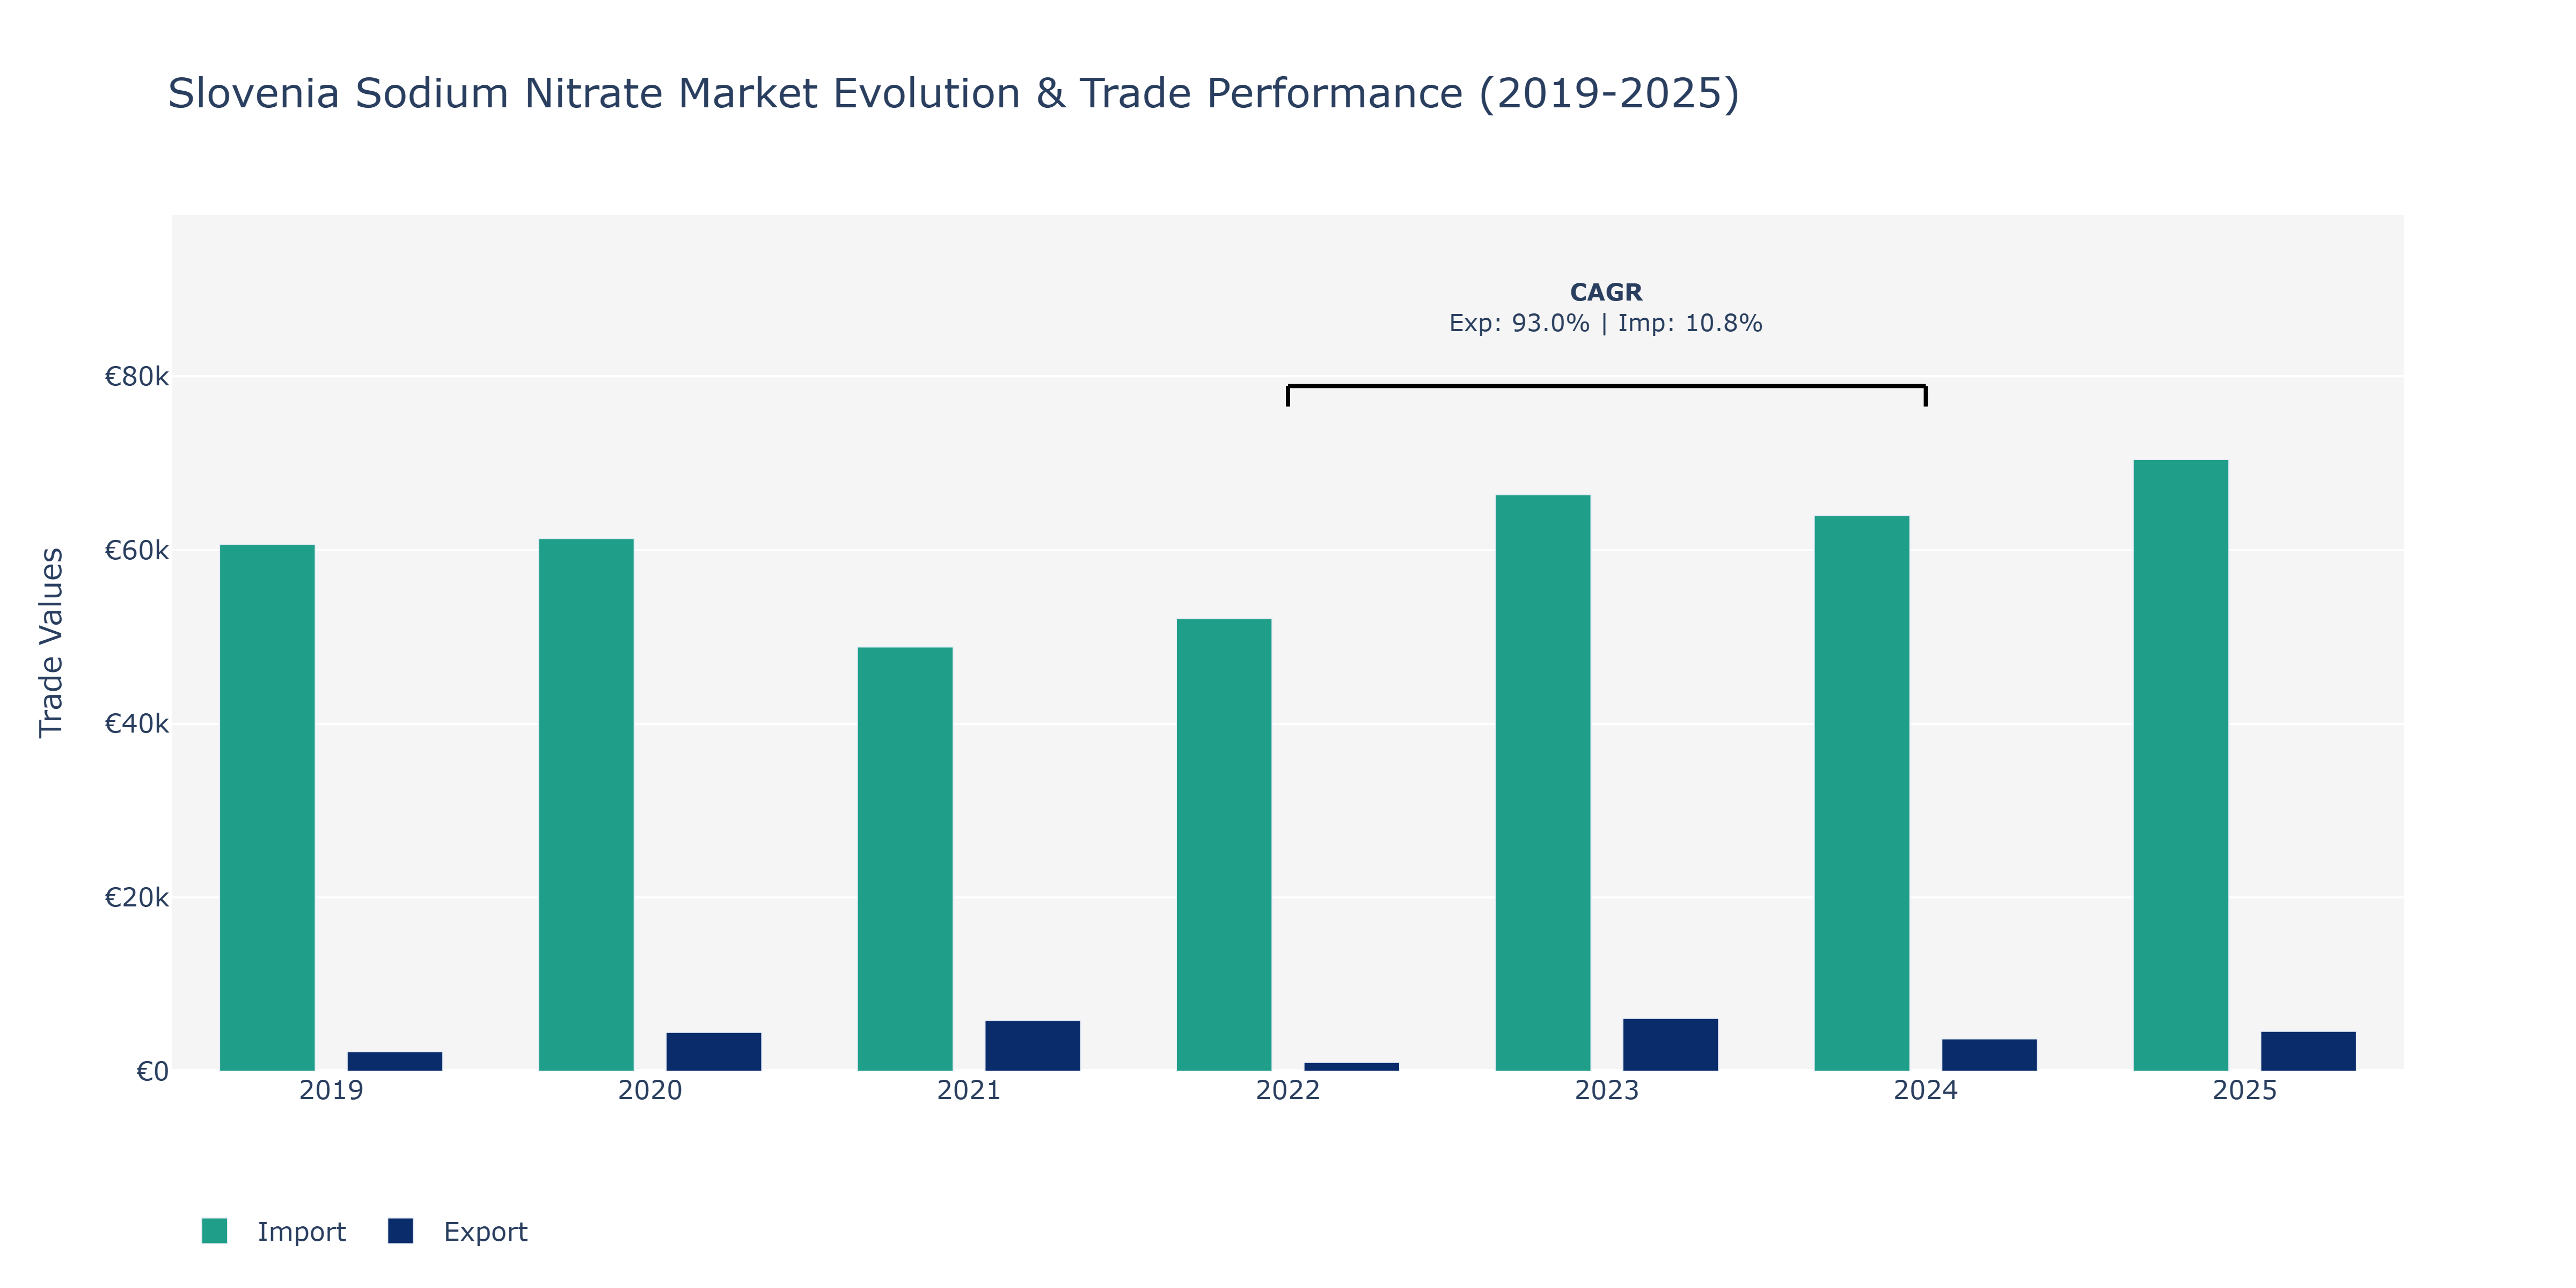
Between 2019 and 2025, Slovenia's Sodium Nitrate Market experienced varied trends in exports and imports. In 2019, exports stood at €2.25 thousand and steadily rose to €5.84 thousand in 2021 before a slight dip in 2022 to €999. However, a sharp increase followed in 2023 to €6.07 thousand, showcasing robust growth, although there was a decline in 2024 to €3.72 thousand. In 2025, exports rebounded to approximately €4.59 thousand. On the other hand, imports saw consistent growth from €60.64 thousand in 2019 to a peak of €70.44 thousand in 2025. The fluctuations in exports can be attributed to global demand shifts due to evolving agricultural practices and industrial applications of sodium nitrate. The steady rise in imports suggests Slovenia's reliance on foreign sources for sodium nitrate, potentially due to domestic production limitations or cost-effectiveness strategies. These trends highlight the market's sensitivity to both domestic and international factors, emphasizing the need for strategic planning and market diversification strategies in the sodium nitrate industry.
Key Highlights of the Report:
- Slovenia Sodium Nitrate Market Outlook
- Market Size of Slovenia Sodium Nitrate Market, 2025
- Forecast of Slovenia Sodium Nitrate Market, 2032
- Historical Data and Forecast of Slovenia Sodium Nitrate Revenues & Volume for the Period 2022-2032F
- Slovenia Sodium Nitrate Market Trend Evolution
- Slovenia Sodium Nitrate Market Drivers and Challenges
- Slovenia Sodium Nitrate Price Trends
- Slovenia Sodium Nitrate Porter`s Five Forces
- Slovenia Sodium Nitrate Industry Life Cycle
- Historical Data and Forecast of Slovenia Sodium Nitrate Market Revenues & Volume By Type for the Period 2022-2032F
- Historical Data and Forecast of Slovenia Sodium Nitrate Market Revenues & Volume By Sodium Nitrate Crystal for the Period 2022-2032F
- Historical Data and Forecast of Slovenia Sodium Nitrate Market Revenues & Volume By Industrial Sodium Nitrate for the Period 2022-2032F
- Historical Data and Forecast of Slovenia Sodium Nitrate Market Revenues & Volume By Application for the Period 2022-2032F
- Historical Data and Forecast of Slovenia Sodium Nitrate Market Revenues & Volume By Glass for the Period 2022-2032F
- Historical Data and Forecast of Slovenia Sodium Nitrate Market Revenues & Volume By Explosives for the Period 2022-2032F
- Historical Data and Forecast of Slovenia Sodium Nitrate Market Revenues & Volume By Agricultural for the Period 2022-2032F
- Historical Data and Forecast of Slovenia Sodium Nitrate Market Revenues & Volume By Chemical Industry for the Period 2022-2032F
- Historical Data and Forecast of Slovenia Sodium Nitrate Market Revenues & Volume By Other for the Period 2022-2032F
- Slovenia Sodium Nitrate Import Export Trade Statistics
- Market Opportunity Assessment By Type
- Market Opportunity Assessment By Application
- Slovenia Sodium Nitrate Top Companies Market Share
- Slovenia Sodium Nitrate Competitive Benchmarking By Technical and Operational Parameters
- Slovenia Sodium Nitrate Company Profiles
- Slovenia Sodium Nitrate Key Strategic Recommendations
Frequently Asked Questions About the Market Study (FAQs):
6Wresearch actively monitors the Slovenia Sodium Nitrate Market and publishes its comprehensive annual report, highlighting emerging trends, growth drivers, revenue analysis, and forecast outlook. Our insights help businesses to make data-backed strategic decisions with ongoing market dynamics. Our analysts track relevent industries related to the Slovenia Sodium Nitrate Market, allowing our clients with actionable intelligence and reliable forecasts tailored to emerging regional needs.
Yes, we provide customisation as per your requirements. To learn more, feel free to contact us on sales@6wresearch.com
1 Executive Summary |
2 Introduction |
2.1 Key Highlights of the Report |
2.2 Report Description |
2.3 Market Scope & Segmentation |
2.4 Research Methodology |
2.5 Assumptions |
3 Slovenia Sodium Nitrate Market Overview |
3.1 Slovenia Country Macro Economic Indicators |
3.2 Slovenia Sodium Nitrate Market Revenues & Volume, 2022 & 2032F |
3.3 Slovenia Sodium Nitrate Market - Industry Life Cycle |
3.4 Slovenia Sodium Nitrate Market - Porter's Five Forces |
3.5 Slovenia Sodium Nitrate Market Revenues & Volume Share, By Type, 2022 & 2032F |
3.6 Slovenia Sodium Nitrate Market Revenues & Volume Share, By Application, 2022 & 2032F |
4 Slovenia Sodium Nitrate Market Dynamics |
4.1 Impact Analysis |
4.2 Market Drivers |
4.2.1 Growing demand for sodium nitrate in the agricultural sector for use as a fertilizer |
4.2.2 Increasing adoption of sodium nitrate in the food industry for preservation purposes |
4.2.3 Rising awareness about the benefits of sodium nitrate in various industrial applications |
4.3 Market Restraints |
4.3.1 Stringent regulations and policies regarding the usage of sodium nitrate in certain industries |
4.3.2 Fluctuating prices of raw materials impacting the production cost of sodium nitrate |
4.3.3 Competition from alternative products affecting the market growth |
5 Slovenia Sodium Nitrate Market Trends |
6 Slovenia Sodium Nitrate Market Segmentations |
6.1 Slovenia Sodium Nitrate Market, By Type |
6.1.1 Overview and Analysis |
6.1.2 Slovenia Sodium Nitrate Market Revenues & Volume, By Sodium Nitrate Crystal, 2022-2032F |
6.1.3 Slovenia Sodium Nitrate Market Revenues & Volume, By Industrial Sodium Nitrate, 2022-2032F |
6.2 Slovenia Sodium Nitrate Market, By Application |
6.2.1 Overview and Analysis |
6.2.2 Slovenia Sodium Nitrate Market Revenues & Volume, By Glass, 2022-2032F |
6.2.3 Slovenia Sodium Nitrate Market Revenues & Volume, By Explosives, 2022-2032F |
6.2.4 Slovenia Sodium Nitrate Market Revenues & Volume, By Agricultural, 2022-2032F |
6.2.5 Slovenia Sodium Nitrate Market Revenues & Volume, By Chemical Industry, 2022-2032F |
6.2.6 Slovenia Sodium Nitrate Market Revenues & Volume, By Other, 2022-2032F |
7 Slovenia Sodium Nitrate Market Import-Export Trade Statistics |
7.1 Slovenia Sodium Nitrate Market Export to Major Countries |
7.2 Slovenia Sodium Nitrate Market Imports from Major Countries |
8 Slovenia Sodium Nitrate Market Key Performance Indicators |
8.1 Number of new product developments or innovations in the sodium nitrate market |
8.2 Adoption rate of sodium nitrate in different industries over time |
8.3 Level of investment in research and development for sodium nitrate substitutes |
8.4 Environmental impact assessments related to sodium nitrate production and usage |
8.5 Rate of technological advancements in sodium nitrate production processes |
9 Slovenia Sodium Nitrate Market - Opportunity Assessment |
9.1 Slovenia Sodium Nitrate Market Opportunity Assessment, By Type, 2022 & 2032F |
9.2 Slovenia Sodium Nitrate Market Opportunity Assessment, By Application, 2022 & 2032F |
10 Slovenia Sodium Nitrate Market - Competitive Landscape |
10.1 Slovenia Sodium Nitrate Market Revenue Share, By Companies, 2025 |
10.2 Slovenia Sodium Nitrate Market Competitive Benchmarking, By Operating and Technical Parameters |
11 Company Profiles |
12 Recommendations | 13 Disclaimer |
Export potential assessment - trade Analytics for 2030
Export potential enables firms to identify high-growth global markets with greater confidence by combining advanced trade intelligence with a structured quantitative methodology. The framework analyzes emerging demand trends and country-level import patterns while integrating macroeconomic and trade datasets such as GDP and population forecasts, bilateral import–export flows, tariff structures, elasticity differentials between developed and developing economies, geographic distance, and import demand projections. Using weighted trade values from 2020–2024 as the base period to project country-to-country export potential for 2030, these inputs are operationalized through calculated drivers such as gravity model parameters, tariff impact factors, and projected GDP per-capita growth. Through an analysis of hidden potentials, demand hotspots, and market conditions that are most favorable to success, this method enables firms to focus on target countries, maximize returns, and global expansion with data, backed by accuracy.
By factoring in the projected importer demand gap that is currently unmet and could be potential opportunity, it identifies the potential for the Exporter (Country) among 190 countries, against the general trade analysis, which identifies the biggest importer or exporter.
To discover high-growth global markets and optimize your business strategy:
Click Here
Pricing
- Single User License$ 1,995
- Department License$ 2,400
- Site License$ 3,120
- Global License$ 3,795

Thought Leadership
Search
Thought Leadership and Analyst Meet


Our Clients
Latest Reports
- New Zealand Aseptic Manufacturing Market (2026-2032)
- Netherlands Aseptic Manufacturing Market (2026-2032)
- Nauru Aseptic Manufacturing Market (2026-2032)
- Namibia Aseptic Manufacturing Market (2026-2032)
- Mozambique Aseptic Manufacturing Market (2026-2032)
- Montenegro Aseptic Manufacturing Market (2026-2032)
- Mongolia Aseptic Manufacturing Market (2026-2032)
- Monaco Aseptic Manufacturing Market (2026-2032)
- Micronesia Aseptic Manufacturing Market (2026-2032)
- Mauritius Aseptic Manufacturing Market (2026-2032)
Industry Events and Analyst Meet

HIMTEX 2026

India Refining Summit 2026

India EV Show 2026

EV tech India Expo 2026

Auto Tech Asia 2026
Whitepaper
- Middle East & Africa Commercial Security Market Click here to view more.
- Middle East & Africa Fire Safety Systems & Equipment Market Click here to view more.
- GCC Drone Market Click here to view more.
- Middle East Lighting Fixture Market Click here to view more.
- GCC Physical & Perimeter Security Market Click here to view more.
6WResearch In News
- Doha a strategic location for EV manufacturing hub: IPA Qatar
- Demand for luxury TVs surging in the GCC, says Samsung
- Empowering Growth: The Thriving Journey of Bangladesh’s Cable Industry
- Demand for luxury TVs surging in the GCC, says Samsung
- Video call with a traditional healer? Once unthinkable, it’s now common in South Africa
- Intelligent Buildings To Smooth GCC’s Path To Net Zero