South Africa EMV Smart Cards Market (2026-2032) | Industry, Revenue, Trends, Analysis, Forecast, Growth, Share, Value, Size & Companies
Market Forecast By Contact Form (Contactless Form), By Fuel Card (Retail Store Card, Meal Voucher Card, Others), By BFSI (Healthcare, Retail, IT & Telecommunication, Travel & Hospitality, Transportation & Logistics, Media & Entertainment, Government, Others), By Wholesaler (Retail Brokers, Others) And Competitive Landscape
| Product Code: ETC262788 | Publication Date: Aug 2022 | Updated Date: Mar 2026 | Product Type: Market Research Report | |
| Publisher: 6Wresearch | Author: Ravi Bhandari | No. of Pages: 75 | No. of Figures: 35 | No. of Tables: 20 |
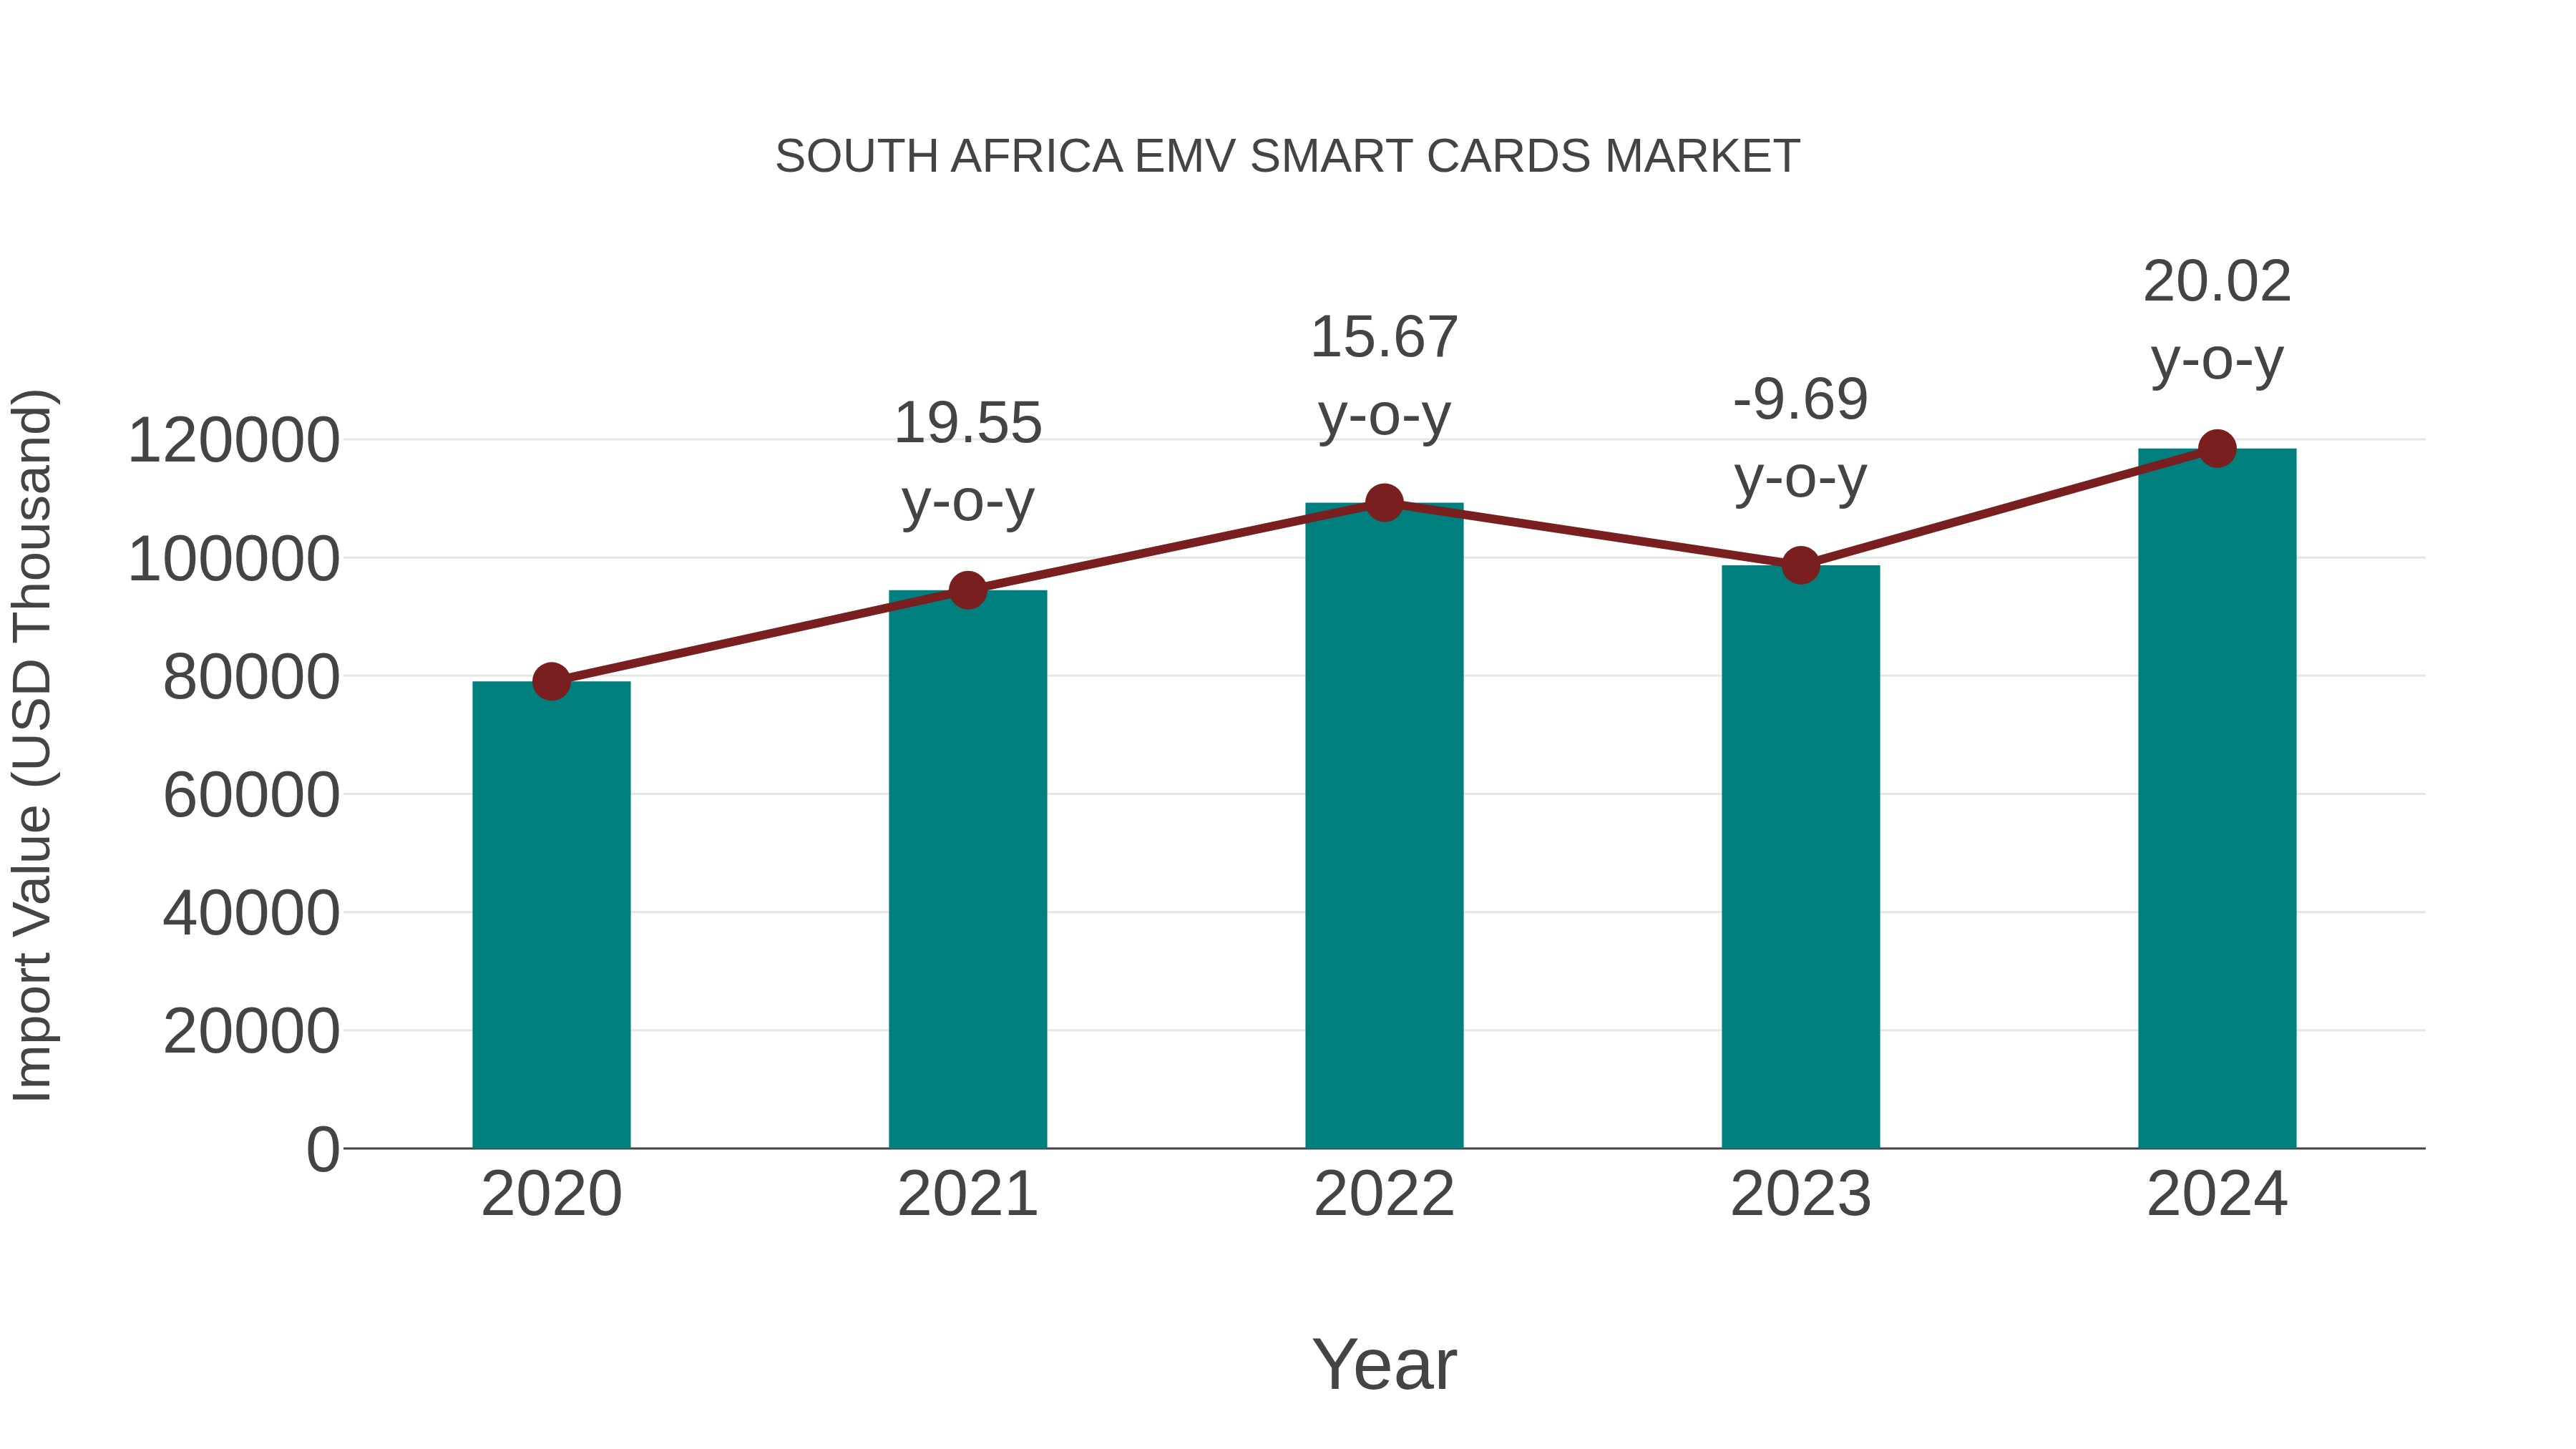
South Africa Emv Smart Cards Market: Import Trend Analysis
In the South Africa EMV smart cards market, the import trend exhibited significant growth from 2023 to 2024, with a growth rate of 20.02%. The compound annual growth rate (CAGR) for the period 2020-2024 stood at 10.65%. This surge in imports could be attributed to increased demand for secure payment solutions and advancements in technology, driving market stability and expansion.
South Africa EMV Smart Cards Market Growth Rate
According to 6Wresearch internal database and industry insights, the South Africa EMV Smart Cards Market is projected to grow at a compound annual growth rate (CAGR) of 8.5% during the forecast period from 2026 to 2032.
Topics Covered in the South Africa EMV Smart Cards Market Report
The South Africa EMV Smart Cards Market report thoroughly covers the market by contact form, fuel card, BFSI sector, and wholesaler providing an unbiased and detailed analysis of ongoing market trends, opportunities, challenges, and market drivers, helping stakeholders align their strategies with current and future market dynamics.
South Africa EMV Smart Cards Market Highlights
| Report Name | South Africa EMV Smart Cards Market |
| Forecast period | 2026-2032 |
| CAGR | 8.5% |
| Growing Sector | EMV Smart Cards |
South Africa EMV Smart Cards Market Synopsis
There are numerous factors which have contributed to the South Africa EMV Smart Card Market rapid growth. First and foremost, the demand for safe, convenient payment methods is skyrocketing in retail, banking, and fuel. The second driver of growth for EMV smart cards is the increased adoption of contactless and mobile payments. EMV chip technology (the future of significant advancements in card security) has played a key role in the rise of contactless and mobile payment options. Third, the government's commitment to creating a digital payments ecosystem (such as through various projects) has facilitated the use of EMV smart cards.
Evaluation of Growth Drivers in the South Africa EMV Smart Cards Market
Below mentioned are some prominent drivers and their impact on the market dynamics:
| Drivers | Primary Segments Affected | Why It Matters (Evidence) |
| Increasing Demand for Cashless Payments | Contactless Form, BFSI, Retail | Cashless transactions are becoming more common, enhancing the demand for EMV smart cards with secure payment functionalities. |
| Government Initiatives Promoting Digital Payments | BFSI, Retail, Transportation | The government digitalization initiative drives organizations to implement EMV smart card technology which improves their capacity to make secure and uninterrupted payments. |
| Rising Demand for Fuel Cards and Meal Vouchers | Fuel Card, Retail, BFSI | The growing use of fuel cards and meal vouchers in businesses is driving the market for EMV smart cards in these sectors. |
| Growth in E-Commerce and Mobile Payments | Contactless Form, BFSI, Retail | E-commerce expansion and advanced mobile payments make the need for secure EMV smart cards in digital payments. |
| Technological Advancements in Card Security | Contactless Form, BFSI, Retail | The implementation of EMV smart cards as a secure payment options the standard payment methods is increasing due to enhanced security features which include chip technology are driving their adoption. |
The South Africa EMV Smart Cards Market Size is projected to grow at a CAGR of 8.5% from 2026 to 2032. With an increasing demand for secure and convenient cashless payment options there is continued growth of the South Africa EMV Smart Cards Market. This expansion of the market is due to several factors, including government initiatives to support the switch to a digital payment system, advances in technological development of smart card security, increased adoption by retail, banking, financial services, and fuel card sectors of EMV standards resulting in new opportunities for growth, and the growing emphasis on secure payment options will also contribute to the acceleration of growth of EMV smart card usage in South Africa resulting in further development of the market.
Evaluation of Restraints in the South Africa EMV Smart Cards Market
Below mentioned are some major restraints and their influence on the market dynamics:
| Restraints | Primary Segments Affected | What This Means (Evidence) |
| High Implementation Costs | Contactless Form, BFSI | The initial costs of EMV smart card implementation can be high, especially for smaller businesses, limiting adoption. |
| Limited Consumer Awareness | Contactless Form, Fuel Cards | Many consumers are still unaware of the benefits of using EMV smart cards, hindering wider adoption. |
| Security Concerns | Contactless Form, BFSI | Concerns over potential data breaches and fraud may slow down the growth of the market. |
| Regulatory Challenges | Contactless Form, BFSI, Retail | Compliance with evolving regulations regarding payment card security could slow market entry for new players. |
| Infrastructure Limitations | Contactless Form, Fuel Cards | Insufficient infrastructure in rural areas for EMV smart card acceptance may restrict market expansion. |
South Africa EMV Smart Cards Market Challenges
There are several challenges which exist in the South Africa EMV Smart Cards Industry which involve the high cost of implementation in the EMV smart card framework, especially for smaller businesses and emerging sectors. Security vulnerability of data through the use of EMV cards and limited awareness of the benefits of using EMV cards further limits growth. Additionally, businesses are required to adhere to changing government regulations which will also result in delays and potential additional costs to market participants. This will lead to more barriers to developing the smart card market.
South Africa EMV Smart Cards Market Trends
Here are some major trends changing the South Africa EMV Smart Cards Market Growth dynamics:
- Shift Toward Contactless Payments: People prefer contactless payments as they offer fast transactions, simple operations and secure payment methods. The rising use of smartphones and wearable devices for payments is driving this trend.
- Government Support for Digital Payment Ecosystem: The South African government is introducing policies to encourage cashless transactions and digital payment methods. This support is expected to accelerate the adoption of EMV smart cards across various sectors.
- Fuel and Meal Voucher Cards Demand: The demand for fuel cards and meal voucher cards is rising among companies offering benefits to employees. The rise in demand is fueling the need for secure, efficient EMV cards designed for these particular applications.
Investment Opportunities in the South Africa EMV Smart Cards Market
The South Africa EMV Smart Cards Market presents several investment opportunities, including:
- Development of Secure Payment Technologies: Research and development funding will enable businesses to develop better security technologies for EMV smart cards which will give them a competitive advantage.
- Expansion in Fuel and Meal Voucher Card Segment: The corporate sector needs fuel and meal voucher cards which creates an opportunity for EMV smart card providers to extend their services in this market.
- Government Collaboration for Digital Payment Initiatives: Government partnerships help businesses develop digital payment systems while they work to increase secure EMV card usage in their projects.
Top 5 Leading Players in the South Africa EMV Smart Cards Market
Below is the list of prominent companies leading the South Africa EMV Smart Cards Market Share:
1. Thales (formerly Gemalto)
| Company Name | Thales (formerly Gemalto) |
|---|---|
| Established Year | 2000 (Gemalto formation); 2019 (Thales acquisition) |
| Headquarters | Meudon, France (Regional office: Johannesburg, South Africa) |
| Official Website | Click Here |
Thales is a dominant force in the South African market, providing a comprehensive range of EMV-compliant payment cards to major financial institutions. Their offerings include advanced dual-interface (contactless) cards, biometric payment cards, and eco-friendly solutions made from recycled PVC.
2. IDEMIA (formerly Oberthur Technologies)
| Company Name | IDEMIA (formerly Oberthur Technologies) |
|---|---|
| Established Year | 2017 (Merger of OT and Morpho) |
| Headquarters | Courbevoie, France (Regional office: Johannesburg, South Africa) |
| Official Website | Click Here |
IDEMIA is a leading provider of secure identity and payment solutions in South Africa. They specialize in high-security EMV chip technology for debit and credit cards used by the nation's top banks.
3. Giesecke+Devrient (G+D)
| Company Name | Giesecke+Devrient (G+D) |
|---|---|
| Established Year | 1852 (Global); Long-term presence in South Africa |
| Headquarters | Munich, Germany (Regional office: Johannesburg, South Africa) |
| Official Website | Click Here |
G+D is a pioneer in smart card technology and a major supplier to the South African banking sector. They offer the CONVEGO® suite of products, which includes highly customizable EMV cards and digital card issuance services. G+D is particularly noted for its focus on sustainability, recently pledging to eliminate virgin plastic from its payment card products by 2030, a move that aligns with the ESG goals of many South African corporate clients.
4. Net1 UEPS Technologies (Lesaka Technologies)
| Company Name | Net1 UEPS Technologies (Lesaka Technologies) |
|---|---|
| Established Year | 1989 |
| Headquarters | Johannesburg, South Africa |
| Official Website | - |
Net1 (now operating as Lesaka Technologies) developed the Universal Electronic Payment System (UEPS), a smart card-based technology designed specifically for the unbanked and underbanked populations.
5. Card Technology Services (CTS)
| Company Name | Card Technology Services (CTS) |
|---|---|
| Established Year | 1990s |
| Headquarters | Johannesburg, South Africa |
| Official Website | Click Here |
CTS is a prominent local manufacturer and distributor of smart cards and RFID technology in South Africa. They specialize in the printing, assembly, and personalization of secure cards for various sectors, including transit, access control, and loyalty programs.
Government Regulations Introduced in the South Africa EMV Smart Cards Market
According to South African government data, the South African Reserve Bank (SARB) and the Payment Association of South Africa (PASA) have implemented regulations to ensure the safety and security of payment systems. All payment cards must adhere to EMV standards as required by regulations, ensuring improved protection against fraudulent activities. The government programs are working to promote digital and contactless payment methods as a way to increase nationwide adoption of secure payment systems.
Future Insights of the South Africa EMV Smart Cards Market
There is a favourable future for the South Africa EMV Smart Card Industry due to advancements in Chip Security Technology, government policies promoting electronic payments, and increased consumer demand for non-Cash Payment Solutions. The market will continue to experience growth due to increased demand for Contactless Payments and acceptance of Fuel and Meal Voucher cards. The market will have steady development over the next several years due to continued improvement in Technology along with continuing development of new regulations.
Market Segmentation Analysis
The report offers a comprehensive study of the following market segments and their leading categories:
By Contact Form - Contactless Form to Dominate the Market
According to Ritika Kalra, Senior Research Analyst, 6Wresearch, Contactless form cards are expected to dominate the South Africa EMV Smart Cards Market due to their convenience, speed, and increased adoption in retail and transportation sectors.
By Fuel Card - Retail Store Card to Dominate the Market
The fuel card market will see retail store cards become the leading solution since businesses increasingly use these cards to provide employee benefits and manage their vehicle fleets which creates a need for secure EMV cards that operate efficiently.
By BFSI – Healthcare to Dominate the Market
The BFSI segment shows Healthcare as its leading sector as hospitals now use EMV smart cards to handle medical reimbursement payments and to identify patients and execute secure financial transactions. Healthcare systems have begun to use EMV technology in their operations to improve patient safety while making their payment systems more efficient.
By Wholesaler - Retail Brokers to Dominate the Market
In the Wholesaler category, Retail Brokers hold the dominant position. They play a crucial role in distributing EMV smart cards to end-users, especially in large retail chains, as they ensure a wide reach and availability of cards to the general public. Retail brokers act as intermediaries to meet the increasing demand for secure card payments.
Key Attractiveness of the Report
- 10 Years of Market Numbers
- Historical Data Starting from 2022 to 2025
- Base Year: 2025
- Forecast Data until 2032
- Key Performance Indicators Impacting the Market
- Major Upcoming Developments and Projects
Key Highlights of the Report:
- South Africa EMV Smart Cards Market Outlook
- Market Size of South Africa EMV Smart Cards Market, 2025
- Forecast of South Africa EMV Smart Cards Market, 2032
- Historical Data and Forecast of South Africa EMV Smart Cards Revenues & Volume for the Period 2022-2032F
- South Africa EMV Smart Cards Market Trend Evolution
- South Africa EMV Smart Cards Market Drivers and Challenges
- South Africa EMV Smart Cards Price Trends
- South Africa EMV Smart Cards Porter's Five Forces
- South Africa EMV Smart Cards Industry Life Cycle
- Historical Data and Forecast of South Africa EMV Smart Cards Market Revenues & Volume By Contact Form for the Period 2022-2032F
- Historical Data and Forecast of South Africa EMV Smart Cards Market Revenues & Volume By Contactless Form for the Period 2022-2032F
- Historical Data and Forecast of South Africa EMV Smart Cards Market Revenues & Volume By Fuel Card for the Period 2022-2032F
- Historical Data and Forecast of South Africa EMV Smart Cards Market Revenues & Volume By Retail Store Card for the Period 2022-2032F
- Historical Data and Forecast of South Africa EMV Smart Cards Market Revenues & Volume By Meal Voucher Card for the Period 2022-2032F
- Historical Data and Forecast of South Africa EMV Smart Cards Market Revenues & Volume By Others for the Period 2022-2032F
- Historical Data and Forecast of South Africa EMV Smart Cards Market Revenues & Volume By BFSI for the Period 2022-2032F
- Historical Data and Forecast of South Africa EMV Smart Cards Market Revenues & Volume By Healthcare for the Period 2022-2032F
- Historical Data and Forecast of South Africa EMV Smart Cards Market Revenues & Volume By Retail for the Period 2022-2032F
- Historical Data and Forecast of South Africa EMV Smart Cards Market Revenues & Volume By IT & Telecommunication for the Period 2022-2032F
- Historical Data and Forecast of South Africa EMV Smart Cards Market Revenues & Volume By Travel & Hospitality for the Period 2022-2032F
- Historical Data and Forecast of South Africa EMV Smart Cards Market Revenues & Volume By Transportation & Logistics for the Period 2022-2032F
- Historical Data and Forecast of South Africa EMV Smart Cards Market Revenues & Volume By Media & Entertainment for the Period 2022-2032F
- Historical Data and Forecast of South Africa EMV Smart Cards Market Revenues & Volume By Government for the Period 2022-2032F
- Historical Data and Forecast of South Africa EMV Smart Cards Market Revenues & Volume By Others for the Period 2022-2032F
- Historical Data and Forecast of South Africa EMV Smart Cards Market Revenues & Volume By Wholesaler for the Period 2022-2032F
- Historical Data and Forecast of South Africa EMV Smart Cards Market Revenues & Volume By Retail Brokers for the Period 2022-2032F
- Historical Data and Forecast of South Africa EMV Smart Cards Market Revenues & Volume By Others for the Period 2022-2032F
- South Africa EMV Smart Cards Import Export Trade Statistics
- Market Opportunity Assessment By Contact Form
- Market Opportunity Assessment By Fuel Card
- Market Opportunity Assessment By BFSI
- Market Opportunity Assessment By Wholesaler
- South Africa EMV Smart Cards Top Companies Market Share
- South Africa EMV Smart Cards Competitive Benchmarking By Technical and Operational Parameters
- South Africa EMV Smart Cards Company Profiles
- South Africa EMV Smart Cards Key Strategic Recommendations
Market Covered
The report offers a comprehensive study of the subsequent market segments:
By Contact Form
- Contactless Form
By Fuel Card
- Retail Store Card
- Meal Voucher Card
- Others
By BFSI
- Healthcare
- Retail
- IT & Telecommunication
- Travel & Hospitality
- Transportation & Logistics
- Media & Entertainment
- Government
- Others
By Wholesaler
- Retail Brokers
- Others
South Africa EMV Smart Cards Market (2026-2032): FAQs
The South Africa EMV Smart Cards Market is projected to grow at a CAGR of 8.5% between 2026-2032.
Contactless form cards are expected to dominate due to their convenience and fast transaction capabilities.
Investment opportunities include technological advancements in card security, expansion in fuel and meal voucher card segments, and government collaboration for digital payments.
Government initiatives promoting digital payments and the implementation of EMV standards by the South African Reserve Bank and PASA are encouraging the adoption of smart cards.
6Wresearch actively monitors the South Africa EMV Smart Cards Market and publishes its comprehensive annual report, highlighting emerging trends, growth drivers, revenue analysis, and forecast outlook. Our insights help businesses to make data-backed strategic decisions with ongoing market dynamics. Our analysts track relevent industries related to the South Africa EMV Smart Cards Market, allowing our clients with actionable intelligence and reliable forecasts tailored to emerging regional needs.
Yes, we provide customisation as per your requirements. To learn more, feel free to contact us on sales@6wresearch.com
| 1 Executive Summary |
| 2 Introduction |
| 2.1 Key Highlights of the Report |
| 2.2 Report Description |
| 2.3 Market Scope & Segmentation |
| 2.4 Research Methodology |
| 2.5 Assumptions |
| 3 South Africa EMV Smart Cards Market Overview |
| 3.1 South Africa Country Macro Economic Indicators |
| 3.2 South Africa EMV Smart Cards Market Revenues & Volume, 2022 & 2032F |
| 3.3 South Africa EMV Smart Cards Market - Industry Life Cycle |
| 3.4 South Africa EMV Smart Cards Market - Porter's Five Forces |
| 3.5 South Africa EMV Smart Cards Market Revenues & Volume Share, By Contact Form, 2022 & 2032F |
| 3.6 South Africa EMV Smart Cards Market Revenues & Volume Share, By Fuel Card, 2022 & 2032F |
| 3.7 South Africa EMV Smart Cards Market Revenues & Volume Share, By BFSI, 2022 & 2032F |
| 3.8 South Africa EMV Smart Cards Market Revenues & Volume Share, By Wholesaler, 2022 & 2032F |
| 4 South Africa EMV Smart Cards Market Dynamics |
| 4.1 Impact Analysis |
| 4.2 Market Drivers |
| 4.2.1 Increasing adoption of digital payment methods in South Africa |
| 4.2.2 Regulatory mandates for secure payment transactions |
| 4.2.3 Growing awareness about the benefits of EMV smart cards in preventing fraud and enhancing security |
| 4.3 Market Restraints |
| 4.3.1 High initial implementation costs of EMV smart card technology |
| 4.3.2 Lack of infrastructure and technical expertise for widespread adoption |
| 4.3.3 Resistance to change from traditional payment methods |
| 5 South Africa EMV Smart Cards Market Trends |
| 6 South Africa EMV Smart Cards Market, By Types |
| 6.1 South Africa EMV Smart Cards Market, By Contact Form |
| 6.1.1 Overview and Analysis |
| 6.1.2 South Africa EMV Smart Cards Market Revenues & Volume, By Contact Form, 2022 - 2032F |
| 6.1.3 South Africa EMV Smart Cards Market Revenues & Volume, By Contactless Form, 2022 - 2032F |
| 6.2 South Africa EMV Smart Cards Market, By Fuel Card |
| 6.2.1 Overview and Analysis |
| 6.2.2 South Africa EMV Smart Cards Market Revenues & Volume, By Retail Store Card, 2022 - 2032F |
| 6.2.3 South Africa EMV Smart Cards Market Revenues & Volume, By Meal Voucher Card, 2022 - 2032F |
| 6.2.4 South Africa EMV Smart Cards Market Revenues & Volume, By Others, 2022 - 2032F |
| 6.3 South Africa EMV Smart Cards Market, By BFSI |
| 6.3.1 Overview and Analysis |
| 6.3.2 South Africa EMV Smart Cards Market Revenues & Volume, By Healthcare, 2022 - 2032F |
| 6.3.3 South Africa EMV Smart Cards Market Revenues & Volume, By Retail, 2022 - 2032F |
| 6.3.4 South Africa EMV Smart Cards Market Revenues & Volume, By IT & Telecommunication, 2022 - 2032F |
| 6.3.5 South Africa EMV Smart Cards Market Revenues & Volume, By Travel & Hospitality, 2022 - 2032F |
| 6.3.6 South Africa EMV Smart Cards Market Revenues & Volume, By Transportation & Logistics, 2022 - 2032F |
| 6.3.7 South Africa EMV Smart Cards Market Revenues & Volume, By Media & Entertainment, 2022 - 2032F |
| 6.3.8 South Africa EMV Smart Cards Market Revenues & Volume, By Others, 2022 - 2032F |
| 6.3.9 South Africa EMV Smart Cards Market Revenues & Volume, By Others, 2022 - 2032F |
| 6.4 South Africa EMV Smart Cards Market, By Wholesaler |
| 6.4.1 Overview and Analysis |
| 6.4.2 South Africa EMV Smart Cards Market Revenues & Volume, By Retail Brokers, 2022 - 2032F |
| 6.4.3 South Africa EMV Smart Cards Market Revenues & Volume, By Others, 2022 - 2032F |
| 7 South Africa EMV Smart Cards Market Import-Export Trade Statistics |
| 7.1 South Africa EMV Smart Cards Market Export to Major Countries |
| 7.2 South Africa EMV Smart Cards Market Imports from Major Countries |
| 8 South Africa EMV Smart Cards Market Key Performance Indicators |
| 8.1 Number of EMV smart card transactions processed |
| 8.2 Rate of adoption of EMV smart card technology by financial institutions |
| 8.3 Percentage of POS terminals enabled for EMV transactions |
| 8.4 Average transaction value through EMV smart cards |
| 8.5 Number of reported instances of fraud prevention through EMV technology |
| 9 South Africa EMV Smart Cards Market - Opportunity Assessment |
| 9.1 South Africa EMV Smart Cards Market Opportunity Assessment, By Contact Form, 2022 & 2032F |
| 9.2 South Africa EMV Smart Cards Market Opportunity Assessment, By Fuel Card, 2022 & 2032F |
| 9.3 South Africa EMV Smart Cards Market Opportunity Assessment, By BFSI, 2022 & 2032F |
| 9.4 South Africa EMV Smart Cards Market Opportunity Assessment, By Wholesaler, 2022 & 2032F |
| 10 South Africa EMV Smart Cards Market - Competitive Landscape |
| 10.1 South Africa EMV Smart Cards Market Revenue Share, By Companies, 2025 |
| 10.2 South Africa EMV Smart Cards Market Competitive Benchmarking, By Operating and Technical Parameters |
| 11 Company Profiles |
| 12 Recommendations |
| 13 Disclaimer |
Global Go To Market Strategy - 2030
Export potential enables firms to identify high-growth global markets with greater confidence by combining advanced trade intelligence with a structured quantitative methodology. The framework analyzes emerging demand trends and country-level import patterns while integrating macroeconomic and trade datasets such as GDP and population forecasts, bilateral import–export flows, tariff structures, elasticity differentials between developed and developing economies, geographic distance, and import demand projections. Using weighted trade values from 2020–2024 as the base period to project country-to-country export potential for 2030, these inputs are operationalized through calculated drivers such as gravity model parameters, tariff impact factors, and projected GDP per-capita growth. Through an analysis of hidden potentials, demand hotspots, and market conditions that are most favorable to success, this method enables firms to focus on target countries, maximize returns, and global expansion with data, backed by accuracy.
By factoring in the projected importer demand gap that is currently unmet and could be potential opportunity, it identifies the potential for the Exporter (Country) among 190 countries, against the general trade analysis, which identifies the biggest importer or exporter.
To discover high-growth global markets and optimize your business strategy:
Click Here
Pricing
- Single User License$ 1,995
- Department License$ 2,400
- Site License$ 3,120
- Global License$ 3,795

Leadership Perspectives from Industry Events
Search
Thought Leadership and Analyst Meet


Our Clients
6WResearch In News
- India Air Conditioner Market Set for Strong Rebound in 2026 After Weather-Led Correction and GST-Driven Recovery: 6Wresearch
- ADAS in India: How Automatic Emergency Braking, Blind Spot Detection & Driver Monitoring are Transforming Road Safety
- Doha a strategic location for EV manufacturing hub: IPA Qatar
- Demand for luxury TVs surging in the GCC, says Samsung
- Empowering Growth: The Thriving Journey of Bangladesh’s Cable Industry
- Demand for luxury TVs surging in the GCC, says Samsung
Latest Reports
- Nicaragua RPG Gaming Market (2026-2032)
- New Zealand RPG Gaming Market (2026-2032)
- Netherlands RPG Gaming Market (2026-2032)
- Nauru RPG Gaming Market (2026-2032)
- Namibia RPG Gaming Market (2026-2032)
- Mozambique RPG Gaming Market (2026-2032)
- Montenegro RPG Gaming Market (2026-2032)
- Mongolia RPG Gaming Market (2026-2032)
- Monaco RPG Gaming Market (2026-2032)
- Micronesia RPG Gaming Market (2026-2032)
Industry Events and Analyst Meet

EV India Expo 2026

HIMTEX 2026

India Refining Summit 2026

India EV Show 2026

EV tech India Expo 2026
Whitepaper
- Middle East & Africa Commercial Security Market Click here to view more.
- Middle East & Africa Fire Safety Systems & Equipment Market Click here to view more.
- GCC Drone Market Click here to view more.
- Middle East Lighting Fixture Market Click here to view more.
- GCC Physical & Perimeter Security Market Click here to view more.