South Africa Kegs Market Outlook | Analysis, Growth, Revenue, Companies, Trends, Forecast, Size, Value, Share, Industry & COVID-19 IMPACT
Market Forecast By Material (Plastic, Tin, Stainless Steel), By Capacity (Up to 20 Liter, 20 Liter to 40 Liter, 40 Liter to 60 Liter, Above 60 Liter), By End Use (Alcoholic Beverages, Non-Alcoholic Beverages, Cooking Oil, Chemicals, Others), By Distribution Channel (Supermarket/Hypermarket, Commercial Liquor Store, Others) And Competitive Landscape
| Product Code: ETC253548 | Publication Date: Aug 2022 | Updated Date: Aug 2025 | Product Type: Market Research Report | |
| Publisher: 6Wresearch | Author: Ravi Bhandari | No. of Pages: 75 | No. of Figures: 35 | No. of Tables: 20 |
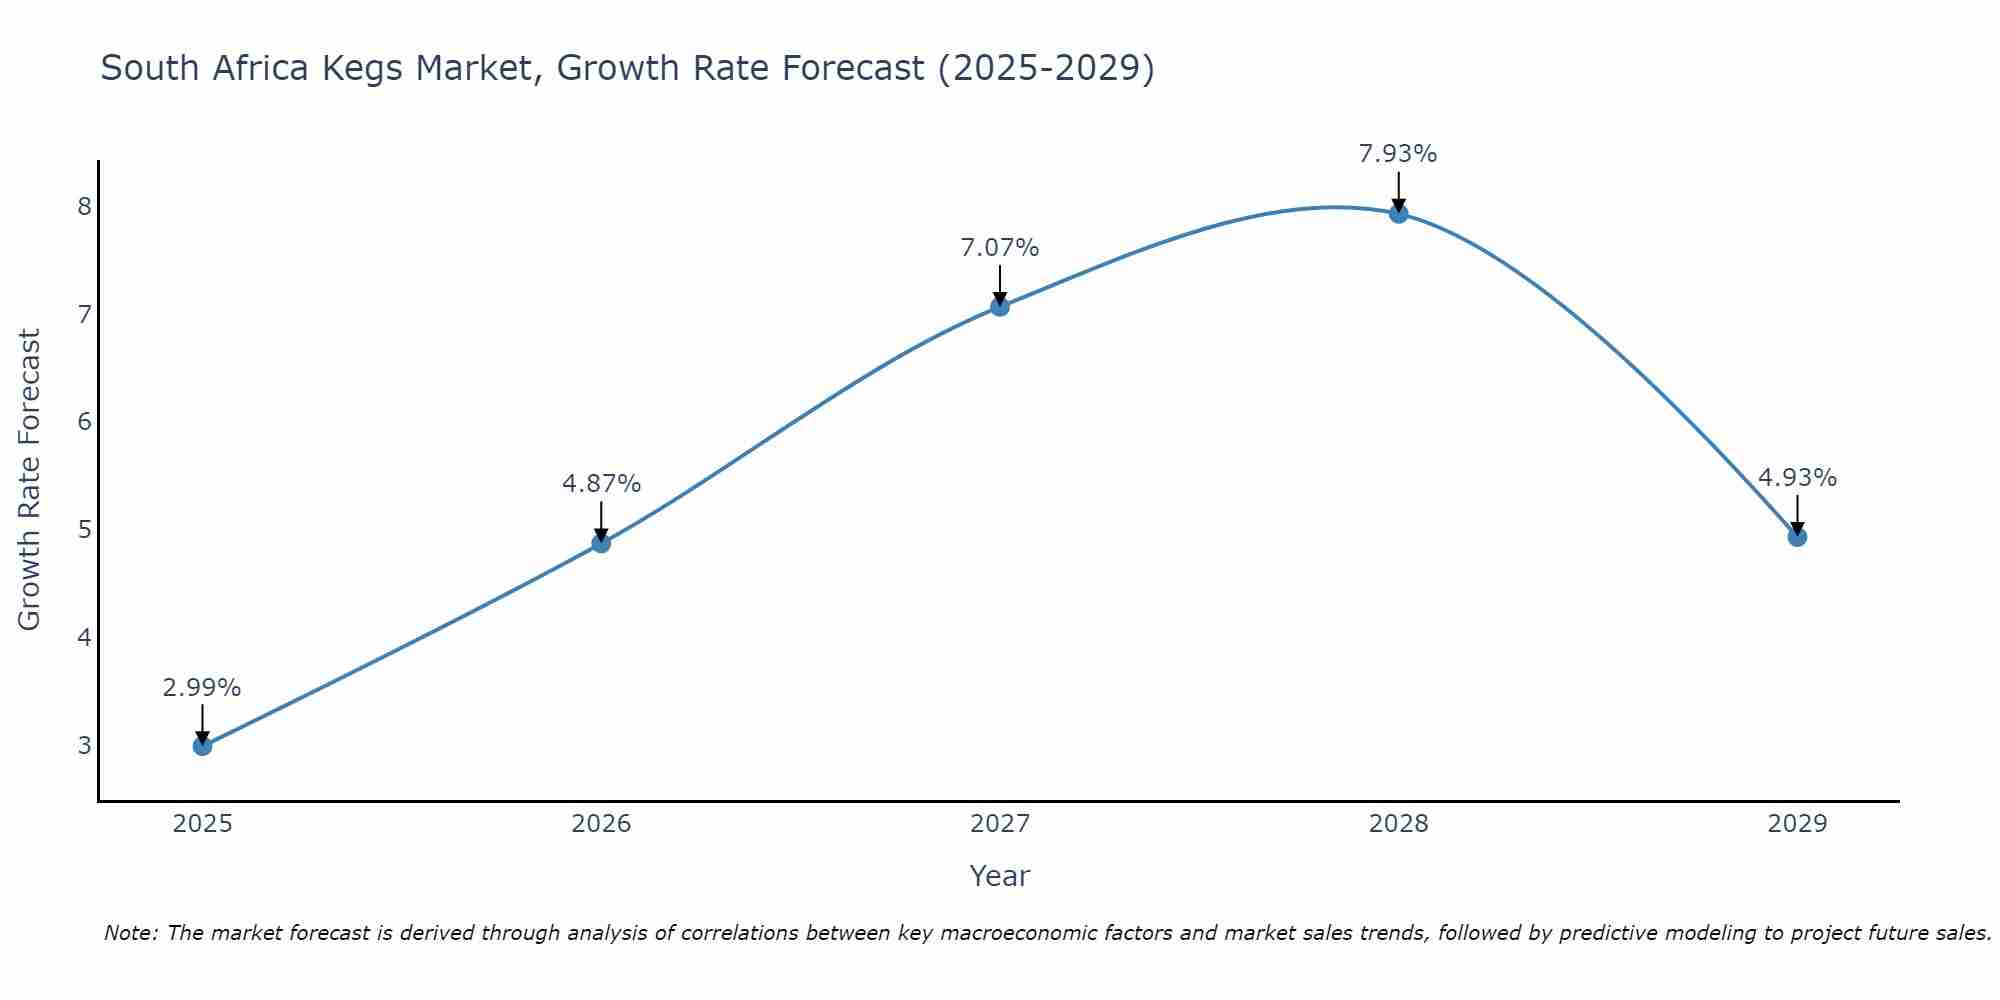
South Africa Kegs Market Size Growth Rate
The South Africa Kegs Market is projected to witness mixed growth rate patterns during 2025 to 2029. The growth rate begins at 2.99% in 2025, climbs to a high of 7.93% in 2028, and moderates to 4.93% by 2029.
South Africa Kegs Market Overview
The kegs market in South Africa provides stainless steel containers for storing and dispensing beverages in breweries, bars, and restaurants. Growing preferences for craft beer and sustainable packaging solutions drive market growth.
Drivers of the market
The South Africa kegs market is witnessing growth with increasing demand from breweries and beverage industries for kegs used in beer dispensing and distribution. Kegs offer advantages in terms of product freshness, transportation efficiency, and sustainability over bottles and cans. Market expansion is driven by growing beer consumption and preferences for draft beer experiences.
Challenges of the market
Challenges in the South African kegs market involve optimizing keg logistics and distribution networks, managing keg hygiene and maintenance, and addressing environmental sustainability in keg manufacturing and recycling. Innovating towards lightweight and durable keg materials, enhancing keg tracking and management systems, and fostering partnerships with beverage industries for keg supply chain efficiency are pivotal challenges for keg manufacturers and breweries.
Government Policy of the market
Government policies in the kegs market prioritize beverage packaging standards, recycling initiatives, and support for eco-friendly materials. Regulations include keg hygiene requirements, refillable container incentives, and promoting sustainable brewery practices.
Key Highlights of the Report:
- South Africa Kegs Market Outlook
- Market Size of South Africa Kegs Market, 2024
- Forecast of South Africa Kegs Market, 2031
- Historical Data and Forecast of South Africa Kegs Revenues & Volume for the Period 2018 - 2031
- South Africa Kegs Market Trend Evolution
- South Africa Kegs Market Drivers and Challenges
- South Africa Kegs Price Trends
- South Africa Kegs Porter's Five Forces
- South Africa Kegs Industry Life Cycle
- Historical Data and Forecast of South Africa Kegs Market Revenues & Volume By Material for the Period 2018 - 2031
- Historical Data and Forecast of South Africa Kegs Market Revenues & Volume By Plastic for the Period 2018 - 2031
- Historical Data and Forecast of South Africa Kegs Market Revenues & Volume By Tin for the Period 2018 - 2031
- Historical Data and Forecast of South Africa Kegs Market Revenues & Volume By Stainless Steel for the Period 2018 - 2031
- Historical Data and Forecast of South Africa Kegs Market Revenues & Volume By Capacity for the Period 2018 - 2031
- Historical Data and Forecast of South Africa Kegs Market Revenues & Volume By Up to 20 Liter for the Period 2018 - 2031
- Historical Data and Forecast of South Africa Kegs Market Revenues & Volume By 20 Liter to 40 Liter for the Period 2018 - 2031
- Historical Data and Forecast of South Africa Kegs Market Revenues & Volume By 40 Liter to 60 Liter for the Period 2018 - 2031
- Historical Data and Forecast of South Africa Kegs Market Revenues & Volume By Above 60 Liter for the Period 2018 - 2031
- Historical Data and Forecast of South Africa Kegs Market Revenues & Volume By End Use for the Period 2018 - 2031
- Historical Data and Forecast of South Africa Kegs Market Revenues & Volume By Alcoholic Beverages for the Period 2018 - 2031
- Historical Data and Forecast of South Africa Kegs Market Revenues & Volume By Non-Alcoholic Beverages for the Period 2018 - 2031
- Historical Data and Forecast of South Africa Kegs Market Revenues & Volume By Cooking Oil for the Period 2018 - 2031
- Historical Data and Forecast of South Africa Kegs Market Revenues & Volume By Chemicals for the Period 2018 - 2031
- Historical Data and Forecast of South Africa Kegs Market Revenues & Volume By Others for the Period 2018 - 2031
- Historical Data and Forecast of South Africa Kegs Market Revenues & Volume By Distribution Channel for the Period 2018 - 2031
- Historical Data and Forecast of South Africa Kegs Market Revenues & Volume By Supermarket/Hypermarket for the Period 2018 - 2031
- Historical Data and Forecast of South Africa Kegs Market Revenues & Volume By Commercial Liquor Store for the Period 2018 - 2031
- Historical Data and Forecast of South Africa Kegs Market Revenues & Volume By Others for the Period 2018 - 2031
- South Africa Kegs Import Export Trade Statistics
- Market Opportunity Assessment By Material
- Market Opportunity Assessment By Capacity
- Market Opportunity Assessment By End Use
- Market Opportunity Assessment By Distribution Channel
- South Africa Kegs Top Companies Market Share
- South Africa Kegs Competitive Benchmarking By Technical and Operational Parameters
- South Africa Kegs Company Profiles
- South Africa Kegs Key Strategic Recommendations
Frequently Asked Questions About the Market Study (FAQs):
6Wresearch actively monitors the South Africa Kegs Market and publishes its comprehensive annual report, highlighting emerging trends, growth drivers, revenue analysis, and forecast outlook. Our insights help businesses to make data-backed strategic decisions with ongoing market dynamics. Our analysts track relevent industries related to the South Africa Kegs Market, allowing our clients with actionable intelligence and reliable forecasts tailored to emerging regional needs.
Yes, we provide customisation as per your requirements. To learn more, feel free to contact us on sales@6wresearch.com
1 Executive Summary |
2 Introduction |
2.1 Key Highlights of the Report |
2.2 Report Description |
2.3 Market Scope & Segmentation |
2.4 Research Methodology |
2.5 Assumptions |
3 South Africa Kegs Market Overview |
3.1 South Africa Country Macro Economic Indicators |
3.2 South Africa Kegs Market Revenues & Volume, 2021 & 2031F |
3.3 South Africa Kegs Market - Industry Life Cycle |
3.4 South Africa Kegs Market - Porter's Five Forces |
3.5 South Africa Kegs Market Revenues & Volume Share, By Material, 2021 & 2031F |
3.6 South Africa Kegs Market Revenues & Volume Share, By Capacity, 2021 & 2031F |
3.7 South Africa Kegs Market Revenues & Volume Share, By End Use, 2021 & 2031F |
3.8 South Africa Kegs Market Revenues & Volume Share, By Distribution Channel, 2021 & 2031F |
4 South Africa Kegs Market Dynamics |
4.1 Impact Analysis |
4.2 Market Drivers |
4.2.1 Increasing demand for craft beers in South Africa |
4.2.2 Growing popularity of social drinking culture in the region |
4.2.3 Rising number of breweries and bars/restaurants offering draft beer |
4.3 Market Restraints |
4.3.1 High initial investment cost for setting up kegging systems |
4.3.2 Limited availability of raw materials for keg production |
4.3.3 Stringent regulations and licensing requirements for alcohol-related businesses in South Africa |
5 South Africa Kegs Market Trends |
6 South Africa Kegs Market, By Types |
6.1 South Africa Kegs Market, By Material |
6.1.1 Overview and Analysis |
6.1.2 South Africa Kegs Market Revenues & Volume, By Material, 2021-2031F |
6.1.3 South Africa Kegs Market Revenues & Volume, By Plastic, 2021-2031F |
6.1.4 South Africa Kegs Market Revenues & Volume, By Tin, 2021-2031F |
6.1.5 South Africa Kegs Market Revenues & Volume, By Stainless Steel, 2021-2031F |
6.2 South Africa Kegs Market, By Capacity |
6.2.1 Overview and Analysis |
6.2.2 South Africa Kegs Market Revenues & Volume, By Up to 20 Liter, 2021-2031F |
6.2.3 South Africa Kegs Market Revenues & Volume, By 20 Liter to 40 Liter, 2021-2031F |
6.2.4 South Africa Kegs Market Revenues & Volume, By 40 Liter to 60 Liter, 2021-2031F |
6.2.5 South Africa Kegs Market Revenues & Volume, By Above 60 Liter, 2021-2031F |
6.3 South Africa Kegs Market, By End Use |
6.3.1 Overview and Analysis |
6.3.2 South Africa Kegs Market Revenues & Volume, By Alcoholic Beverages, 2021-2031F |
6.3.3 South Africa Kegs Market Revenues & Volume, By Non-Alcoholic Beverages, 2021-2031F |
6.3.4 South Africa Kegs Market Revenues & Volume, By Cooking Oil, 2021-2031F |
6.3.5 South Africa Kegs Market Revenues & Volume, By Chemicals, 2021-2031F |
6.3.6 South Africa Kegs Market Revenues & Volume, By Others, 2021-2031F |
6.4 South Africa Kegs Market, By Distribution Channel |
6.4.1 Overview and Analysis |
6.4.2 South Africa Kegs Market Revenues & Volume, By Supermarket/Hypermarket, 2021-2031F |
6.4.3 South Africa Kegs Market Revenues & Volume, By Commercial Liquor Store, 2021-2031F |
6.4.4 South Africa Kegs Market Revenues & Volume, By Others, 2021-2031F |
7 South Africa Kegs Market Import-Export Trade Statistics |
7.1 South Africa Kegs Market Export to Major Countries |
7.2 South Africa Kegs Market Imports from Major Countries |
8 South Africa Kegs Market Key Performance Indicators |
8.1 Average kegs sold per brewery/bar per month |
8.2 Percentage of breweries/bars using kegs as the primary dispensing method |
8.3 Rate of adoption of kegs among new breweries in South Africa |
9 South Africa Kegs Market - Opportunity Assessment |
9.1 South Africa Kegs Market Opportunity Assessment, By Material, 2021 & 2031F |
9.2 South Africa Kegs Market Opportunity Assessment, By Capacity, 2021 & 2031F |
9.3 South Africa Kegs Market Opportunity Assessment, By End Use, 2021 & 2031F |
9.4 South Africa Kegs Market Opportunity Assessment, By Distribution Channel, 2021 & 2031F |
10 South Africa Kegs Market - Competitive Landscape |
10.1 South Africa Kegs Market Revenue Share, By Companies, 2024 |
10.2 South Africa Kegs Market Competitive Benchmarking, By Operating and Technical Parameters |
11 Company Profiles |
12 Recommendations |
13 Disclaimer |
Global Go To Market Strategy - 2030
Export potential enables firms to identify high-growth global markets with greater confidence by combining advanced trade intelligence with a structured quantitative methodology. The framework analyzes emerging demand trends and country-level import patterns while integrating macroeconomic and trade datasets such as GDP and population forecasts, bilateral import–export flows, tariff structures, elasticity differentials between developed and developing economies, geographic distance, and import demand projections. Using weighted trade values from 2020–2024 as the base period to project country-to-country export potential for 2030, these inputs are operationalized through calculated drivers such as gravity model parameters, tariff impact factors, and projected GDP per-capita growth. Through an analysis of hidden potentials, demand hotspots, and market conditions that are most favorable to success, this method enables firms to focus on target countries, maximize returns, and global expansion with data, backed by accuracy.
By factoring in the projected importer demand gap that is currently unmet and could be potential opportunity, it identifies the potential for the Exporter (Country) among 190 countries, against the general trade analysis, which identifies the biggest importer or exporter.
To discover high-growth global markets and optimize your business strategy:
Click Here
Pricing
- Single User License$ 1,995
- Department License$ 2,400
- Site License$ 3,120
- Global License$ 3,795

Leadership Perspectives from Industry Events
Search
Thought Leadership and Analyst Meet


Our Clients
6WResearch In News
- India Air Conditioner Market Set for Strong Rebound in 2026 After Weather-Led Correction and GST-Driven Recovery: 6Wresearch
- ADAS in India: How Automatic Emergency Braking, Blind Spot Detection & Driver Monitoring are Transforming Road Safety
- Doha a strategic location for EV manufacturing hub: IPA Qatar
- Demand for luxury TVs surging in the GCC, says Samsung
- Empowering Growth: The Thriving Journey of Bangladesh’s Cable Industry
- Demand for luxury TVs surging in the GCC, says Samsung
Latest Reports
- Nicaragua RPG Gaming Market (2026-2032)
- New Zealand RPG Gaming Market (2026-2032)
- Netherlands RPG Gaming Market (2026-2032)
- Nauru RPG Gaming Market (2026-2032)
- Namibia RPG Gaming Market (2026-2032)
- Mozambique RPG Gaming Market (2026-2032)
- Montenegro RPG Gaming Market (2026-2032)
- Mongolia RPG Gaming Market (2026-2032)
- Monaco RPG Gaming Market (2026-2032)
- Micronesia RPG Gaming Market (2026-2032)
Industry Events and Analyst Meet

EV India Expo 2026

HIMTEX 2026

India Refining Summit 2026

India EV Show 2026

EV tech India Expo 2026
Whitepaper
- Middle East & Africa Commercial Security Market Click here to view more.
- Middle East & Africa Fire Safety Systems & Equipment Market Click here to view more.
- GCC Drone Market Click here to view more.
- Middle East Lighting Fixture Market Click here to view more.
- GCC Physical & Perimeter Security Market Click here to view more.