South Africa N-propanol Market Outlook | COVID-19 IMPACT, Share, Forecast, Value, Analysis, Growth, Companies, Trends, Industry, Size & Revenue
Market Forecast By Type (Ethylene Hydrogenation Method, Allyl Alcohol Hydrogenation Method, Other Compounds Byproduct Method), By Application (Coatings, Food Additive, Pharmaceutical, Cosmetics, Others) And Competitive Landscape
| Product Code: ETC335088 | Publication Date: Aug 2022 | Updated Date: Sep 2025 | Product Type: Market Research Report | |
| Publisher: 6Wresearch | Author: Shubham Padhi | No. of Pages: 75 | No. of Figures: 35 | No. of Tables: 20 |
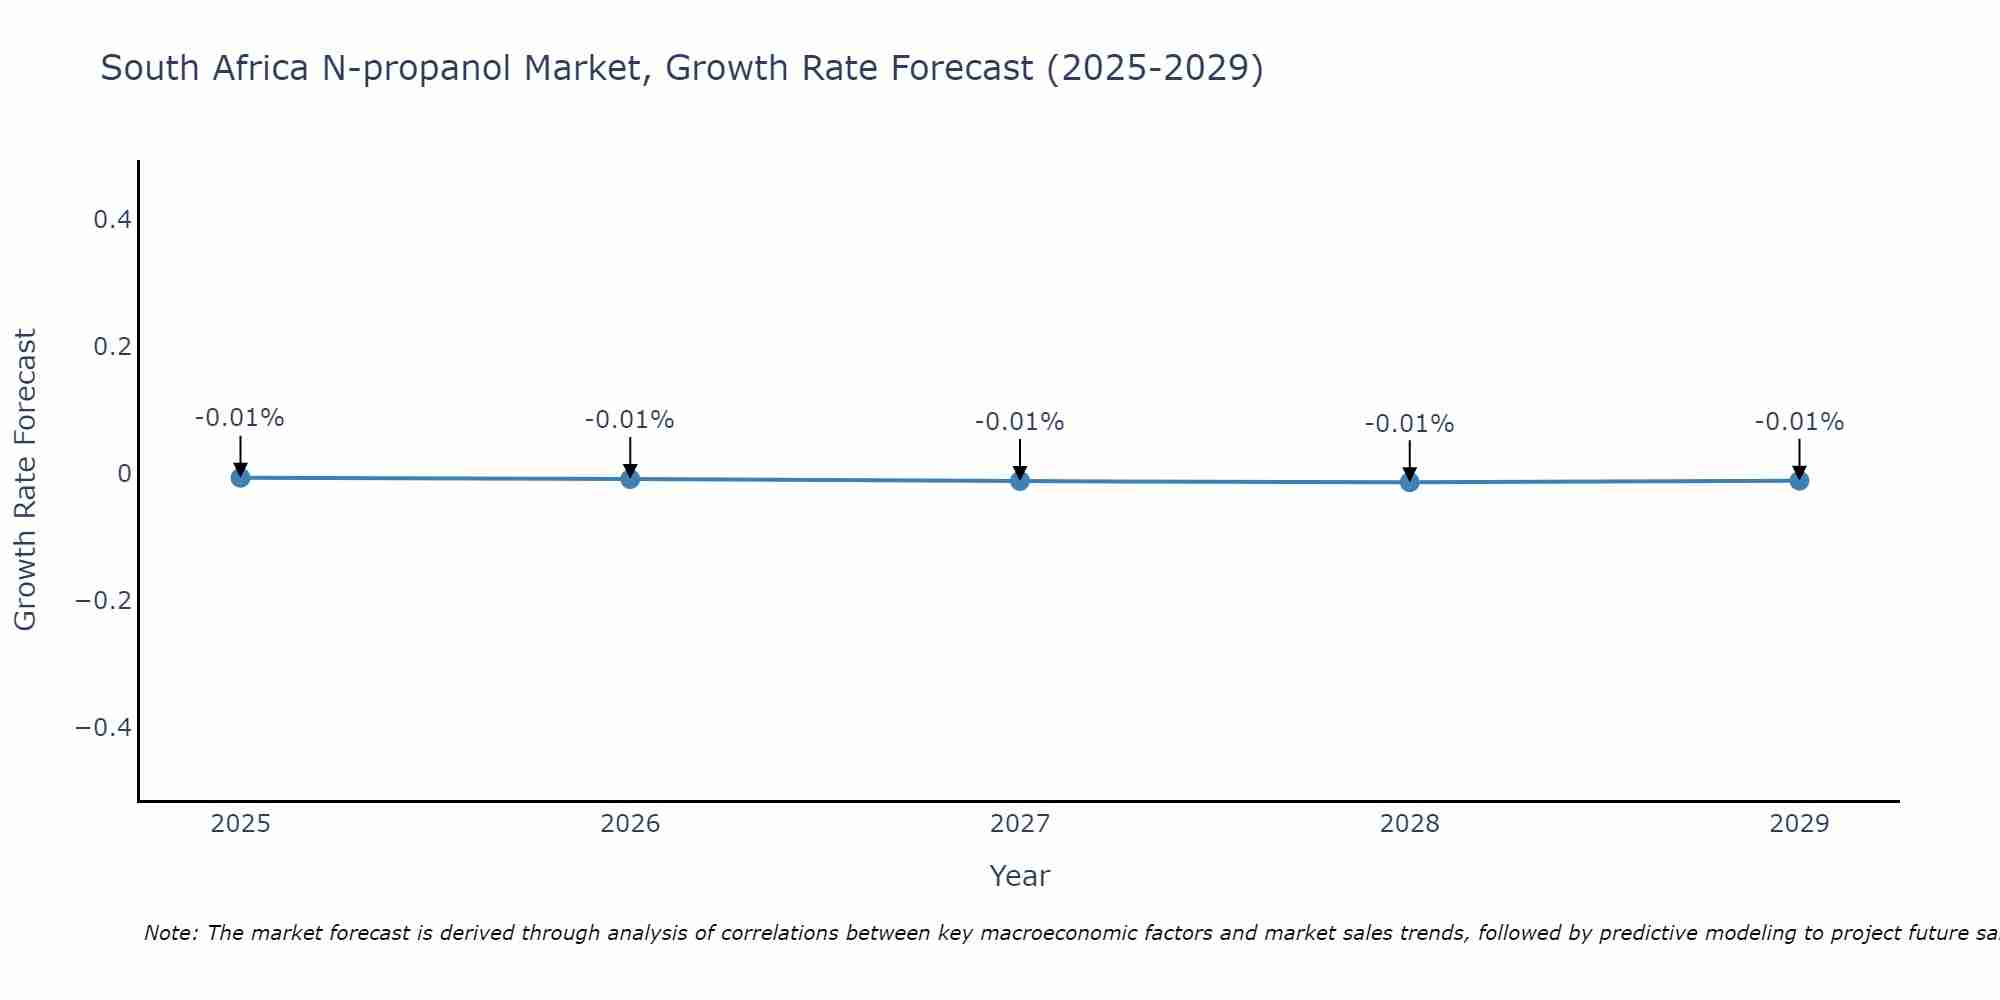
South Africa N-propanol Market Size Growth Rate
The South Africa N-propanol Market is projected to witness mixed growth rate patterns during 2025 to 2029. Beginning strongly at -0.01% in 2025, growth softens to -0.01% in 2029.
South Africa N-propanol Market Overview
The South African N-propanol market is characterized by its application in various industries, including pharmaceuticals, cosmetics, and chemicals. N-propanol is used as a solvent, in the manufacturing of cleaning agents, and as a precursor in chemical synthesis. The market`s growth is supported by the expanding pharmaceutical and cosmetic industries in the country. Additionally, increasing industrial activities and the rising demand for high-quality solvents are driving the market forward.
Drivers of the market
The demand in the South African N-propanol market is propelled by its wide range of applications in industries such as pharmaceuticals, cosmetics, and chemicals. The market benefits from the increasing use of N-propanol as a solvent and its application in the manufacturing of personal care products and paints.
Challenges of the market
The N-propanol market in South Africa encounters hurdles such as volatile crude oil prices, which directly impact production costs, and stringent environmental regulations that necessitate costly compliance measures. Moreover, limited domestic production capabilities result in high dependency on imports, leading to supply chain vulnerabilities.
Government Policy of the market
In South Africa, the market for N-propanol is influenced by regulations that focus on chemical safety and environmental protection. The government enforces stringent guidelines on the handling, storage, and transportation of industrial chemicals, including N-propanol. These regulations are designed to minimize environmental hazards and ensure the safety of workers. Furthermore, there are import and export controls in place to regulate the trade of N-propanol, ensuring that it complies with international safety standards. The government also supports research and development initiatives aimed at finding safer and more sustainable alternatives to traditional solvents.
Key Highlights of the Report:
- South Africa N-propanol Market Outlook
- Market Size of South Africa N-propanol Market, 2024
- Forecast of South Africa N-propanol Market, 2031
- Historical Data and Forecast of South Africa N-propanol Revenues & Volume for the Period 2018 - 2031
- South Africa N-propanol Market Trend Evolution
- South Africa N-propanol Market Drivers and Challenges
- South Africa N-propanol Price Trends
- South Africa N-propanol Porter's Five Forces
- South Africa N-propanol Industry Life Cycle
- Historical Data and Forecast of South Africa N-propanol Market Revenues & Volume By Type for the Period 2018 - 2031
- Historical Data and Forecast of South Africa N-propanol Market Revenues & Volume By Ethylene Hydrogenation Method for the Period 2018 - 2031
- Historical Data and Forecast of South Africa N-propanol Market Revenues & Volume By Allyl Alcohol Hydrogenation Method for the Period 2018 - 2031
- Historical Data and Forecast of South Africa N-propanol Market Revenues & Volume By Other Compounds Byproduct Method for the Period 2018 - 2031
- Historical Data and Forecast of South Africa N-propanol Market Revenues & Volume By Application for the Period 2018 - 2031
- Historical Data and Forecast of South Africa N-propanol Market Revenues & Volume By Coatings for the Period 2018 - 2031
- Historical Data and Forecast of South Africa N-propanol Market Revenues & Volume By Food Additive for the Period 2018 - 2031
- Historical Data and Forecast of South Africa N-propanol Market Revenues & Volume By Pharmaceutical for the Period 2018 - 2031
- Historical Data and Forecast of South Africa N-propanol Market Revenues & Volume By Cosmetics for the Period 2018 - 2031
- Historical Data and Forecast of South Africa N-propanol Market Revenues & Volume By Others for the Period 2018 - 2031
- South Africa N-propanol Import Export Trade Statistics
- Market Opportunity Assessment By Type
- Market Opportunity Assessment By Application
- South Africa N-propanol Top Companies Market Share
- South Africa N-propanol Competitive Benchmarking By Technical and Operational Parameters
- South Africa N-propanol Company Profiles
- South Africa N-propanol Key Strategic Recommendations
Frequently Asked Questions About the Market Study (FAQs):
6Wresearch actively monitors the South Africa N-propanol Market and publishes its comprehensive annual report, highlighting emerging trends, growth drivers, revenue analysis, and forecast outlook. Our insights help businesses to make data-backed strategic decisions with ongoing market dynamics. Our analysts track relevent industries related to the South Africa N-propanol Market, allowing our clients with actionable intelligence and reliable forecasts tailored to emerging regional needs.
Yes, we provide customisation as per your requirements. To learn more, feel free to contact us on sales@6wresearch.com
1 Executive Summary |
2 Introduction |
2.1 Key Highlights of the Report |
2.2 Report Description |
2.3 Market Scope & Segmentation |
2.4 Research Methodology |
2.5 Assumptions |
3 South Africa N-propanol Market Overview |
3.1 South Africa Country Macro Economic Indicators |
3.2 South Africa N-propanol Market Revenues & Volume, 2021 & 2031F |
3.3 South Africa N-propanol Market - Industry Life Cycle |
3.4 South Africa N-propanol Market - Porter's Five Forces |
3.5 South Africa N-propanol Market Revenues & Volume Share, By Type, 2021 & 2031F |
3.6 South Africa N-propanol Market Revenues & Volume Share, By Application, 2021 & 2031F |
4 South Africa N-propanol Market Dynamics |
4.1 Impact Analysis |
4.2 Market Drivers |
4.2.1 Increasing demand for n-propanol in the pharmaceutical industry for manufacturing drugs and medicines |
4.2.2 Growing use of n-propanol as a solvent in the cosmetics and personal care industry |
4.2.3 Rising adoption of n-propanol as a cleaning agent in industrial applications |
4.3 Market Restraints |
4.3.1 Fluctuating prices of raw materials used in the production of n-propanol |
4.3.2 Stringent regulations and compliance requirements related to the handling and disposal of n-propanol waste |
4.3.3 Competition from alternative solvents and chemicals impacting the demand for n-propanol |
5 South Africa N-propanol Market Trends |
6 South Africa N-propanol Market, By Types |
6.1 South Africa N-propanol Market, By Type |
6.1.1 Overview and Analysis |
6.1.2 South Africa N-propanol Market Revenues & Volume, By Type, 2021-2031F |
6.1.3 South Africa N-propanol Market Revenues & Volume, By Ethylene Hydrogenation Method, 2021-2031F |
6.1.4 South Africa N-propanol Market Revenues & Volume, By Allyl Alcohol Hydrogenation Method, 2021-2031F |
6.1.5 South Africa N-propanol Market Revenues & Volume, By Other Compounds Byproduct Method, 2021-2031F |
6.2 South Africa N-propanol Market, By Application |
6.2.1 Overview and Analysis |
6.2.2 South Africa N-propanol Market Revenues & Volume, By Coatings, 2021-2031F |
6.2.3 South Africa N-propanol Market Revenues & Volume, By Food Additive, 2021-2031F |
6.2.4 South Africa N-propanol Market Revenues & Volume, By Pharmaceutical, 2021-2031F |
6.2.5 South Africa N-propanol Market Revenues & Volume, By Cosmetics, 2021-2031F |
6.2.6 South Africa N-propanol Market Revenues & Volume, By Others, 2021-2031F |
7 South Africa N-propanol Market Import-Export Trade Statistics |
7.1 South Africa N-propanol Market Export to Major Countries |
7.2 South Africa N-propanol Market Imports from Major Countries |
8 South Africa N-propanol Market Key Performance Indicators |
8.1 Percentage of n-propanol usage in pharmaceutical manufacturing processes |
8.2 Number of new product launches in the cosmetics and personal care industry using n-propanol |
8.3 Compliance rate with environmental regulations related to n-propanol handling and disposal |
9 South Africa N-propanol Market - Opportunity Assessment |
9.1 South Africa N-propanol Market Opportunity Assessment, By Type, 2021 & 2031F |
9.2 South Africa N-propanol Market Opportunity Assessment, By Application, 2021 & 2031F |
10 South Africa N-propanol Market - Competitive Landscape |
10.1 South Africa N-propanol Market Revenue Share, By Companies, 2024 |
10.2 South Africa N-propanol Market Competitive Benchmarking, By Operating and Technical Parameters |
11 Company Profiles |
12 Recommendations |
13 Disclaimer |
Global Go To Market Strategy - 2030
Export potential enables firms to identify high-growth global markets with greater confidence by combining advanced trade intelligence with a structured quantitative methodology. The framework analyzes emerging demand trends and country-level import patterns while integrating macroeconomic and trade datasets such as GDP and population forecasts, bilateral import–export flows, tariff structures, elasticity differentials between developed and developing economies, geographic distance, and import demand projections. Using weighted trade values from 2020–2024 as the base period to project country-to-country export potential for 2030, these inputs are operationalized through calculated drivers such as gravity model parameters, tariff impact factors, and projected GDP per-capita growth. Through an analysis of hidden potentials, demand hotspots, and market conditions that are most favorable to success, this method enables firms to focus on target countries, maximize returns, and global expansion with data, backed by accuracy.
By factoring in the projected importer demand gap that is currently unmet and could be potential opportunity, it identifies the potential for the Exporter (Country) among 190 countries, against the general trade analysis, which identifies the biggest importer or exporter.
To discover high-growth global markets and optimize your business strategy:
Click Here
Pricing
- Single User License$ 1,995
- Department License$ 2,400
- Site License$ 3,120
- Global License$ 3,795

Leadership Perspectives from Industry Events
Search
Thought Leadership and Analyst Meet


Our Clients
6WResearch In News
- India Air Conditioner Market Set for Strong Rebound in 2026 After Weather-Led Correction and GST-Driven Recovery: 6Wresearch
- ADAS in India: How Automatic Emergency Braking, Blind Spot Detection & Driver Monitoring are Transforming Road Safety
- Doha a strategic location for EV manufacturing hub: IPA Qatar
- Demand for luxury TVs surging in the GCC, says Samsung
- Empowering Growth: The Thriving Journey of Bangladesh’s Cable Industry
- Demand for luxury TVs surging in the GCC, says Samsung
Latest Reports
- Nicaragua RPG Gaming Market (2026-2032)
- New Zealand RPG Gaming Market (2026-2032)
- Netherlands RPG Gaming Market (2026-2032)
- Nauru RPG Gaming Market (2026-2032)
- Namibia RPG Gaming Market (2026-2032)
- Mozambique RPG Gaming Market (2026-2032)
- Montenegro RPG Gaming Market (2026-2032)
- Mongolia RPG Gaming Market (2026-2032)
- Monaco RPG Gaming Market (2026-2032)
- Micronesia RPG Gaming Market (2026-2032)
Industry Events and Analyst Meet

EV India Expo 2026

HIMTEX 2026

India Refining Summit 2026

India EV Show 2026

EV tech India Expo 2026
Whitepaper
- Middle East & Africa Commercial Security Market Click here to view more.
- Middle East & Africa Fire Safety Systems & Equipment Market Click here to view more.
- GCC Drone Market Click here to view more.
- Middle East Lighting Fixture Market Click here to view more.
- GCC Physical & Perimeter Security Market Click here to view more.