South Korea Chemical Packaging Market (2026-2032) | Outlook, Forecast, Share, Companies, Industry, Revenue, Growth, Value, Size, Analysis & Trends
Market Forecast By Product Types (Sacks, Drums, FIBC, Other), By Applications (Pharmaceutical Factory, Laboratory, Chemical Plant, Others) And Competitive Landscape
| Product Code: ETC006883 | Publication Date: Sep 2020 | Updated Date: Jun 2026 | Product Type: Report | |
| Publisher: 6Wresearch | Author: Ravi Bhandari | No. of Pages: 70 | No. of Figures: 35 | No. of Tables: 5 |
South Korea Chemical Packaging Market Summary
The south korea chemical packaging market was estimated at USD 162 Million in 2025 and is projected to reach USD 227 Million by 2032, growing at a CAGR of 5.5% from 2026 to 2032.
South Korea Chemical Packaging Market Year-wise Growth Rate and Key Drivers
This graph highlights how the South Korea Chemical Packaging Market has steadily grown over the past five years, supported by major growth factors.
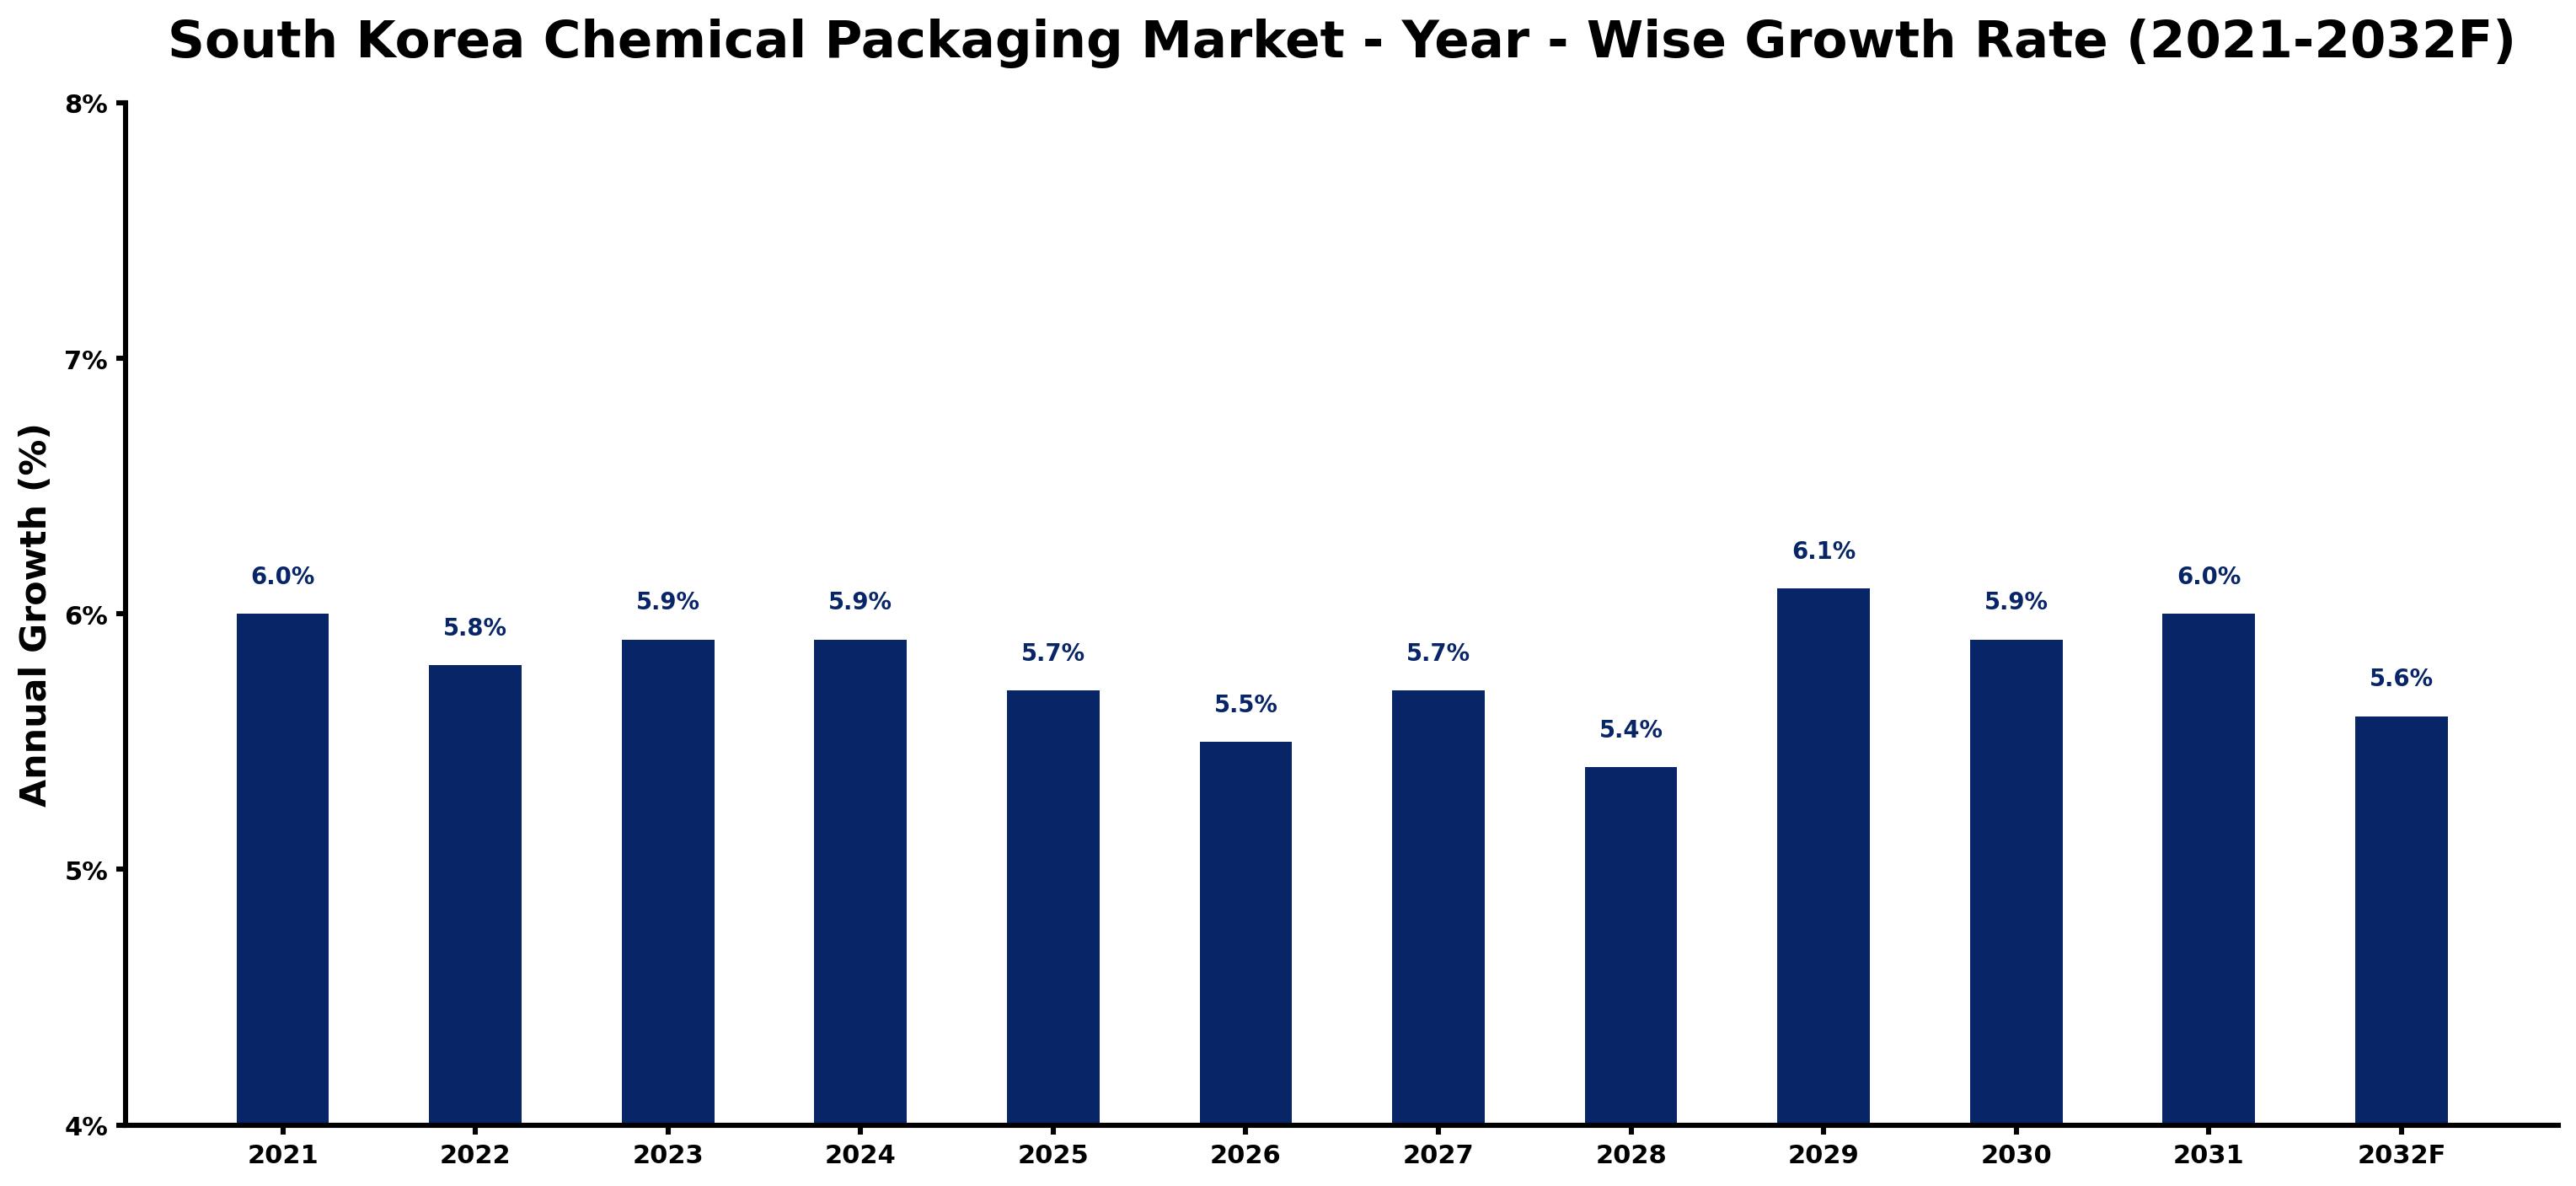
The table below presents the year wise growth rates along with the key drivers influencing the market
| Year | Growth Rate | Major Drivers |
| 2021 | 6.0% | Post-lockdown retail projects unveil new opportunities for chemical packaging demand. |
| 2022 | 5.8% | Corporate sustainability campaigns prompt shifts toward biodegradable packaging solutions. |
| 2023 | 5.9% | Increased urbanization leads to heightened requirements for efficient packaging solutions. |
| 2024 | 5.9% | Local manufacturers adapt to global supply chain challenges through innovative packaging methods. |
| 2025 | 5.7% | Technological breakthroughs streamline production processes, enhancing packaging efficiency significantly. |
| 2026 | 5.5% | Rising consumer awareness drives preferences for eco-friendly packaging alternatives. |
| 2027 | 5.7% | Partnerships between local firms and international players foster innovation in packaging design. |
| 2028 | 5.4% | E-commerce boom necessitates advanced packaging solutions for fragile chemical products. |
| 2029 | 6.1% | Emerging trends in personalized packaging create niche markets within the sector. |
| 2030 | 5.9% | Investment in research and development fuels advancements in sustainable packaging technologies. |
| 2031 | 6.0% | Complex regulatory systems challenge manufacturers, incentivizing compliance-focused packaging innovations. |
| 2032 | 5.6% | Circular economy principles reshape industry standards, promoting recyclability in chemical packaging. |
Note - Market size estimations and growth projections presented in this report are based on 6Wresearch's advanced forecasting approach, validated with industry datasets as of June 2026.
South Korea Chemical Packaging Market Synopsis
The South Korea Chemical Packaging Market is projected to reach 5.5% and witness significant growth during the forecast period (2026-2032). This growth is primarily driven by the increasing demand for secure and efficient packaging solutions that ensure the safe transportation and storage of various chemicals. The burgeoning chemical industry in South Korea, alongside strict regulatory compliance requirements, is reshaping the landscape of chemical packaging, thereby presenting numerous opportunities for innovation and development.
South Korea Chemical Packaging Market Growth Drivers
The factors fueling the growth of the South Korea Chemical Packaging Market are multifaceted. Key drivers include:
- The rising consumption of industrial chemicals across various end-use sectors, including construction, automotive, and electronics, necessitates efficient packaging solutions that provide safety and integrity during transportation.
- An increase in the handling of hazardous materials has led to greater demand for packaging that complies with stringent safety and regulatory standards, essential for mitigating risks associated with chemical transportation.
- The pharmaceutical sector's growth is propelling innovations in chemical packaging, as there is a critical need for compliance with health regulations, ensuring product safety and efficacy through proper packaging materials.
- Sustainability is becoming paramount, pushing manufacturers to develop eco-friendly packaging solutions that align with global conservation efforts and reduce environmental impact.
- Advancements in technology are improving the efficiency of packaging processes, from design to logistics, allowing for enhanced supply chain management and reduced operational costs.
South Korea Chemical Packaging Market Challenges and Restraints
Despite the promising growth, the South Korea Chemical Packaging Market faces notable challenges that could restrain its expansion:
- Sustainability concerns associated with traditional packaging materials compel companies to invest in research and development for viable alternatives, impacting short-term profitability.
- Ensuring chemical compatibility during transportation requires meticulous planning, and failures can result in severe consequences, including product loss and legal liabilities.
- Strict compliance with government regulations can be resource-intensive, necessitating companies to allocate significant resources for documentation, testing, and training.
- The fluctuating costs of raw materials can impact overall pricing strategies, creating unpredictability in profit margins.
- The market is witnessing an increase in competition due to both local and international players, making differentiation imperative for sustained growth.
South Korea Chemical Packaging Market Government Investment and Initiatives
The government of South Korea has implemented several policies aimed at fostering growth and sustainability within the chemical packaging sector:
- Regulatory frameworks that govern the design, manufacturing, and distribution of chemical packaging materials have been considerably strengthened to promote safety and compliance.
- Initiatives to support sustainable packaging developments have been introduced, encouraging companies to explore eco-friendly materials and recycling technologies.
- Public funding and incentives are being provided to innovative projects aimed at developing safer and more efficient chemical packaging systems.
- Government agencies actively promote training programs to enhance workforce capabilities in handling hazardous materials and adhering to safety protocols.
- Collaborative efforts among government, industry, and academic institutions are being encouraged to drive advancements in packaging technologies and environmental compliance.
South Korea Chemical Packaging Market Latest Developments (May 2025 - June 2026)
Between May 2025 and June 2026, the South Korea Chemical Packaging Market observed several notable developments:
- An uptick in the adoption of smart packaging technologies was noted, facilitating real-time monitoring of chemical conditions and improving safety during transit.
- Sustainability initiatives gained traction, with increased investments directed towards the research and development of biodegradable packaging materials.
- The introduction of stringent safety protocols was mandated for packaging hazardous chemicals, enhancing compliance across the industry.
- Regulatory updates aimed at improving recycling rates and end-of-life management were enforced, driving companies to adapt quickly to new standards.
- Collaborative industry forums were established, providing a platform for stakeholders to discuss best practices and share innovations in chemical packaging solutions.
South Korea Chemical Packaging Market - Key Attractiveness of the Report
- 10 Years of Market Numbers
- Historical Data Starting from 2022 to 2025
- Base Year: 2025
- Forecast Data until 2032
- Key Performance Indicators Impacting the Market
- Major Upcoming Developments and Projects
Key Highlights of the Report:
- South Korea Chemical Packaging Market Outlook
- Market Size of South Korea Chemical Packaging Market, 2025
- Forecast of South Korea Chemical Packaging Market, 2032
- Historical Data and Forecast of South Korea Chemical Packaging Revenues & Volume for the Period 2022-2032F
- South Korea Chemical Packaging Market Trend Evolution
- South Korea Chemical Packaging Market Drivers and Challenges
- South Korea Chemical Packaging Price Trends
- South Korea Chemical Packaging Porter's Five Forces
- South Korea Chemical Packaging Industry Life Cycle
- Historical Data and Forecast of South Korea Chemical Packaging Market Revenues & Volume By Product Types for the Period 2022-2032F
- Historical Data and Forecast of South Korea Chemical Packaging Market Revenues & Volume By Sacks for the Period 2022-2032F
- Historical Data and Forecast of South Korea Chemical Packaging Market Revenues & Volume By Drums for the Period 2022-2032F
- Historical Data and Forecast of South Korea Chemical Packaging Market Revenues & Volume By FIBC for the Period 2022-2032F
- Historical Data and Forecast of South Korea Chemical Packaging Market Revenues & Volume By Other for the Period 2022-2032F
- Historical Data and Forecast of South Korea Chemical Packaging Market Revenues & Volume By Applications for the Period 2022-2032F
- Historical Data and Forecast of South Korea Chemical Packaging Market Revenues & Volume By Pharmaceutical Factory? for the Period 2022-2032F
- Historical Data and Forecast of South Korea Chemical Packaging Market Revenues & Volume By Laboratory for the Period 2022-2032F
- Historical Data and Forecast of South Korea Chemical Packaging Market Revenues & Volume By Chemical Plant? for the Period 2022-2032F
- Historical Data and Forecast of South Korea Chemical Packaging Market Revenues & Volume By Others for the Period 2022-2032F
- South Korea Chemical Packaging Import Export Trade Statistics
- Market Opportunity Assessment By Product Types
- Market Opportunity Assessment By Applications
- South Korea Chemical Packaging Top Companies Market Share
- South Korea Chemical Packaging Competitive Benchmarking By Technical and Operational Parameters
- South Korea Chemical Packaging Company Profiles
- South Korea Chemical Packaging Key Strategic Recommendations
Frequently Asked Questions About the Market Study (FAQs):
The growth is primarily driven by the increasing demand for industrial chemicals, stringent safety regulations, and the need for sustainable packaging solutions.
Key challenges include sustainability concerns, compliance with regulatory standards, and the high costs associated with innovative packaging development.
The government is implementing regulations to ensure safety and compliance, offering funding for sustainability projects, and promoting workforce training initiatives.
Recent developments include the adoption of smart packaging technologies, increased focus on sustainable materials, and collaborative initiatives aimed at enhancing packaging safety and efficiency.
6Wresearch actively monitors the South Korea Chemical Packaging Market and publishes its comprehensive annual report, highlighting emerging trends, growth drivers, revenue analysis, and forecast outlook. Our insights help businesses to make data-backed strategic decisions with ongoing market dynamics. Our analysts track relevent industries related to the South Korea Chemical Packaging Market, allowing our clients with actionable intelligence and reliable forecasts tailored to emerging regional needs.
Yes, we provide customisation as per your requirements. To learn more, feel free to contact us on sales@6wresearch.com
1 Executive Summary |
2 Introduction |
2.1 Key Highlights of the Report |
2.2 Report Description |
2.3 Market Scope & Segmentation |
2.4 Research Methodology |
2.5 Assumptions |
3 South Korea Chemical Packaging Market Overview |
3.1 South Korea Country Macro Economic Indicators |
3.2 South Korea Chemical Packaging Market Revenues & Volume, 2022 & 2032F |
3.3 South Korea Chemical Packaging Market - Industry Life Cycle |
3.4 South Korea Chemical Packaging Market - Porter's Five Forces |
3.5 South Korea Chemical Packaging Market Revenues & Volume Share, By Product Types, 2022 & 2032F |
3.6 South Korea Chemical Packaging Market Revenues & Volume Share, By Applications, 2022 & 2032F |
4 South Korea Chemical Packaging Market Dynamics |
4.1 Impact Analysis |
4.2 Market Drivers |
4.2.1 Increasing demand for eco-friendly and sustainable packaging solutions in the chemical industry |
4.2.2 Growth in the chemical manufacturing sector in South Korea |
4.2.3 Technological advancements leading to the development of innovative packaging materials and designs |
4.3 Market Restraints |
4.3.1 Stringent regulations and standards related to chemical packaging materials |
4.3.2 Fluctuating raw material prices impacting production costs |
4.3.3 Intense competition among packaging companies in the chemical sector |
5 South Korea Chemical Packaging Market Trends |
6 South Korea Chemical Packaging Market, By Types |
6.1 South Korea Chemical Packaging Market, By Product Types |
6.1.1 Overview and Analysis |
6.1.2 South Korea Chemical Packaging Market Revenues & Volume, By Product Types, 2022-2032F |
6.1.3 South Korea Chemical Packaging Market Revenues & Volume, By Sacks, 2022-2032F |
6.1.4 South Korea Chemical Packaging Market Revenues & Volume, By Drums, 2022-2032F |
6.1.5 South Korea Chemical Packaging Market Revenues & Volume, By FIBC, 2022-2032F |
6.1.6 South Korea Chemical Packaging Market Revenues & Volume, By Other, 2022-2032F |
6.2 South Korea Chemical Packaging Market, By Applications |
6.2.1 Overview and Analysis |
6.2.2 South Korea Chemical Packaging Market Revenues & Volume, By Pharmaceutical Factory , 2022-2032F |
6.2.3 South Korea Chemical Packaging Market Revenues & Volume, By Laboratory, 2022-2032F |
6.2.4 South Korea Chemical Packaging Market Revenues & Volume, By Chemical Plant , 2022-2032F |
6.2.5 South Korea Chemical Packaging Market Revenues & Volume, By Others, 2022-2032F |
7 South Korea Chemical Packaging Market Import-Export Trade Statistics |
7.1 South Korea Chemical Packaging Market Export to Major Countries |
7.2 South Korea Chemical Packaging Market Imports from Major Countries |
8 South Korea Chemical Packaging Market Key Performance Indicators |
8.1 Percentage increase in the adoption of recyclable or biodegradable packaging materials |
8.2 Number of new chemical manufacturing facilities established in South Korea |
8.3 Rate of investment in research and development for chemical packaging innovations |
9 South Korea Chemical Packaging Market - Opportunity Assessment |
9.1 South Korea Chemical Packaging Market Opportunity Assessment, By Product Types, 2022 & 2032F |
9.2 South Korea Chemical Packaging Market Opportunity Assessment, By Applications, 2022 & 2032F |
10 South Korea Chemical Packaging Market - Competitive Landscape |
10.1 South Korea Chemical Packaging Market Revenue Share, By Companies, 2025 |
10.2 South Korea Chemical Packaging Market Competitive Benchmarking, By Operating and Technical Parameters |
11 Company Profiles |
12 Recommendations |
13 Disclaimer |
Global Go To Market Strategy - 2030
Export potential enables firms to identify high-growth global markets with greater confidence by combining advanced trade intelligence with a structured quantitative methodology. The framework analyzes emerging demand trends and country-level import patterns while integrating macroeconomic and trade datasets such as GDP and population forecasts, bilateral import–export flows, tariff structures, elasticity differentials between developed and developing economies, geographic distance, and import demand projections. Using weighted trade values from 2020–2024 as the base period to project country-to-country export potential for 2030, these inputs are operationalized through calculated drivers such as gravity model parameters, tariff impact factors, and projected GDP per-capita growth. Through an analysis of hidden potentials, demand hotspots, and market conditions that are most favorable to success, this method enables firms to focus on target countries, maximize returns, and global expansion with data, backed by accuracy.
By factoring in the projected importer demand gap that is currently unmet and could be potential opportunity, it identifies the potential for the Exporter (Country) among 190 countries, against the general trade analysis, which identifies the biggest importer or exporter.
To discover high-growth global markets and optimize your business strategy:
Click Here
Pricing
- Single User License$ 1,995
- Department License$ 2,400
- Site License$ 3,120
- Global License$ 3,795

Leadership Perspectives from Industry Events
Search
Thought Leadership and Analyst Meet


Our Clients
6WResearch In News
- India Air Conditioner Market Set for Strong Rebound in 2026 After Weather-Led Correction and GST-Driven Recovery: 6Wresearch
- ADAS in India: How Automatic Emergency Braking, Blind Spot Detection & Driver Monitoring are Transforming Road Safety
- Doha a strategic location for EV manufacturing hub: IPA Qatar
- Demand for luxury TVs surging in the GCC, says Samsung
- Empowering Growth: The Thriving Journey of Bangladesh’s Cable Industry
- Demand for luxury TVs surging in the GCC, says Samsung
Latest Reports
- Nicaragua RPG Gaming Market (2026-2032)
- New Zealand RPG Gaming Market (2026-2032)
- Netherlands RPG Gaming Market (2026-2032)
- Nauru RPG Gaming Market (2026-2032)
- Namibia RPG Gaming Market (2026-2032)
- Mozambique RPG Gaming Market (2026-2032)
- Montenegro RPG Gaming Market (2026-2032)
- Mongolia RPG Gaming Market (2026-2032)
- Monaco RPG Gaming Market (2026-2032)
- Micronesia RPG Gaming Market (2026-2032)
Industry Events and Analyst Meet

EV India Expo 2026

HIMTEX 2026

India Refining Summit 2026

India EV Show 2026

EV tech India Expo 2026
Whitepaper
- Middle East & Africa Commercial Security Market Click here to view more.
- Middle East & Africa Fire Safety Systems & Equipment Market Click here to view more.
- GCC Drone Market Click here to view more.
- Middle East Lighting Fixture Market Click here to view more.
- GCC Physical & Perimeter Security Market Click here to view more.