Spain Corrosion Resistant Alloys Market (2026-2032) Outlook | Share, Companies, Size, Analysis, Value, Growth, Industry, Trends, Forecast & Revenue
Market Forecast By Type (Iron-based Alloys, Nickel-based Alloys, Cobalt-based Alloys, Others), By End-use (Oil & Gas, Automotive & Transportation, Aerospace & Defense, Energy & Power, Industrial, Others) And Competitive Landscape
| Product Code: ETC107553 | Publication Date: Jun 2021 | Updated Date: Mar 2026 | Product Type: Report | |
| Publisher: 6Wresearch | Author: Ravi Bhandari | No. of Pages: 70 | No. of Figures: 35 | No. of Tables: 5 |
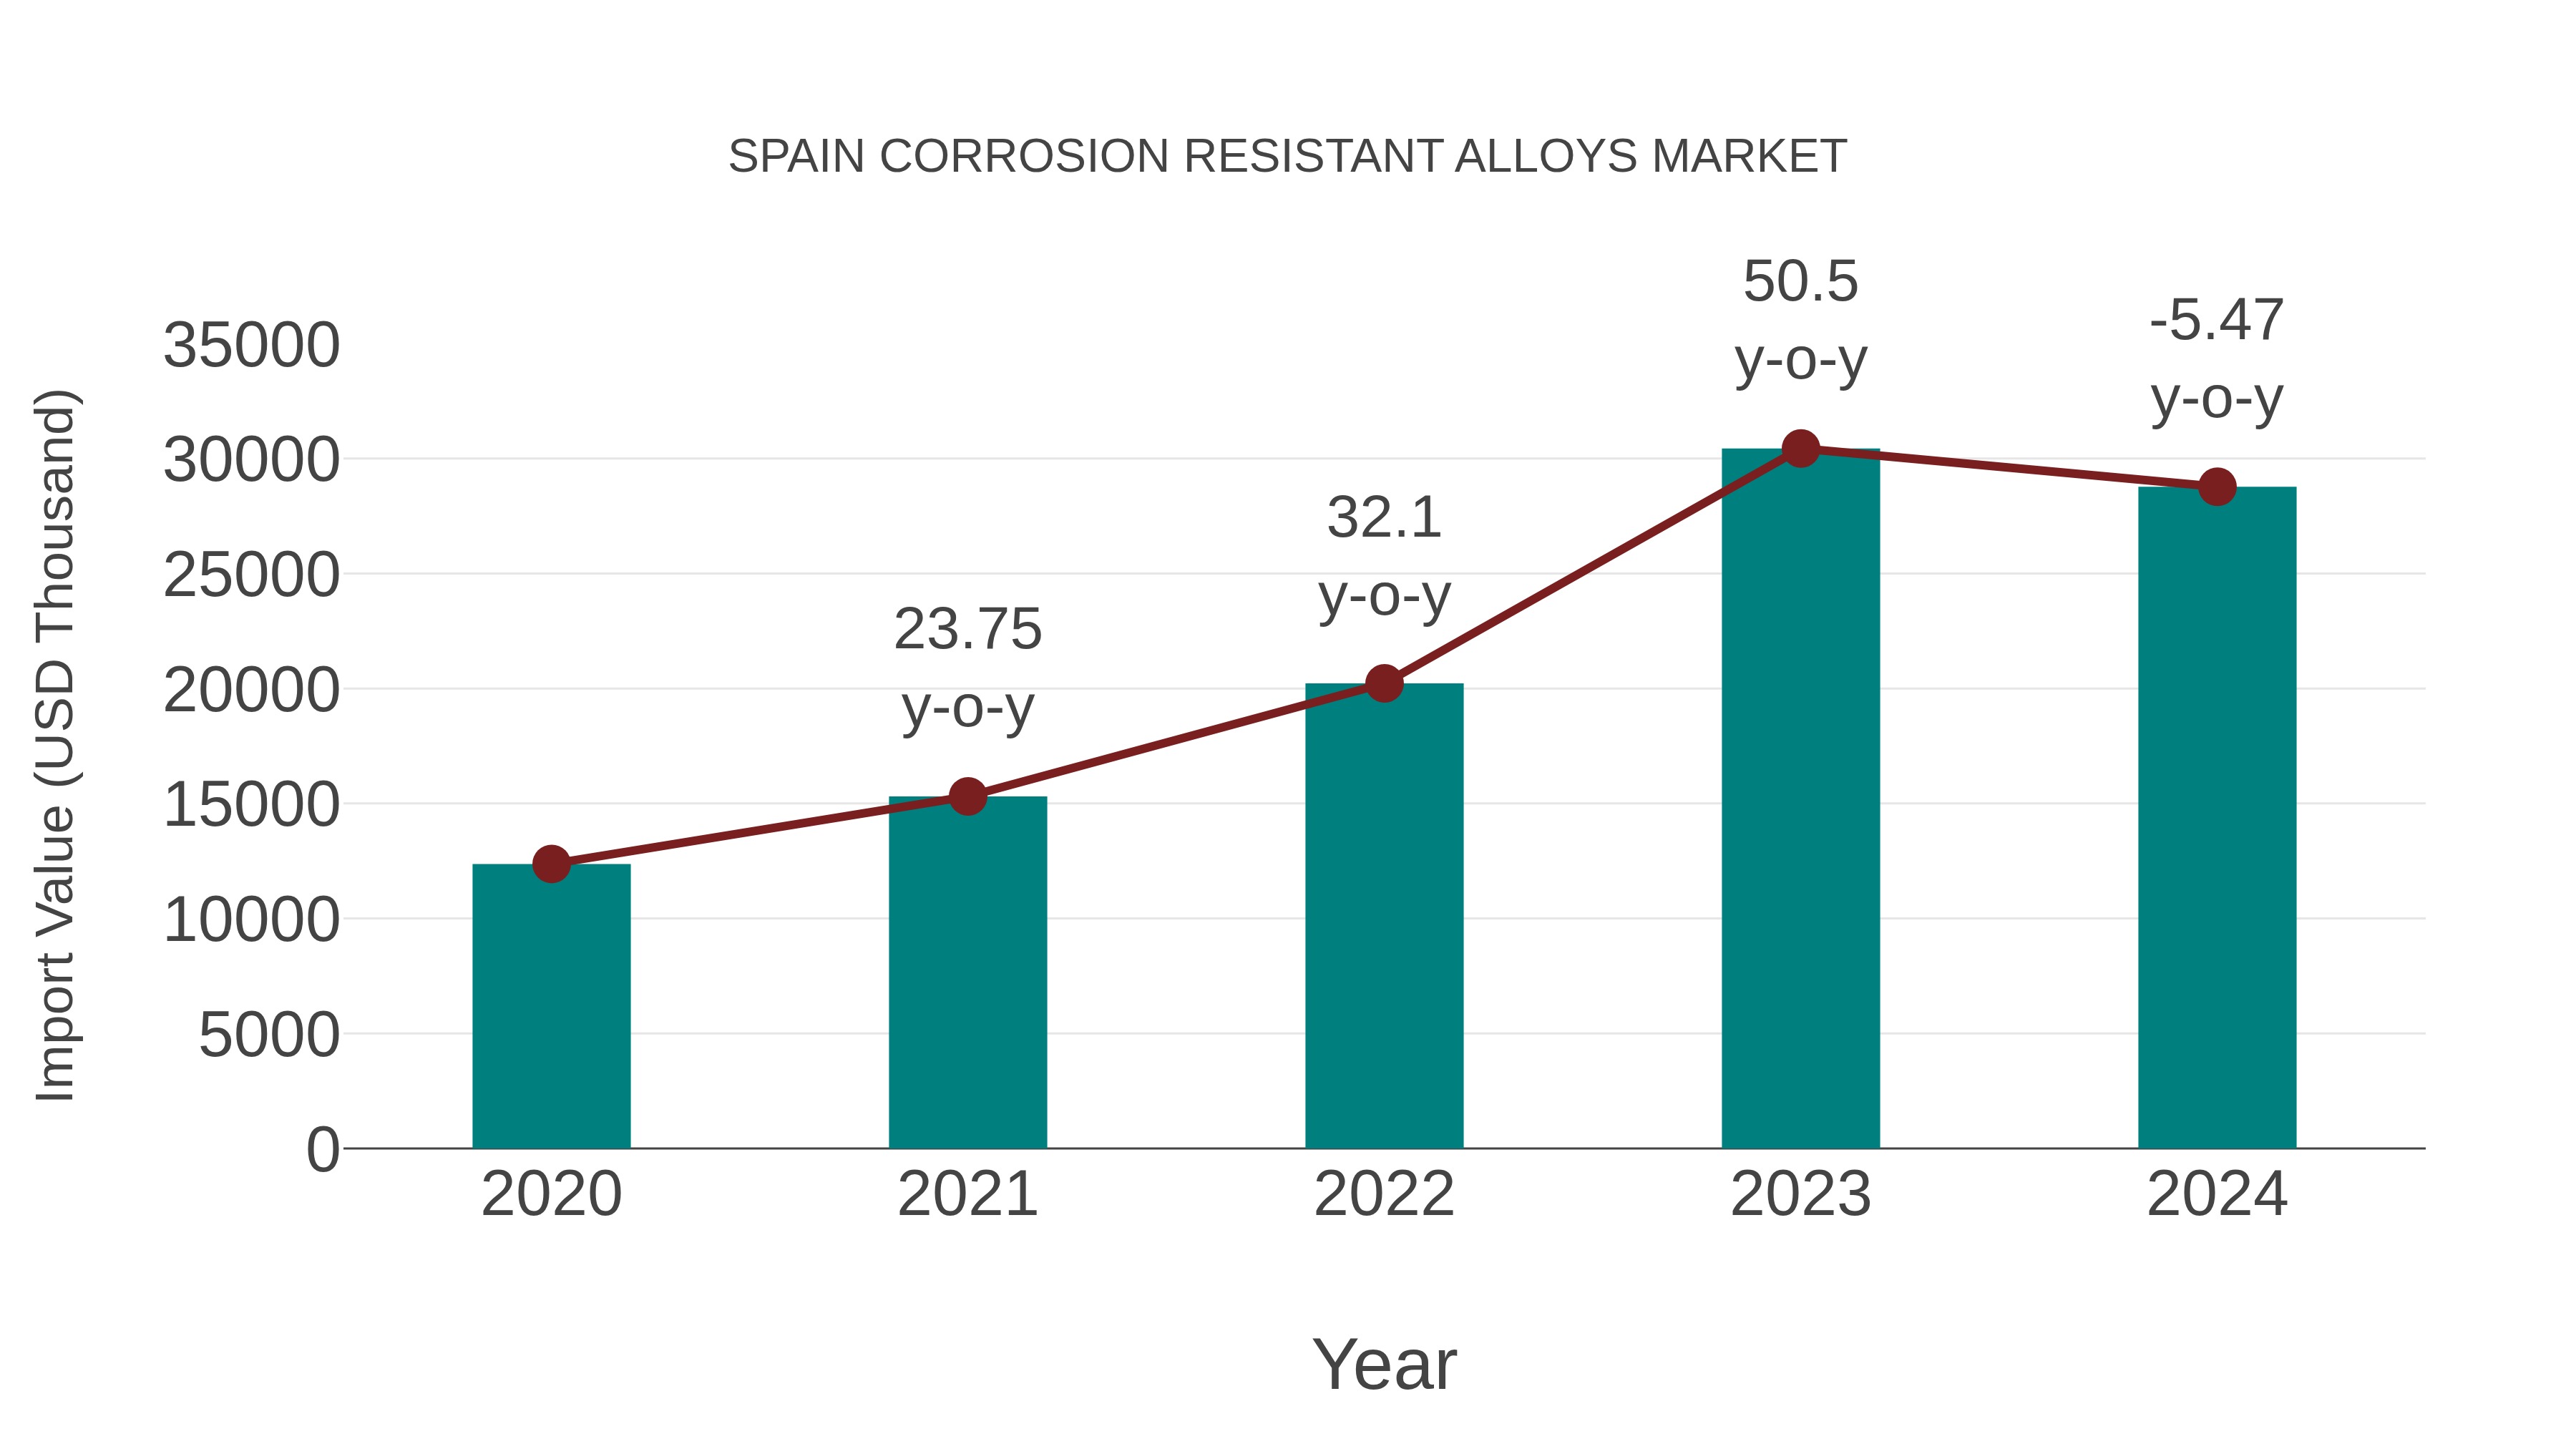
Spain Corrosion Resistant Alloys Market: Import Trend Analysis
In 2024, Spain`s import of corrosion-resistant alloys showed a steady increase, driven by demand from sectors like automotive and aerospace. The market witnessed a consistent growth in imports of these alloys, reflecting the country`s reliance on foreign suppliers for specialized materials.
Spain Corrosion Resistant Alloys Market Overview
The corrosion resistant alloys market in Spain is expanding due to increasing applications in harsh environments like marine, oil & gas, and chemical processing industries. The demand for materials that can withstand corrosion and extend equipment lifespan is driving this market.
Drivers of the market
The increasing demand for high-performance materials in industries such as chemical processing, oil & gas, and aerospace is a key driver for the corrosion-resistant alloys market in Spain. These alloys offer superior resistance to harsh environmental conditions, supporting their use in critical applications where material failure is not an option.
Challenges of the market
The Spain corrosion-resistant alloys market is challenged by the rising cost of key alloying elements such as nickel and chromium, which increases production costs. The market also faces competition from cheaper alternative materials, including coated metals and composites.
Government Policy of the market
Government policies supporting the use of corrosion-resistant alloys are part of Spains broader industrial strategy. The government promotes the use of high-performance materials in critical infrastructure projects through public procurement policies. Tax incentives for research and development in metallurgy, alongside environmental regulations on material sustainability, further support the market for corrosion-resistant alloys.
Key Highlights of the Report:
- Spain Corrosion Resistant Alloys Market Outlook
- Market Size of Spain Corrosion Resistant Alloys Market, 2025
- Forecast of Spain Corrosion Resistant Alloys Market, 2032
- Historical Data and Forecast of Spain Corrosion Resistant Alloys Revenues & Volume for the Period 2022-2032F
- Spain Corrosion Resistant Alloys Market Trend Evolution
- Spain Corrosion Resistant Alloys Market Drivers and Challenges
- Spain Corrosion Resistant Alloys Price Trends
- Spain Corrosion Resistant Alloys Porter's Five Forces
- Spain Corrosion Resistant Alloys Industry Life Cycle
- Historical Data and Forecast of Spain Corrosion Resistant Alloys Market Revenues & Volume By Type for the Period 2022-2032F
- Historical Data and Forecast of Spain Corrosion Resistant Alloys Market Revenues & Volume By Iron-based Alloys for the Period 2022-2032F
- Historical Data and Forecast of Spain Corrosion Resistant Alloys Market Revenues & Volume By Nickel-based Alloys for the Period 2022-2032F
- Historical Data and Forecast of Spain Corrosion Resistant Alloys Market Revenues & Volume By Cobalt-based Alloys for the Period 2022-2032F
- Historical Data and Forecast of Spain Corrosion Resistant Alloys Market Revenues & Volume By Others for the Period 2022-2032F
- Historical Data and Forecast of Spain Corrosion Resistant Alloys Market Revenues & Volume By End-use for the Period 2022-2032F
- Historical Data and Forecast of Spain Corrosion Resistant Alloys Market Revenues & Volume By Oil & Gas for the Period 2022-2032F
- Historical Data and Forecast of Spain Corrosion Resistant Alloys Market Revenues & Volume By Automotive & Transportation for the Period 2022-2032F
- Historical Data and Forecast of Spain Corrosion Resistant Alloys Market Revenues & Volume By Aerospace & Defense for the Period 2022-2032F
- Historical Data and Forecast of Spain Corrosion Resistant Alloys Market Revenues & Volume By Energy & Power for the Period 2022-2032F
- Historical Data and Forecast of Spain Corrosion Resistant Alloys Market Revenues & Volume By Industrial for the Period 2022-2032F
- Historical Data and Forecast of Spain Corrosion Resistant Alloys Market Revenues & Volume By Others for the Period 2022-2032F
- Spain Corrosion Resistant Alloys Import Export Trade Statistics
- Market Opportunity Assessment By Type
- Market Opportunity Assessment By End-use
- Spain Corrosion Resistant Alloys Top Companies Market Share
- Spain Corrosion Resistant Alloys Competitive Benchmarking By Technical and Operational Parameters
- Spain Corrosion Resistant Alloys Company Profiles
- Spain Corrosion Resistant Alloys Key Strategic Recommendations
Spain Corrosion Resistant Alloys Market (2026-2032): FAQs
6Wresearch actively monitors the Spain Corrosion Resistant Alloys Market and publishes its comprehensive annual report, highlighting emerging trends, growth drivers, revenue analysis, and forecast outlook. Our insights help businesses to make data-backed strategic decisions with ongoing market dynamics. Our analysts track relevent industries related to the Spain Corrosion Resistant Alloys Market, allowing our clients with actionable intelligence and reliable forecasts tailored to emerging regional needs.
Yes, we provide customisation as per your requirements. To learn more, feel free to contact us on sales@6wresearch.com
1 Executive Summary |
2 Introduction |
2.1 Key Highlights of the Report |
2.2 Report Description |
2.3 Market Scope & Segmentation |
2.4 Research Methodology |
2.5 Assumptions |
3 Spain Corrosion Resistant Alloys Market Overview |
3.1 Spain Country Macro Economic Indicators |
3.2 Spain Corrosion Resistant Alloys Market Revenues & Volume, 2022 & 2032F |
3.3 Spain Corrosion Resistant Alloys Market - Industry Life Cycle |
3.4 Spain Corrosion Resistant Alloys Market - Porter's Five Forces |
3.5 Spain Corrosion Resistant Alloys Market Revenues & Volume Share, By Type, 2022 & 2032F |
3.6 Spain Corrosion Resistant Alloys Market Revenues & Volume Share, By End-use, 2022 & 2032F |
4 Spain Corrosion Resistant Alloys Market Dynamics |
4.1 Impact Analysis |
4.2 Market Drivers |
4.2.1 Increasing demand from industries such as automotive, aerospace, and construction for corrosion resistant alloys. |
4.2.2 Stringent regulations promoting the use of corrosion resistant materials in Spain. |
4.2.3 Growing focus on infrastructure development and maintenance projects driving the need for corrosion resistant alloys. |
4.3 Market Restraints |
4.3.1 Fluctuating raw material prices impacting the overall cost of corrosion resistant alloys. |
4.3.2 Technological limitations in developing advanced corrosion resistant alloys. |
4.3.3 Competition from substitute materials posing a challenge to the corrosion resistant alloys market in Spain. |
5 Spain Corrosion Resistant Alloys Market Trends |
6 Spain Corrosion Resistant Alloys Market, By Types |
6.1 Spain Corrosion Resistant Alloys Market, By Type |
6.1.1 Overview and Analysis |
6.1.2 Spain Corrosion Resistant Alloys Market Revenues & Volume, By Type, 2022-2032F |
6.1.3 Spain Corrosion Resistant Alloys Market Revenues & Volume, By Iron-based Alloys, 2022-2032F |
6.1.4 Spain Corrosion Resistant Alloys Market Revenues & Volume, By Nickel-based Alloys, 2022-2032F |
6.1.5 Spain Corrosion Resistant Alloys Market Revenues & Volume, By Cobalt-based Alloys, 2022-2032F |
6.1.6 Spain Corrosion Resistant Alloys Market Revenues & Volume, By Others, 2022-2032F |
6.2 Spain Corrosion Resistant Alloys Market, By End-use |
6.2.1 Overview and Analysis |
6.2.2 Spain Corrosion Resistant Alloys Market Revenues & Volume, By Oil & Gas, 2022-2032F |
6.2.3 Spain Corrosion Resistant Alloys Market Revenues & Volume, By Automotive & Transportation, 2022-2032F |
6.2.4 Spain Corrosion Resistant Alloys Market Revenues & Volume, By Aerospace & Defense, 2022-2032F |
6.2.5 Spain Corrosion Resistant Alloys Market Revenues & Volume, By Energy & Power, 2022-2032F |
6.2.6 Spain Corrosion Resistant Alloys Market Revenues & Volume, By Industrial, 2022-2032F |
6.2.7 Spain Corrosion Resistant Alloys Market Revenues & Volume, By Others, 2022-2032F |
7 Spain Corrosion Resistant Alloys Market Import-Export Trade Statistics |
7.1 Spain Corrosion Resistant Alloys Market Export to Major Countries |
7.2 Spain Corrosion Resistant Alloys Market Imports from Major Countries |
8 Spain Corrosion Resistant Alloys Market Key Performance Indicators |
8.1 Research and development investment in corrosion resistant alloy technologies. |
8.2 Number of infrastructure projects utilizing corrosion resistant alloys. |
8.3 Adoption rate of corrosion resistant alloys in key industries in Spain. |
9 Spain Corrosion Resistant Alloys Market - Opportunity Assessment |
9.1 Spain Corrosion Resistant Alloys Market Opportunity Assessment, By Type, 2022 & 2032F |
9.2 Spain Corrosion Resistant Alloys Market Opportunity Assessment, By End-use, 2022 & 2032F |
10 Spain Corrosion Resistant Alloys Market - Competitive Landscape |
10.1 Spain Corrosion Resistant Alloys Market Revenue Share, By Companies, 2025 |
10.2 Spain Corrosion Resistant Alloys Market Competitive Benchmarking, By Operating and Technical Parameters |
11 Company Profiles |
12 Recommendations |
13 Disclaimer |
Global Go To Market Strategy - 2030
Export potential enables firms to identify high-growth global markets with greater confidence by combining advanced trade intelligence with a structured quantitative methodology. The framework analyzes emerging demand trends and country-level import patterns while integrating macroeconomic and trade datasets such as GDP and population forecasts, bilateral import–export flows, tariff structures, elasticity differentials between developed and developing economies, geographic distance, and import demand projections. Using weighted trade values from 2020–2024 as the base period to project country-to-country export potential for 2030, these inputs are operationalized through calculated drivers such as gravity model parameters, tariff impact factors, and projected GDP per-capita growth. Through an analysis of hidden potentials, demand hotspots, and market conditions that are most favorable to success, this method enables firms to focus on target countries, maximize returns, and global expansion with data, backed by accuracy.
By factoring in the projected importer demand gap that is currently unmet and could be potential opportunity, it identifies the potential for the Exporter (Country) among 190 countries, against the general trade analysis, which identifies the biggest importer or exporter.
To discover high-growth global markets and optimize your business strategy:
Click Here
Pricing
- Single User License$ 1,995
- Department License$ 2,400
- Site License$ 3,120
- Global License$ 3,795

Leadership Perspectives from Industry Events
Search
Thought Leadership and Analyst Meet


Our Clients
6WResearch In News
- India Air Conditioner Market Set for Strong Rebound in 2026 After Weather-Led Correction and GST-Driven Recovery: 6Wresearch
- ADAS in India: How Automatic Emergency Braking, Blind Spot Detection & Driver Monitoring are Transforming Road Safety
- Doha a strategic location for EV manufacturing hub: IPA Qatar
- Demand for luxury TVs surging in the GCC, says Samsung
- Empowering Growth: The Thriving Journey of Bangladesh’s Cable Industry
- Demand for luxury TVs surging in the GCC, says Samsung
Latest Reports
- Nicaragua RPG Gaming Market (2026-2032)
- New Zealand RPG Gaming Market (2026-2032)
- Netherlands RPG Gaming Market (2026-2032)
- Nauru RPG Gaming Market (2026-2032)
- Namibia RPG Gaming Market (2026-2032)
- Mozambique RPG Gaming Market (2026-2032)
- Montenegro RPG Gaming Market (2026-2032)
- Mongolia RPG Gaming Market (2026-2032)
- Monaco RPG Gaming Market (2026-2032)
- Micronesia RPG Gaming Market (2026-2032)
Industry Events and Analyst Meet

EV India Expo 2026

HIMTEX 2026

India Refining Summit 2026

India EV Show 2026

EV tech India Expo 2026
Whitepaper
- Middle East & Africa Commercial Security Market Click here to view more.
- Middle East & Africa Fire Safety Systems & Equipment Market Click here to view more.
- GCC Drone Market Click here to view more.
- Middle East Lighting Fixture Market Click here to view more.
- GCC Physical & Perimeter Security Market Click here to view more.