Sri Lanka Aniline Derivatives Market (2026-2032) Outlook | Size, Companies, Growth, Analysis, Industry, Value, Forecast, Share, Revenue, Trends
Market Forecast By Derivative (N-Methyl Aniline (NMA), N,N-Dimethyl Aniline (DMA), N-Ethyl Aniline (NEA), N,N-Diethyl Aniline (DEA)), By Application (Drug Production, Polyurethane, Agrochemicals, Dyes & Pigments, Rubber Processing, Varnishes, Explosives, Others), By End Use (Pharmaceutical, Plastic, Agriculture, Textile, Rubber, Paints & Inks, Others) And Competitive Landscape
| Product Code: ETC312331 | Publication Date: Aug 2022 | Updated Date: Jul 2026 | Product Type: Market Research Report | |
| Publisher: 6Wresearch | Author: Sumit Sagar | No. of Pages: 75 | No. of Figures: 35 | No. of Tables: 20 |
Sri Lanka Aniline Derivatives Market Size, Share & Growth Rate
The Sri Lanka Aniline Derivatives Market was estimated at USD 1379 Million in 2025 and is projected to reach USD 1979 Million by 2032, growing at a CAGR of 5.3% from 2026 to 2032. This growth trajectory is primarily fueled by robust demand across key industries, such as agriculture and pharmaceuticals, which are increasingly reliant on aniline derivatives for various applications, including agrochemicals and pharmaceutical intermediates. Moreover, the ongoing expansion of domestic manufacturing capabilities is anticipated to further support this upward trend.
Sri Lanka Aniline Derivatives Market Year-wise Growth Rate and Key Drivers
This graph highlights how the Sri Lanka Aniline Derivatives Market has steadily grown over the years, supported by major growth factors.
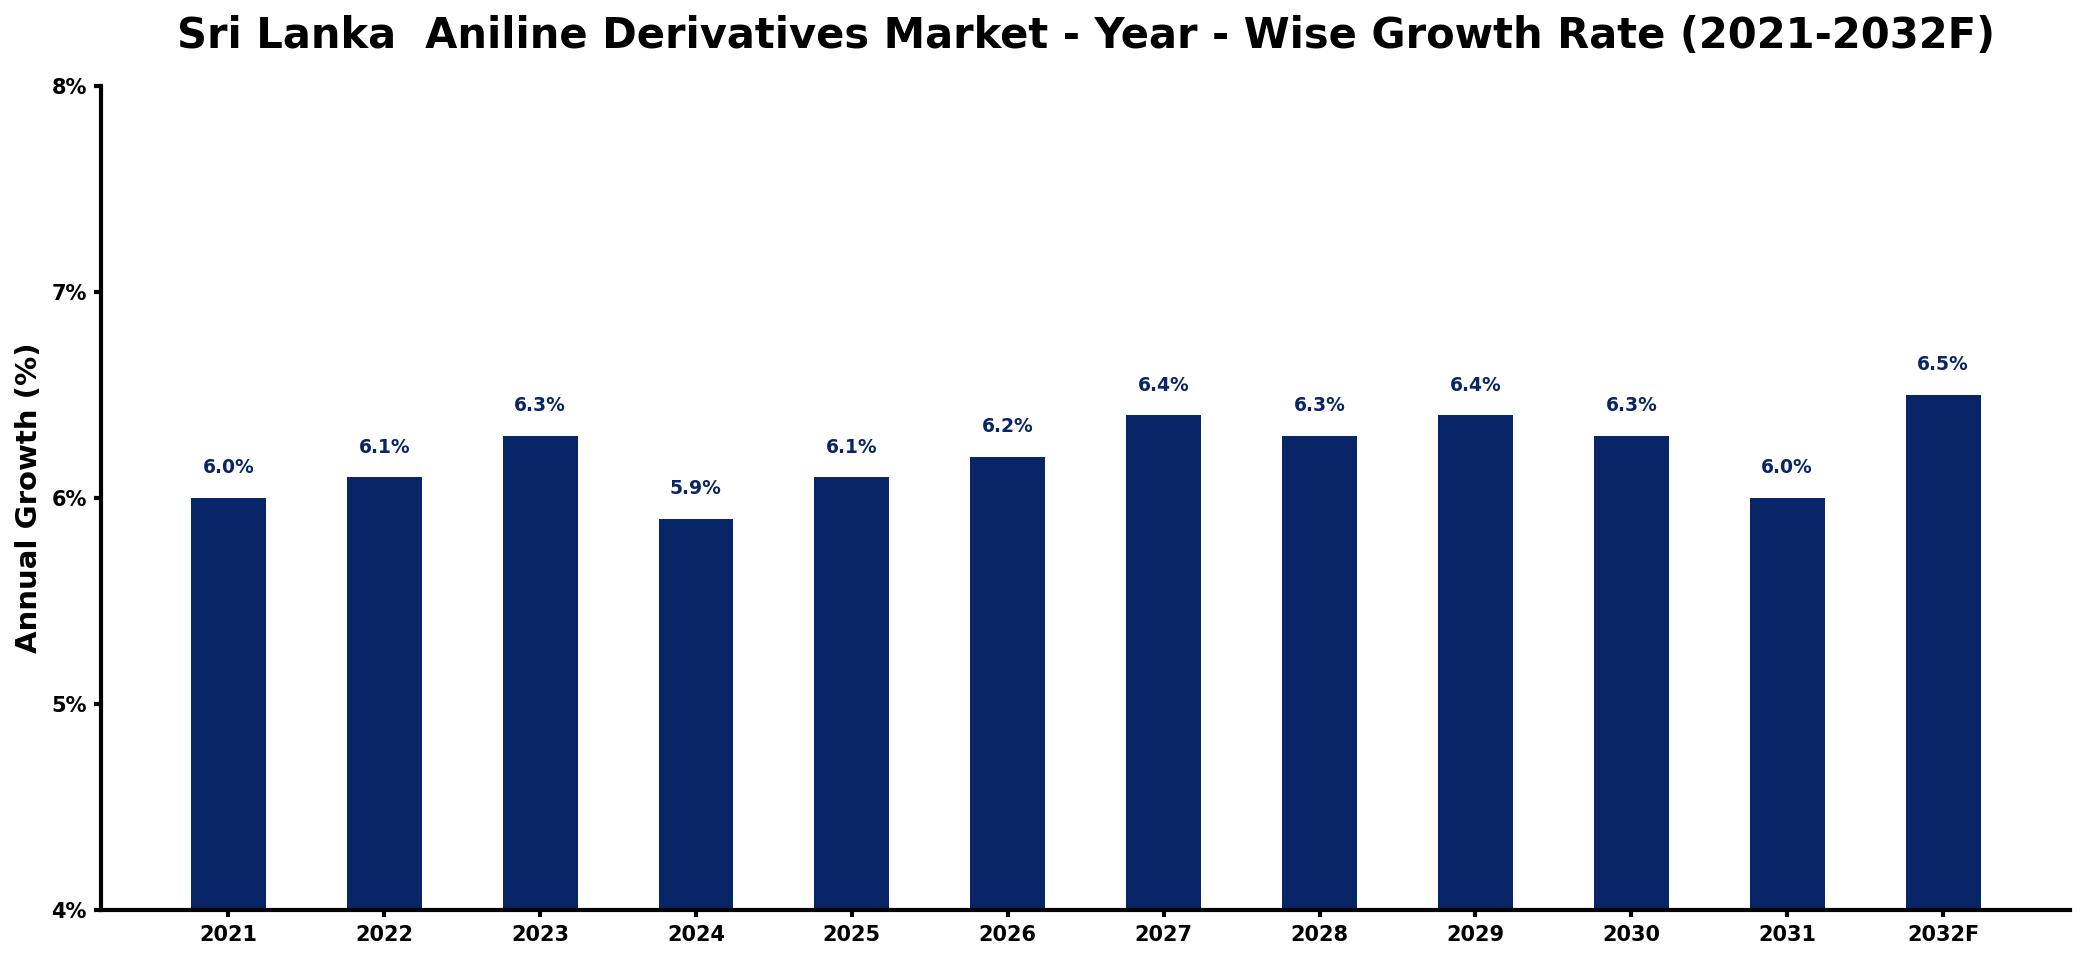
The table below presents the year‑wise growth rates along with the key drivers influencing the market
| Year | Growth Rate | Major Drivers |
| 2021 | 6.0% | Rising demand in textile industry |
| 2022 | 6.1% | Increased investments in chemical manufacturing |
| 2023 | 6.3% | Expansion of pharmaceutical applications |
| 2024 | 5.9% | Growth in agrochemical sector utilization |
| 2025 | 6.1% | Surge in automotive industry requirements |
| 2026 | 6.2% | Development of sustainable production methods |
| 2027 | 6.4% | Emerging markets driving consumption patterns |
| 2028 | 6.3% | Technological advancements in production processes |
| 2029 | 6.4% | Increased focus on environmental regulations |
| 2030 | 6.3% | increased domestic production output |
| 2031 | 6.0% | Rising consumer preferences for quality |
| 2032 | 6.5% | improved processing technologies adoption |
Note: Market size estimations and growth projections presented in this report are based on 6Wresearch's proprietary forecasting methodology, utilizing the latest available industry data, government publications, and primary research inputs.
Sri Lanka Aniline Derivatives Market Synopsis
The Sri Lanka Aniline Derivatives Market is witnessing a significant transformation, driven by rising industrial activity and growing needs from sectors like textiles and agriculture. Aniline derivatives play a crucial role in producing dyes, pigments, and essential agrochemicals, making them integral to the country's manufacturing landscape.
Current government initiatives aimed at bolstering local production and reducing dependency on imports are also catalyzing growth in this sector. These measures, combined with a robust pipeline of infrastructure projects, have established a conducive environment for investment and innovation, positioning Sri Lanka as a pivotal player in the aniline derivatives landscape.
Sri Lanka Aniline Derivatives Market Key Takeaways
- The market is projected to grow significantly, driven by increasing demand in pharmaceuticals and agrochemicals.
- Government initiatives are fostering local production and attracting foreign investments in the chemical sector.
- There is a notable shift towards sustainable and eco-friendly aniline derivatives.
- Competition from international suppliers is posing challenges for local manufacturers, emphasizing the need for operational efficiencies.
- Investment opportunities abound in production facilities and R&D for innovative applications of aniline derivatives.
Evaluation of Restraints in Sri Lanka Aniline Derivatives Market
Despite its growth potential, the Sri Lanka Aniline Derivatives Market faces several restraints. A significant challenge is the limited domestic production capacity, which forces local industries to rely heavily on imported aniline derivatives. This reliance exposes the market to global supply chain disruptions and raw material price volatility, which can substantially affect profitability. Moreover, stringent environmental regulations and competition from well-established international players add further pressure, necessitating strategic investments and operational improvements from domestic producers to maintain competitiveness.
Sri Lanka Aniline Derivatives Market Trends
The market is increasingly leaning toward sustainability, with a growing emphasis on bio-based aniline derivatives. Companies are investing in research and development to create innovative products that align with eco-friendly practices. Moreover, the textile and leather industries are evolving, with heightened demand for high-quality dyes and pigments, promoting the growth of specialized aniline derivatives. This trend reflects broader shifts toward sustainable practices, with consumers and industries alike prioritizing environmentally responsible products.
Sri Lanka Aniline Derivatives Market Opportunities
As the demand for aniline derivatives escalates, numerous investment opportunities arise within the Sri Lankan market. One of the most promising avenues includes establishing manufacturing facilities that can cater to the increasing domestic demand, particularly in pharmaceuticals and agriculture. Additionally, enhancing distribution networks to ensure timely availability of products and focusing on R&D for sustainable aniline derivatives can provide a competitive edge. Given the supportive governmental policies aimed at industrial growth, the landscape for investors is becoming increasingly favorable.
Government Initiatives in the Sri Lanka Aniline Derivatives Market
The Sri Lankan government has put forth various initiatives to foster sustainable growth in the Aniline Derivatives Market. These include establishing stringent quality standards for production to ensure consumer safety, alongside incentives aimed at encouraging companies to adopt environmentally friendly manufacturing processes. Furthermore, regulations surrounding the import and export of aniline derivatives are being enhanced to promote local manufacturing and minimize environmental impacts, thus ensuring a balanced approach to economic development and ecological sustainability.
Future Insights of the Sri Lanka Aniline Derivatives Market
Looking ahead, the Sri Lanka Aniline Derivatives Market is expected to maintain its growth momentum from 2026 to 2032. Factors such as urbanization, population growth, and increasing disposable income will likely drive demand for aniline derivatives across various applications. Furthermore, the government's commitment to infrastructure development will further stimulate industrial growth, providing a solid foundation for market expansion. However, stakeholders must remain vigilant about regulatory changes and market dynamics to capitalize on emerging opportunities effectively.
Sri Lanka Aniline Derivatives Market Latest Developments (2025 - 2026)
Recent developments in the Sri Lanka Aniline Derivatives Market indicate a focused effort toward enhancing production capabilities and sustainable practices. Industry stakeholders are prioritizing the adoption of greener technologies and expanding research efforts to align with global sustainability trends. Additionally, partnerships aimed at strengthening supply chains and improving distribution networks are emerging as essential strategies for local manufacturers to better compete with international suppliers.
Sri Lanka Aniline Derivatives Market - Key Attractiveness of the Report
- 10 Years of Market Numbers
- Historical Data Starting from 2022 to 2025
- Base Year: 2025
- Forecast Data until 2032
- Key Performance Indicators Impacting the Market
- Major Upcoming Developments and Projects
Key Highlights of the Report:
- Sri Lanka Aniline Derivatives Market Outlook
- Market Size of Sri Lanka Aniline Derivatives Market, 2025
- Forecast of Sri Lanka Aniline Derivatives Market, 2032
- Historical Data and Forecast of Sri Lanka Aniline Derivatives Revenues & Volume for the Period 2022-2032F
- Sri Lanka Aniline Derivatives Market Trend Evolution
- Sri Lanka Aniline Derivatives Market Drivers and Challenges
- Sri Lanka Aniline Derivatives Price Trends
- Sri Lanka Aniline Derivatives Porter's Five Forces
- Sri Lanka Aniline Derivatives Industry Life Cycle
- Historical Data and Forecast of Sri Lanka Aniline Derivatives Market Revenues & Volume By Derivative for the Period 2022-2032F
- Historical Data and Forecast of Sri Lanka Aniline Derivatives Market Revenues & Volume By N-Methyl Aniline (NMA) for the Period 2022-2032F
- Historical Data and Forecast of Sri Lanka Aniline Derivatives Market Revenues & Volume By N,N-Dimethyl Aniline (DMA) for the Period 2022-2032F
- Historical Data and Forecast of Sri Lanka Aniline Derivatives Market Revenues & Volume By N-Ethyl Aniline (NEA) for the Period 2022-2032F
- Historical Data and Forecast of Sri Lanka Aniline Derivatives Market Revenues & Volume By N,N-Diethyl Aniline (DEA) for the Period 2022-2032F
- Historical Data and Forecast of Sri Lanka Aniline Derivatives Market Revenues & Volume By Application for the Period 2022-2032F
- Historical Data and Forecast of Sri Lanka Aniline Derivatives Market Revenues & Volume By Drug Production for the Period 2022-2032F
- Historical Data and Forecast of Sri Lanka Aniline Derivatives Market Revenues & Volume By Polyurethane for the Period 2022-2032F
- Historical Data and Forecast of Sri Lanka Aniline Derivatives Market Revenues & Volume By Agrochemicals for the Period 2022-2032F
- Historical Data and Forecast of Sri Lanka Aniline Derivatives Market Revenues & Volume By Dyes & Pigments for the Period 2022-2032F
- Historical Data and Forecast of Sri Lanka Aniline Derivatives Market Revenues & Volume By Rubber Processing for the Period 2022-2032F
- Historical Data and Forecast of Sri Lanka Aniline Derivatives Market Revenues & Volume By Varnishes for the Period 2022-2032F
- Historical Data and Forecast of Sri Lanka Aniline Derivatives Market Revenues & Volume By Explosives for the Period 2022-2032F
- Historical Data and Forecast of Sri Lanka Aniline Derivatives Market Revenues & Volume By Others for the Period 2022-2032F
- Historical Data and Forecast of Sri Lanka Aniline Derivatives Market Revenues & Volume By End Use for the Period 2022-2032F
- Historical Data and Forecast of Sri Lanka Aniline Derivatives Market Revenues & Volume By Pharmaceutical for the Period 2022-2032F
- Historical Data and Forecast of Sri Lanka Aniline Derivatives Market Revenues & Volume By Plastic for the Period 2022-2032F
- Historical Data and Forecast of Sri Lanka Aniline Derivatives Market Revenues & Volume By Agriculture for the Period 2022-2032F
- Historical Data and Forecast of Sri Lanka Aniline Derivatives Market Revenues & Volume By Textile for the Period 2022-2032F
- Historical Data and Forecast of Sri Lanka Aniline Derivatives Market Revenues & Volume By Rubber for the Period 2022-2032F
- Historical Data and Forecast of Sri Lanka Aniline Derivatives Market Revenues & Volume By Paints & Inks for the Period 2022-2032F
- Historical Data and Forecast of Sri Lanka Aniline Derivatives Market Revenues & Volume By Others for the Period 2022-2032F
- Sri Lanka Aniline Derivatives Import Export Trade Statistics
- Market Opportunity Assessment By Derivative
- Market Opportunity Assessment By Application
- Market Opportunity Assessment By End Use
- Sri Lanka Aniline Derivatives Top Companies Market Share
- Sri Lanka Aniline Derivatives Competitive Benchmarking By Technical and Operational Parameters
- Sri Lanka Aniline Derivatives Company Profiles
- Sri Lanka Aniline Derivatives Key Strategic Recommendations
Frequently Asked Questions About the Market Study (FAQs):
The growth is largely driven by increasing demand in the agriculture and pharmaceuticals sectors, where aniline derivatives are essential for producing agrochemicals and pharmaceutical intermediates.
The Sri Lanka Aniline Derivatives Market was estimated at USD 1379 Million in 2025 and is projected to reach USD 1979 Million by 2032, growing at a CAGR of 5.3% from 2026 to 2032.
The largest consumers include the agriculture sector for agrochemicals and the textile industry for dyes and pigments, with the pharmaceutical industry also becoming a significant user.
Investors can explore opportunities in establishing production facilities, developing distribution networks, and focusing on R&D for innovative and sustainable aniline derivatives.
The government is implementing policies that promote local production, establish quality standards, and incentivize eco-friendly manufacturing practices, all of which support the growth of the aniline derivatives industry.
6Wresearch actively monitors the Sri Lanka Aniline Derivatives Market and publishes its comprehensive annual report, highlighting emerging trends, growth drivers, revenue analysis, and forecast outlook. Our insights help businesses to make data-backed strategic decisions with ongoing market dynamics. Our analysts track relevent industries related to the Sri Lanka Aniline Derivatives Market, allowing our clients with actionable intelligence and reliable forecasts tailored to emerging regional needs.
Yes, we provide customisation as per your requirements. To learn more, feel free to contact us on sales@6wresearch.com
1 Executive Summary |
2 Introduction |
2.1 Key Highlights of the Report |
2.2 Report Description |
2.3 Market Scope & Segmentation |
2.4 Research Methodology |
2.5 Assumptions |
3 Sri Lanka Aniline Derivatives Market Overview |
3.1 Sri Lanka Country Macro Economic Indicators |
3.2 Sri Lanka Aniline Derivatives Market Revenues & Volume, 2022 & 2032F |
3.3 Sri Lanka Aniline Derivatives Market - Industry Life Cycle |
3.4 Sri Lanka Aniline Derivatives Market - Porter's Five Forces |
3.5 Sri Lanka Aniline Derivatives Market Revenues & Volume Share, By Derivative, 2022 & 2032F |
3.6 Sri Lanka Aniline Derivatives Market Revenues & Volume Share, By Application, 2022 & 2032F |
3.7 Sri Lanka Aniline Derivatives Market Revenues & Volume Share, By End Use, 2022 & 2032F |
4 Sri Lanka Aniline Derivatives Market Dynamics |
4.1 Impact Analysis |
4.2 Market Drivers |
4.2.1 Growing demand for aniline derivatives in various industries such as pharmaceuticals, agriculture, and manufacturing. |
4.2.2 Increasing investments in research and development for innovative aniline derivative products. |
4.2.3 Favorable government policies and regulations supporting the growth of the aniline derivatives market in Sri Lanka. |
4.3 Market Restraints |
4.3.1 Fluctuating prices of raw materials used in the manufacturing of aniline derivatives. |
4.3.2 Environmental concerns and regulations related to the production and disposal of aniline derivatives. |
4.3.3 Intense competition from international players in the aniline derivatives market. |
5 Sri Lanka Aniline Derivatives Market Trends |
6 Sri Lanka Aniline Derivatives Market, By Types |
6.1 Sri Lanka Aniline Derivatives Market, By Derivative |
6.1.1 Overview and Analysis |
6.1.2 Sri Lanka Aniline Derivatives Market Revenues & Volume, By Derivative, 2022-2032F |
6.1.3 Sri Lanka Aniline Derivatives Market Revenues & Volume, By N-Methyl Aniline (NMA), 2022-2032F |
6.1.4 Sri Lanka Aniline Derivatives Market Revenues & Volume, By N,N-Dimethyl Aniline (DMA), 2022-2032F |
6.1.5 Sri Lanka Aniline Derivatives Market Revenues & Volume, By N-Ethyl Aniline (NEA), 2022-2032F |
6.1.6 Sri Lanka Aniline Derivatives Market Revenues & Volume, By N,N-Diethyl Aniline (DEA), 2022-2032F |
6.2 Sri Lanka Aniline Derivatives Market, By Application |
6.2.1 Overview and Analysis |
6.2.2 Sri Lanka Aniline Derivatives Market Revenues & Volume, By Drug Production, 2022-2032F |
6.2.3 Sri Lanka Aniline Derivatives Market Revenues & Volume, By Polyurethane, 2022-2032F |
6.2.4 Sri Lanka Aniline Derivatives Market Revenues & Volume, By Agrochemicals, 2022-2032F |
6.2.5 Sri Lanka Aniline Derivatives Market Revenues & Volume, By Dyes & Pigments, 2022-2032F |
6.2.6 Sri Lanka Aniline Derivatives Market Revenues & Volume, By Rubber Processing, 2022-2032F |
6.2.7 Sri Lanka Aniline Derivatives Market Revenues & Volume, By Varnishes, 2022-2032F |
6.2.8 Sri Lanka Aniline Derivatives Market Revenues & Volume, By Others, 2022-2032F |
6.2.9 Sri Lanka Aniline Derivatives Market Revenues & Volume, By Others, 2022-2032F |
6.3 Sri Lanka Aniline Derivatives Market, By End Use |
6.3.1 Overview and Analysis |
6.3.2 Sri Lanka Aniline Derivatives Market Revenues & Volume, By Pharmaceutical, 2022-2032F |
6.3.3 Sri Lanka Aniline Derivatives Market Revenues & Volume, By Plastic, 2022-2032F |
6.3.4 Sri Lanka Aniline Derivatives Market Revenues & Volume, By Agriculture, 2022-2032F |
6.3.5 Sri Lanka Aniline Derivatives Market Revenues & Volume, By Textile, 2022-2032F |
6.3.6 Sri Lanka Aniline Derivatives Market Revenues & Volume, By Rubber, 2022-2032F |
6.3.7 Sri Lanka Aniline Derivatives Market Revenues & Volume, By Paints & Inks, 2022-2032F |
7 Sri Lanka Aniline Derivatives Market Import-Export Trade Statistics |
7.1 Sri Lanka Aniline Derivatives Market Export to Major Countries |
7.2 Sri Lanka Aniline Derivatives Market Imports from Major Countries |
8 Sri Lanka Aniline Derivatives Market Key Performance Indicators |
8.1 Research and development expenditure on new aniline derivative products. |
8.2 Number of patents filed for aniline derivative formulations. |
8.3 Compliance with environmental regulations and sustainability practices in aniline derivative production. |
9 Sri Lanka Aniline Derivatives Market - Opportunity Assessment |
9.1 Sri Lanka Aniline Derivatives Market Opportunity Assessment, By Derivative, 2022 & 2032F |
9.2 Sri Lanka Aniline Derivatives Market Opportunity Assessment, By Application, 2022 & 2032F |
9.3 Sri Lanka Aniline Derivatives Market Opportunity Assessment, By End Use, 2022 & 2032F |
10 Sri Lanka Aniline Derivatives Market - Competitive Landscape |
10.1 Sri Lanka Aniline Derivatives Market Revenue Share, By Companies, 2025 |
10.2 Sri Lanka Aniline Derivatives Market Competitive Benchmarking, By Operating and Technical Parameters |
11 Company Profiles |
12 Recommendations |
13 Disclaimer |
Global Go To Market Strategy - 2030
Export potential enables firms to identify high-growth global markets with greater confidence by combining advanced trade intelligence with a structured quantitative methodology. The framework analyzes emerging demand trends and country-level import patterns while integrating macroeconomic and trade datasets such as GDP and population forecasts, bilateral import–export flows, tariff structures, elasticity differentials between developed and developing economies, geographic distance, and import demand projections. Using weighted trade values from 2020–2024 as the base period to project country-to-country export potential for 2030, these inputs are operationalized through calculated drivers such as gravity model parameters, tariff impact factors, and projected GDP per-capita growth. Through an analysis of hidden potentials, demand hotspots, and market conditions that are most favorable to success, this method enables firms to focus on target countries, maximize returns, and global expansion with data, backed by accuracy.
By factoring in the projected importer demand gap that is currently unmet and could be potential opportunity, it identifies the potential for the Exporter (Country) among 190 countries, against the general trade analysis, which identifies the biggest importer or exporter.
To discover high-growth global markets and optimize your business strategy:
Click Here
Pricing
- Single User License$ 1,995
- Department License$ 2,400
- Site License$ 3,120
- Global License$ 3,795

Leadership Perspectives from Industry Events
Search
Thought Leadership and Analyst Meet


Our Clients
6WResearch In News
- India Air Conditioner Market Set for Strong Rebound in 2026 After Weather-Led Correction and GST-Driven Recovery: 6Wresearch
- ADAS in India: How Automatic Emergency Braking, Blind Spot Detection & Driver Monitoring are Transforming Road Safety
- Doha a strategic location for EV manufacturing hub: IPA Qatar
- Demand for luxury TVs surging in the GCC, says Samsung
- Empowering Growth: The Thriving Journey of Bangladesh’s Cable Industry
- Demand for luxury TVs surging in the GCC, says Samsung
Latest Reports
- Nicaragua RPG Gaming Market (2026-2032)
- New Zealand RPG Gaming Market (2026-2032)
- Netherlands RPG Gaming Market (2026-2032)
- Nauru RPG Gaming Market (2026-2032)
- Namibia RPG Gaming Market (2026-2032)
- Mozambique RPG Gaming Market (2026-2032)
- Montenegro RPG Gaming Market (2026-2032)
- Mongolia RPG Gaming Market (2026-2032)
- Monaco RPG Gaming Market (2026-2032)
- Micronesia RPG Gaming Market (2026-2032)
Industry Events and Analyst Meet

EV India Expo 2026

HIMTEX 2026

India Refining Summit 2026

India EV Show 2026

EV tech India Expo 2026
Whitepaper
- Middle East & Africa Commercial Security Market Click here to view more.
- Middle East & Africa Fire Safety Systems & Equipment Market Click here to view more.
- GCC Drone Market Click here to view more.
- Middle East Lighting Fixture Market Click here to view more.
- GCC Physical & Perimeter Security Market Click here to view more.