Sri Lanka Carnauba Wax Market (2026-2032) Outlook | Trends, Forecast, Value, Size, Growth, Companies, Analysis, Revenue, Share & Industry
Market Forecast By Product (Type1, Type3, Type4), By Application (Cosmetics, Food, Automotive, Pharmaceutical, Others) And Competitive Landscape
| Product Code: ETC219931 | Publication Date: Aug 2022 | Updated Date: Mar 2026 | Product Type: Market Research Report | |
| Publisher: 6Wresearch | Author: Ravi Bhandari | No. of Pages: 75 | No. of Figures: 35 | No. of Tables: 20 |
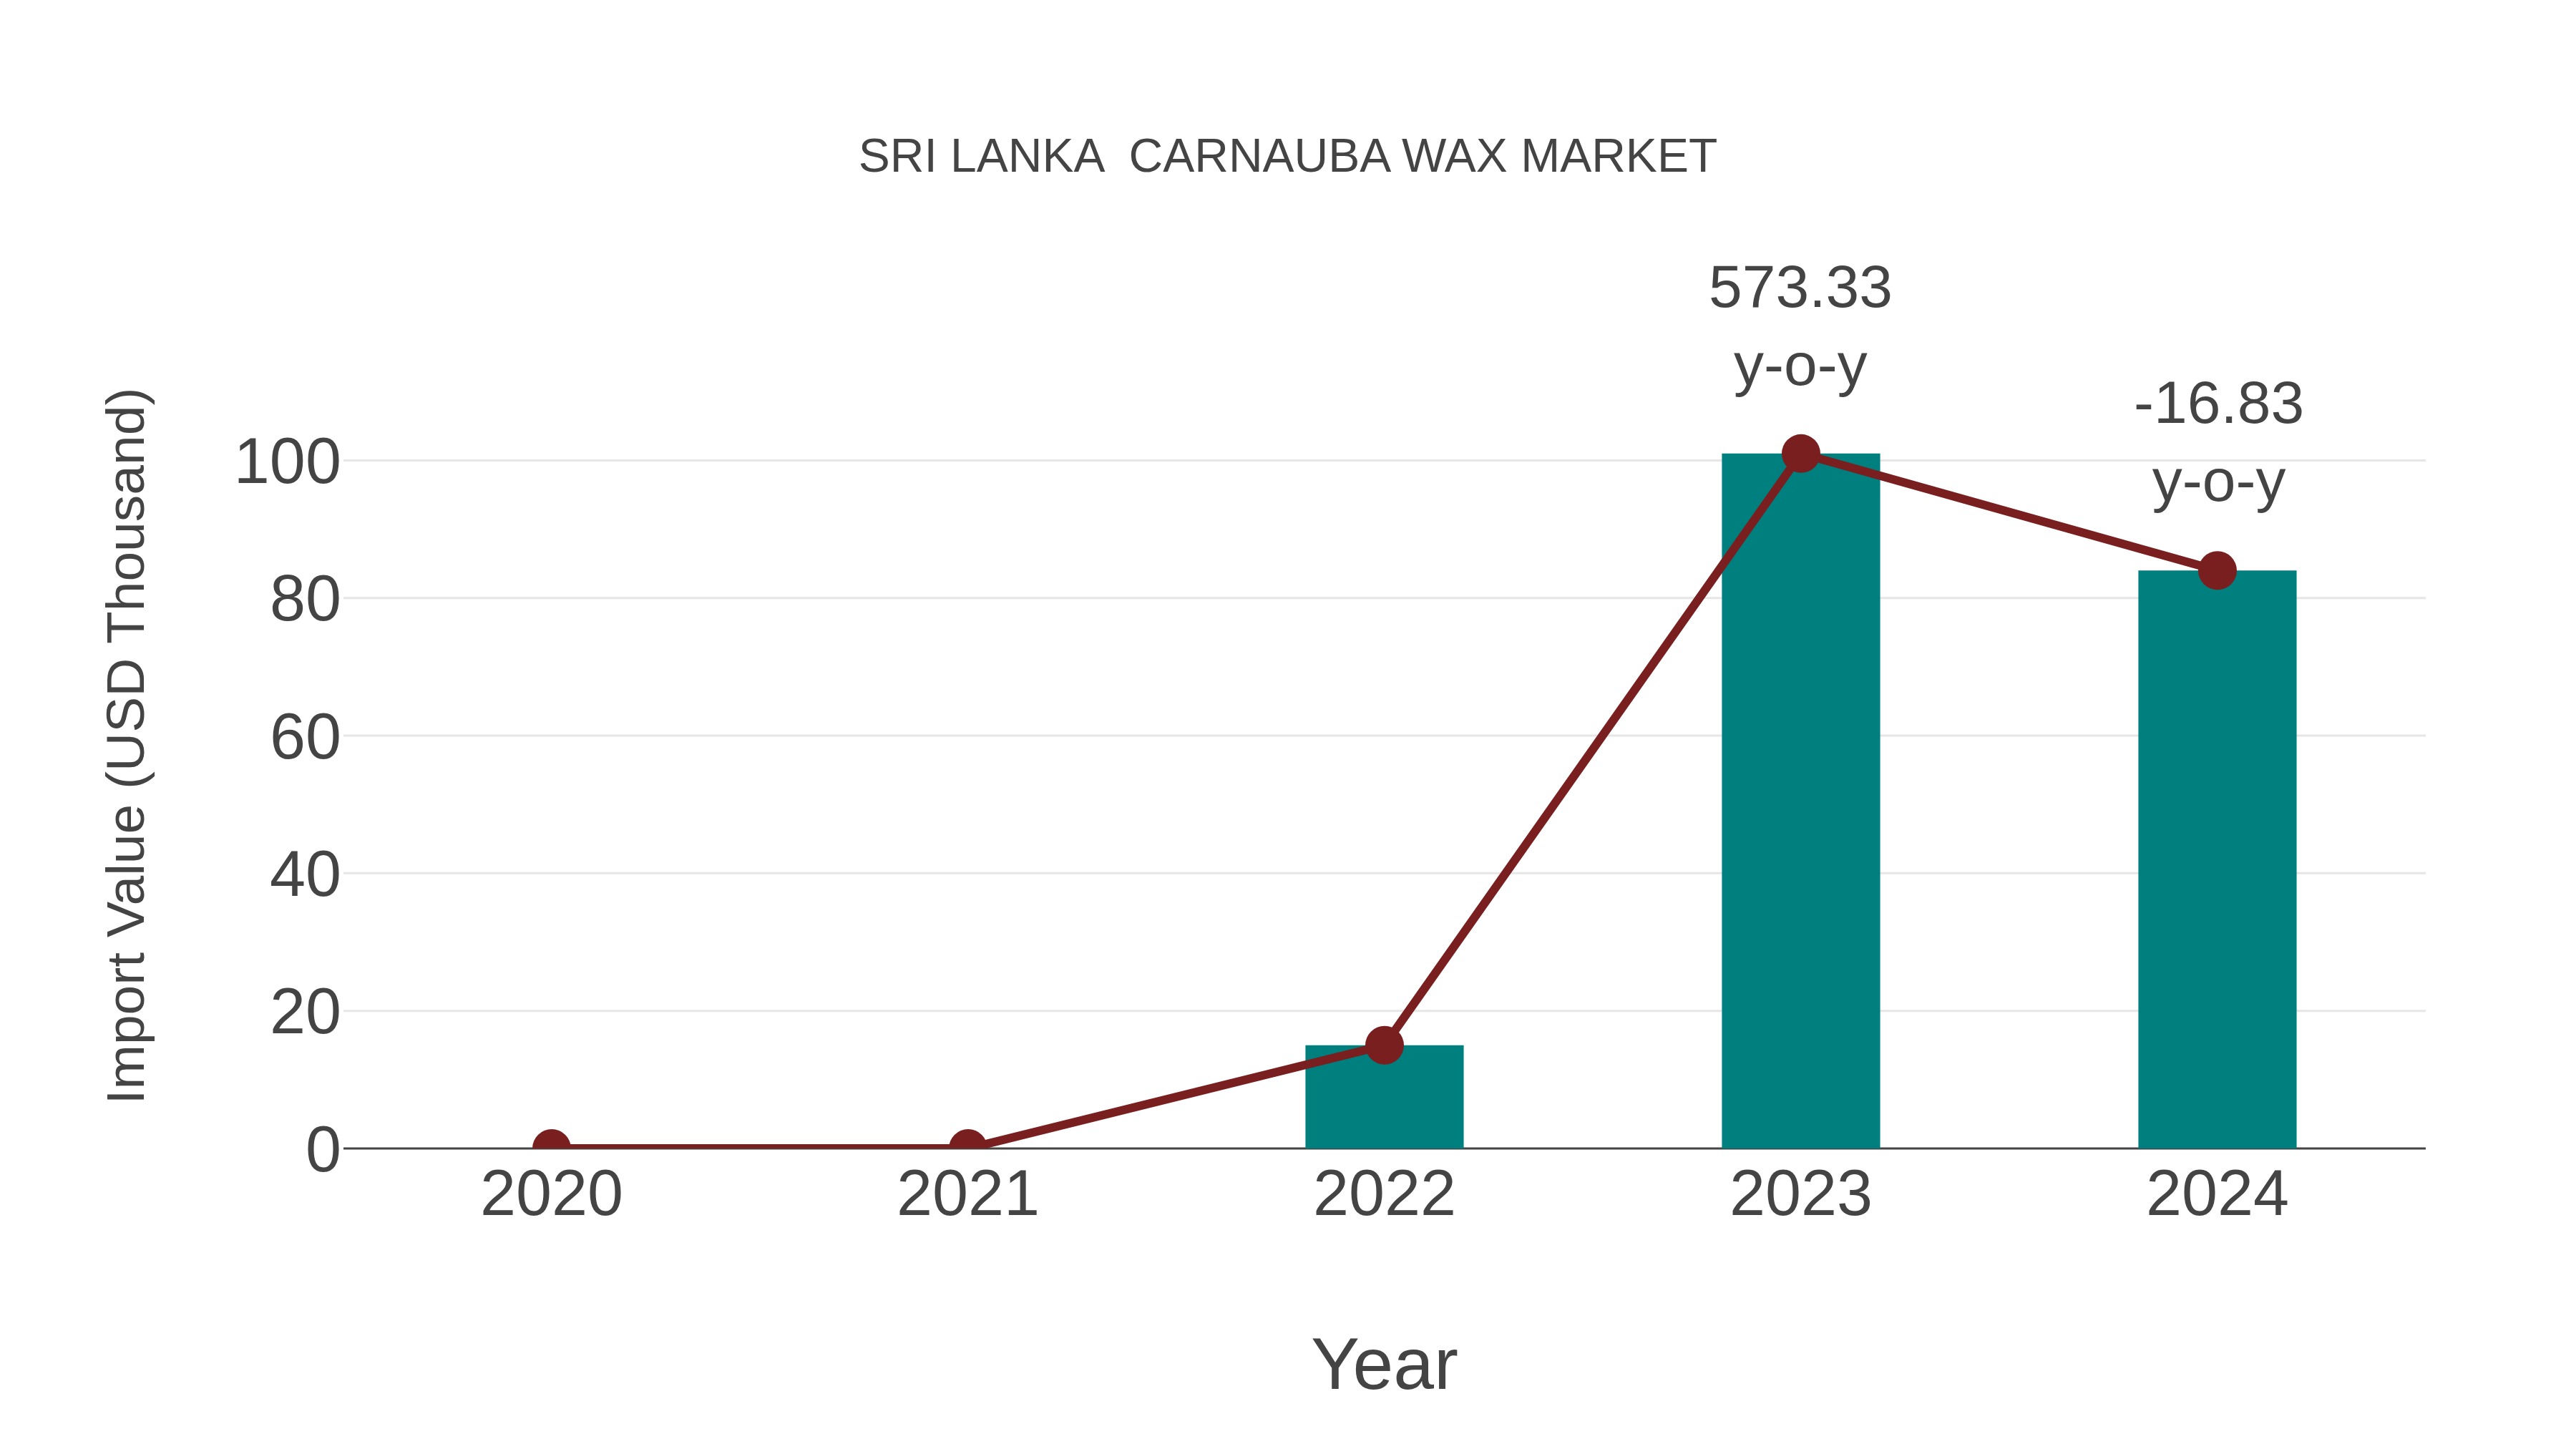
Sri Lanka Carnauba Wax Market: Import Trend Analysis
Sri Lanka import trend for carnauba wax experienced a decline of -16.83% from 2023 to 2024, with a notable compound annual growth rate (CAGR) of 136.64% from 2020 to 2024. This decline could be attributed to shifts in demand patterns or changes in trade policies impacting the market.
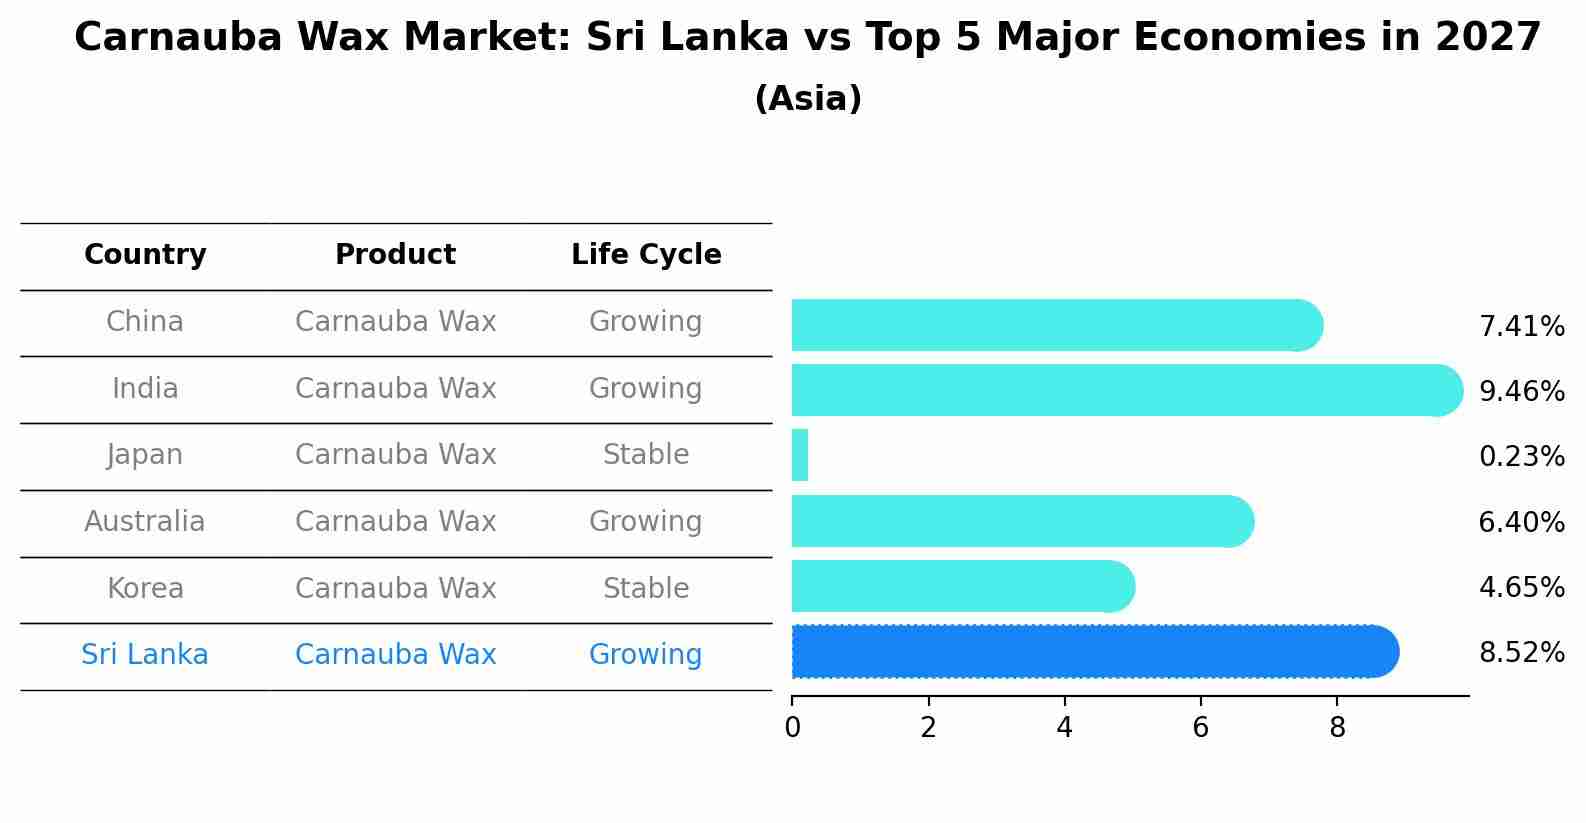
Carnauba Wax Market: Sri Lanka vs Top 5 Major Economies in 2027 (Asia)
Sri Lanka's Carnauba Wax market is anticipated to experience a growing growth rate of 8.52% by 2027, reflecting trends observed in the largest economy China, followed by India, Japan, Australia and South Korea.
Sri Lanka Carnauba Wax Market Overview
Carnauba wax holds a significant position in Sri Lanka specialty wax market, driven by its versatile applications in industries such as cosmetics, pharmaceuticals, and automotive. The country`s production of carnauba wax benefits from favorable climatic conditions and sustainable harvesting practices. Sri Lankan suppliers cater to both domestic industries and international markets, emphasizing product purity and compliance with regulatory standards. The market dynamics are shaped by global demand trends, technological advancements in wax processing, and efforts to expand market reach through innovative product offerings and distribution channels.
Drivers of the market
Sri Lanka carnauba wax market is driven by the growing applications of carnauba wax in industries such as cosmetics, pharmaceuticals, and food processing. The quality of locally sourced carnauba wax and its eco-friendly properties contribute to its rising demand both domestically and internationally.
Challenges of the market
The carnauba wax market struggles with issues such as fluctuating supply due to climate conditions, price volatility, and the need for sustainable harvesting practices.
Government Policy of the market
In the carnauba wax market, the government focuses on supporting the agricultural sectors that produce raw materials. Policies are in place to promote sustainable farming practices and the cultivation of carnauba palms. Subsidies and grants are offered to farmers to improve harvesting techniques and processing methods. Additionally, export promotion strategies and quality certification programs help enhance the marketability of Sri Lankan carnauba wax on the global stage.
Key Highlights of the Report:
- Sri Lanka Carnauba Wax Market Outlook
- Market Size of Sri Lanka Carnauba Wax Market, 2025
- Forecast of Sri Lanka Carnauba Wax Market, 2032
- Historical Data and Forecast of Sri Lanka Carnauba Wax Revenues & Volume for the Period 2022-2032F
- Sri Lanka Carnauba Wax Market Trend Evolution
- Sri Lanka Carnauba Wax Market Drivers and Challenges
- Sri Lanka Carnauba Wax Price Trends
- Sri Lanka Carnauba Wax Porter's Five Forces
- Sri Lanka Carnauba Wax Industry Life Cycle
- Historical Data and Forecast of Sri Lanka Carnauba Wax Market Revenues & Volume By Product for the Period 2022-2032F
- Historical Data and Forecast of Sri Lanka Carnauba Wax Market Revenues & Volume By Type1 for the Period 2022-2032F
- Historical Data and Forecast of Sri Lanka Carnauba Wax Market Revenues & Volume By Type3 for the Period 2022-2032F
- Historical Data and Forecast of Sri Lanka Carnauba Wax Market Revenues & Volume By Type4 for the Period 2022-2032F
- Historical Data and Forecast of Sri Lanka Carnauba Wax Market Revenues & Volume By Application for the Period 2022-2032F
- Historical Data and Forecast of Sri Lanka Carnauba Wax Market Revenues & Volume By Cosmetics for the Period 2022-2032F
- Historical Data and Forecast of Sri Lanka Carnauba Wax Market Revenues & Volume By Food for the Period 2022-2032F
- Historical Data and Forecast of Sri Lanka Carnauba Wax Market Revenues & Volume By Automotive for the Period 2022-2032F
- Historical Data and Forecast of Sri Lanka Carnauba Wax Market Revenues & Volume By Pharmaceutical for the Period 2022-2032F
- Historical Data and Forecast of Sri Lanka Carnauba Wax Market Revenues & Volume By Others for the Period 2022-2032F
- Sri Lanka Carnauba Wax Import Export Trade Statistics
- Market Opportunity Assessment By Product
- Market Opportunity Assessment By Application
- Sri Lanka Carnauba Wax Top Companies Market Share
- Sri Lanka Carnauba Wax Competitive Benchmarking By Technical and Operational Parameters
- Sri Lanka Carnauba Wax Company Profiles
- Sri Lanka Carnauba Wax Key Strategic Recommendations
Sri Lanka Carnauba Wax Market (2026-2032): FAQs
6Wresearch actively monitors the Sri Lanka Carnauba Wax Market and publishes its comprehensive annual report, highlighting emerging trends, growth drivers, revenue analysis, and forecast outlook. Our insights help businesses to make data-backed strategic decisions with ongoing market dynamics. Our analysts track relevent industries related to the Sri Lanka Carnauba Wax Market, allowing our clients with actionable intelligence and reliable forecasts tailored to emerging regional needs.
Yes, we provide customisation as per your requirements. To learn more, feel free to contact us on sales@6wresearch.com
1 Executive Summary |
2 Introduction |
2.1 Key Highlights of the Report |
2.2 Report Description |
2.3 Market Scope & Segmentation |
2.4 Research Methodology |
2.5 Assumptions |
3 Sri Lanka Carnauba Wax Market Overview |
3.1 Sri Lanka Country Macro Economic Indicators |
3.2 Sri Lanka Carnauba Wax Market Revenues & Volume, 2022 & 2032F |
3.3 Sri Lanka Carnauba Wax Market - Industry Life Cycle |
3.4 Sri Lanka Carnauba Wax Market - Porter's Five Forces |
3.5 Sri Lanka Carnauba Wax Market Revenues & Volume Share, By Product, 2022 & 2032F |
3.6 Sri Lanka Carnauba Wax Market Revenues & Volume Share, By Application, 2022 & 2032F |
4 Sri Lanka Carnauba Wax Market Dynamics |
4.1 Impact Analysis |
4.2 Market Drivers |
4.2.1 Increasing demand for natural and eco-friendly products in various industries |
4.2.2 Growing awareness about the benefits of carnauba wax in cosmetics, pharmaceuticals, and food industries |
4.2.3 Rise in disposable income leading to higher spending on premium products |
4.3 Market Restraints |
4.3.1 Fluctuating prices of raw materials impacting production costs |
4.3.2 Competition from synthetic wax alternatives in the market |
4.3.3 Limited availability of carnauba wax due to its specific geographical growth conditions |
5 Sri Lanka Carnauba Wax Market Trends |
6 Sri Lanka Carnauba Wax Market, By Types |
6.1 Sri Lanka Carnauba Wax Market, By Product |
6.1.1 Overview and Analysis |
6.1.2 Sri Lanka Carnauba Wax Market Revenues & Volume, By Product, 2022-2032F |
6.1.3 Sri Lanka Carnauba Wax Market Revenues & Volume, By Type1, 2022-2032F |
6.1.4 Sri Lanka Carnauba Wax Market Revenues & Volume, By Type3, 2022-2032F |
6.1.5 Sri Lanka Carnauba Wax Market Revenues & Volume, By Type4, 2022-2032F |
6.2 Sri Lanka Carnauba Wax Market, By Application |
6.2.1 Overview and Analysis |
6.2.2 Sri Lanka Carnauba Wax Market Revenues & Volume, By Cosmetics, 2022-2032F |
6.2.3 Sri Lanka Carnauba Wax Market Revenues & Volume, By Food, 2022-2032F |
6.2.4 Sri Lanka Carnauba Wax Market Revenues & Volume, By Automotive, 2022-2032F |
6.2.5 Sri Lanka Carnauba Wax Market Revenues & Volume, By Pharmaceutical, 2022-2032F |
6.2.6 Sri Lanka Carnauba Wax Market Revenues & Volume, By Others, 2022-2032F |
7 Sri Lanka Carnauba Wax Market Import-Export Trade Statistics |
7.1 Sri Lanka Carnauba Wax Market Export to Major Countries |
7.2 Sri Lanka Carnauba Wax Market Imports from Major Countries |
8 Sri Lanka Carnauba Wax Market Key Performance Indicators |
8.1 Average selling price of carnauba wax products |
8.2 Number of new product launches using carnauba wax |
8.3 Growth in export volumes of carnauba wax products |
8.4 Adoption rate of carnauba wax in different industries |
8.5 Investment in research and development for new applications of carnauba wax |
9 Sri Lanka Carnauba Wax Market - Opportunity Assessment |
9.1 Sri Lanka Carnauba Wax Market Opportunity Assessment, By Product, 2022 & 2032F |
9.2 Sri Lanka Carnauba Wax Market Opportunity Assessment, By Application, 2022 & 2032F |
10 Sri Lanka Carnauba Wax Market - Competitive Landscape |
10.1 Sri Lanka Carnauba Wax Market Revenue Share, By Companies, 2025 |
10.2 Sri Lanka Carnauba Wax Market Competitive Benchmarking, By Operating and Technical Parameters |
11 Company Profiles |
12 Recommendations |
13 Disclaimer |
Global Go To Market Strategy - 2030
Export potential enables firms to identify high-growth global markets with greater confidence by combining advanced trade intelligence with a structured quantitative methodology. The framework analyzes emerging demand trends and country-level import patterns while integrating macroeconomic and trade datasets such as GDP and population forecasts, bilateral import–export flows, tariff structures, elasticity differentials between developed and developing economies, geographic distance, and import demand projections. Using weighted trade values from 2020–2024 as the base period to project country-to-country export potential for 2030, these inputs are operationalized through calculated drivers such as gravity model parameters, tariff impact factors, and projected GDP per-capita growth. Through an analysis of hidden potentials, demand hotspots, and market conditions that are most favorable to success, this method enables firms to focus on target countries, maximize returns, and global expansion with data, backed by accuracy.
By factoring in the projected importer demand gap that is currently unmet and could be potential opportunity, it identifies the potential for the Exporter (Country) among 190 countries, against the general trade analysis, which identifies the biggest importer or exporter.
To discover high-growth global markets and optimize your business strategy:
Click Here
Pricing
- Single User License$ 1,995
- Department License$ 2,400
- Site License$ 3,120
- Global License$ 3,795

Leadership Perspectives from Industry Events
Search
Thought Leadership and Analyst Meet


Our Clients
6WResearch In News
- India Air Conditioner Market Set for Strong Rebound in 2026 After Weather-Led Correction and GST-Driven Recovery: 6Wresearch
- ADAS in India: How Automatic Emergency Braking, Blind Spot Detection & Driver Monitoring are Transforming Road Safety
- Doha a strategic location for EV manufacturing hub: IPA Qatar
- Demand for luxury TVs surging in the GCC, says Samsung
- Empowering Growth: The Thriving Journey of Bangladesh’s Cable Industry
- Demand for luxury TVs surging in the GCC, says Samsung
Latest Reports
- Nicaragua RPG Gaming Market (2026-2032)
- New Zealand RPG Gaming Market (2026-2032)
- Netherlands RPG Gaming Market (2026-2032)
- Nauru RPG Gaming Market (2026-2032)
- Namibia RPG Gaming Market (2026-2032)
- Mozambique RPG Gaming Market (2026-2032)
- Montenegro RPG Gaming Market (2026-2032)
- Mongolia RPG Gaming Market (2026-2032)
- Monaco RPG Gaming Market (2026-2032)
- Micronesia RPG Gaming Market (2026-2032)
Industry Events and Analyst Meet

EV India Expo 2026

HIMTEX 2026

India Refining Summit 2026

India EV Show 2026

EV tech India Expo 2026
Whitepaper
- Middle East & Africa Commercial Security Market Click here to view more.
- Middle East & Africa Fire Safety Systems & Equipment Market Click here to view more.
- GCC Drone Market Click here to view more.
- Middle East Lighting Fixture Market Click here to view more.
- GCC Physical & Perimeter Security Market Click here to view more.