Sri Lanka Filling Equipment Market (2026-2032) | Analysis, Share, Value, Outlook, Trends, Industry, Size, Companies, Growth, Forecast & Revenue
Market Forecast By Type (Rotary Fillers, Volumetric Fillers, Aseptic Fillers, Net Weight Fillers, Other), By Process (Manual, Semi-Automatic, Automatic), By Applications (Food & Beverage, Pharmaceutical, Cosmetic, Others) And Competitive Landscape
| Product Code: ETC047111 | Publication Date: Jan 2021 | Updated Date: Jun 2026 | Product Type: Report | |
| Publisher: 6Wresearch | Author: Summon Dutta | No. of Pages: 70 | No. of Figures: 35 | No. of Tables: 5 |
Sri Lanka Filling Equipment Market Size, Share & Growth Rate
The Sri Lanka Filling Equipment Market was estimated at USD 401 Million in 2025 and is projected to reach USD 536 Million by 2032, growing at a CAGR of 4.2% from 2026 to 2032. This upward trajectory is significantly influenced by the rapid expansion of the food and beverage sector, alongside the burgeoning pharmaceutical industry. Enhanced production efficiency and stringent regulatory compliance are compelling industries to invest in advanced filling technologies, thereby driving the market's growth.
Sri Lanka Filling Equipment Market Year-wise Growth Rate and Key Drivers
This graph highlights how the Sri Lanka Filling Equipment Market has steadily grown over the years, supported by major growth factors.
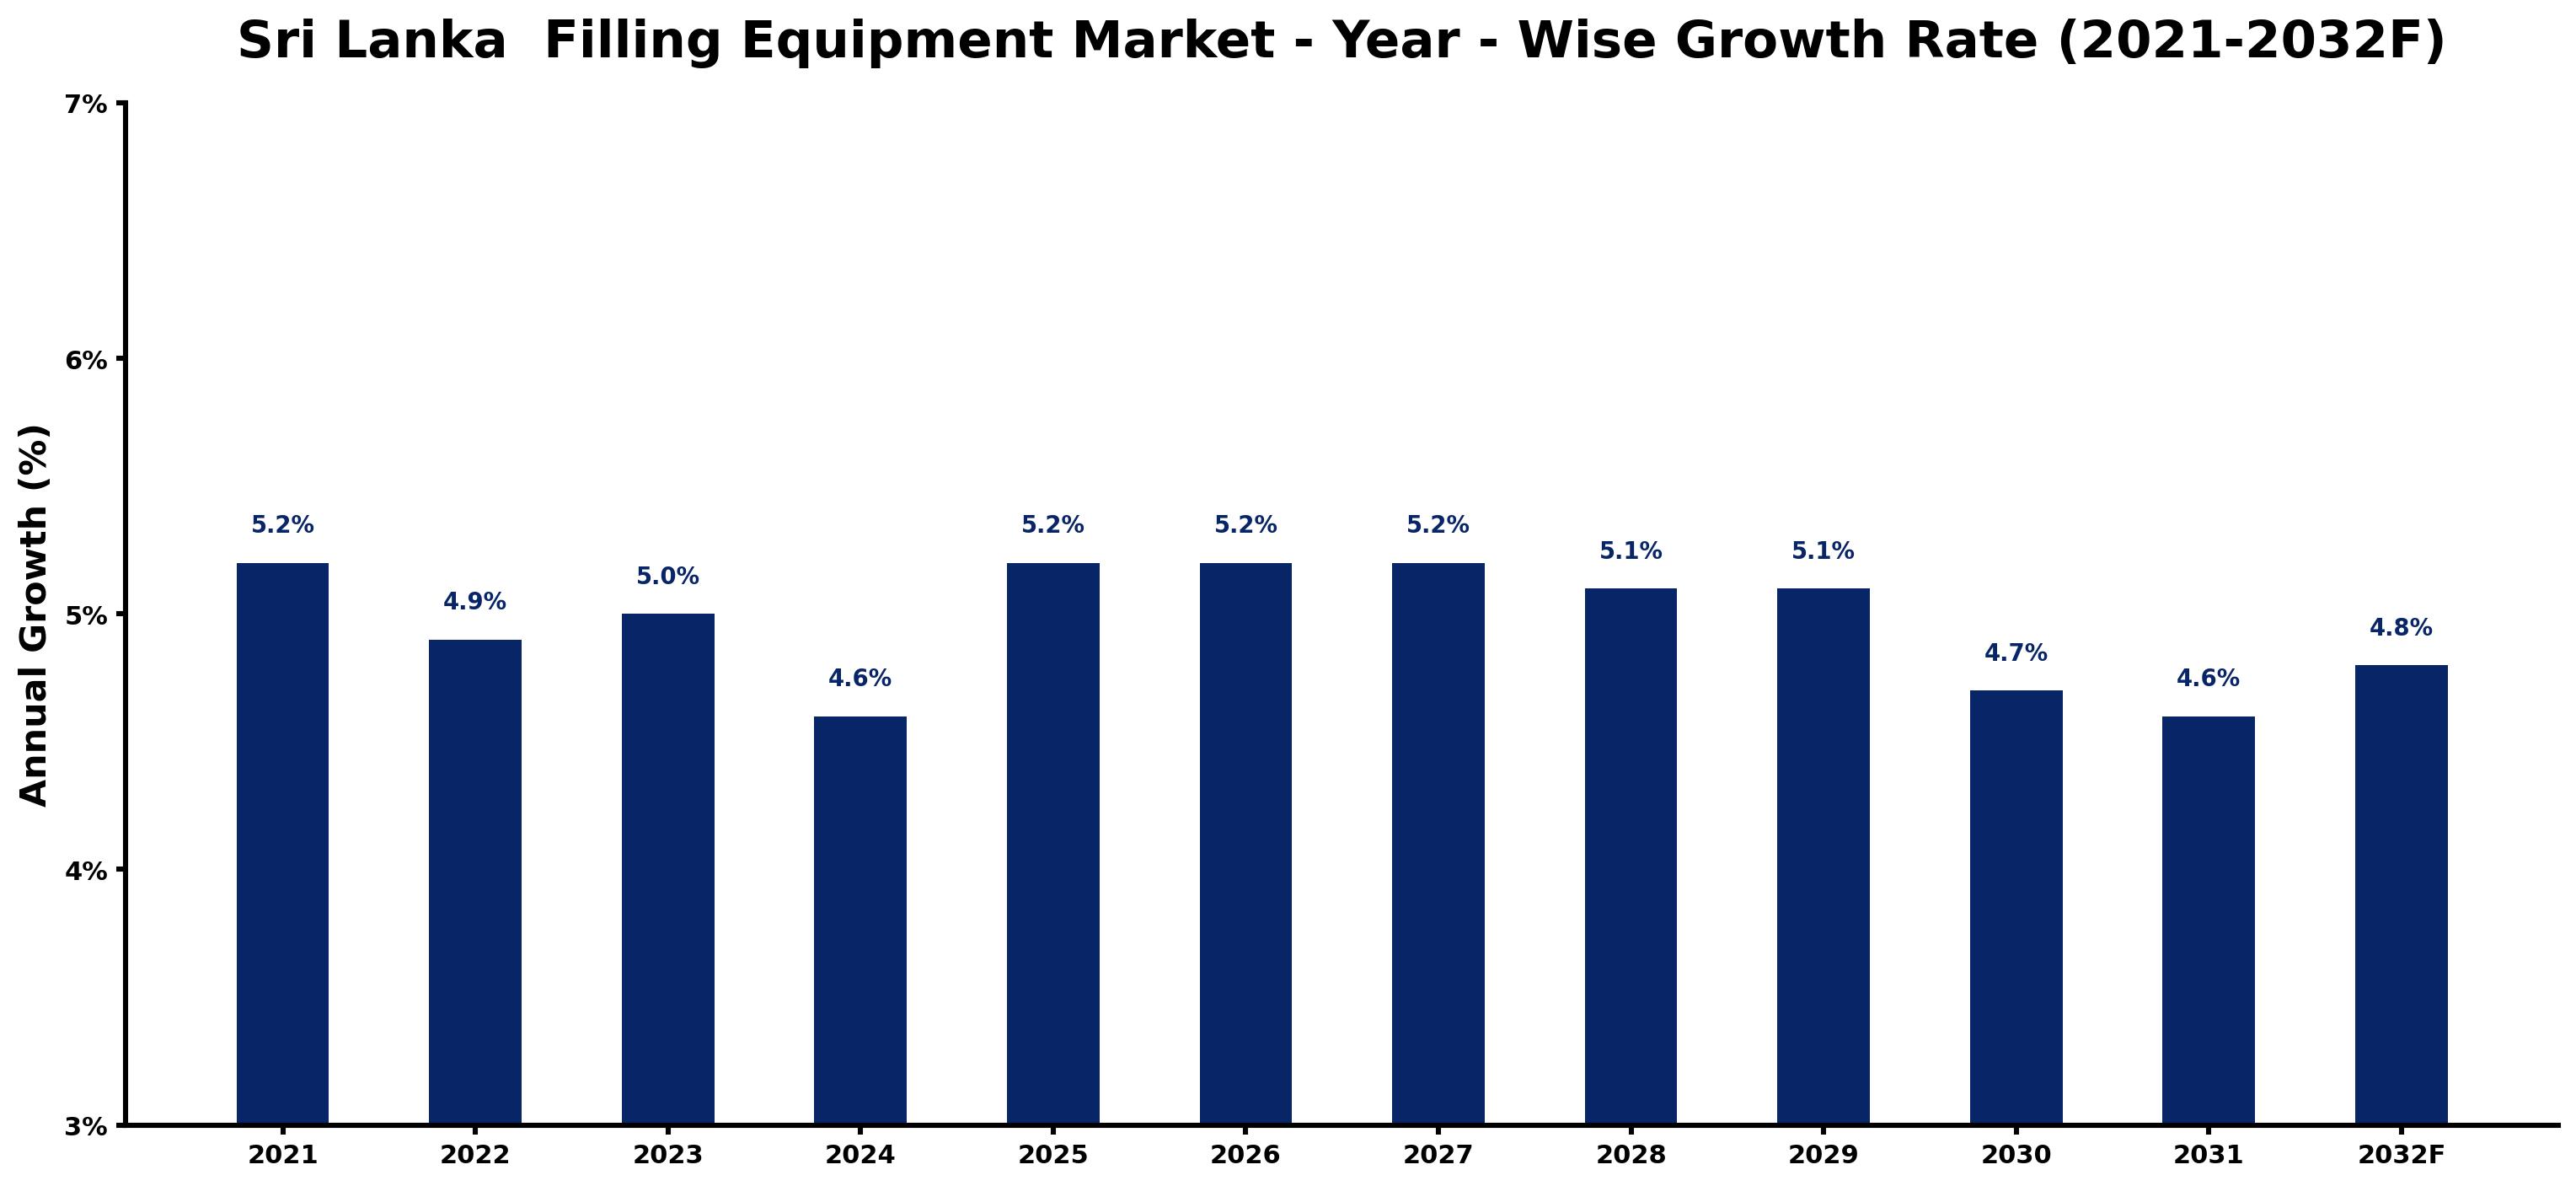
The table below presents the year‑wise growth rates along with the key drivers influencing the market
| Year | Growth Rate | Major Drivers |
| 2021 | 5.2% | Rising electricity demand across industries |
| 2022 | 4.9% | Expansion of commercial construction activities |
| 2023 | 5.0% | Expansion of commercial construction activities |
| 2024 | 4.6% | Increasing industrial infrastructure investments |
| 2025 | 5.2% | Rising electricity demand across industries |
| 2026 | 5.2% | Rising electricity demand across industries |
| 2027 | 5.2% | Increasing adoption of advanced technologies |
| 2028 | 5.1% | Increasing smart city development projects |
| 2029 | 5.1% | Rapid growth in telecom and data center sectors |
| 2030 | 4.7% | Growing renewable energy integration projects |
| 2031 | 4.6% | Rising electricity demand across industries |
| 2032 | 4.8% | Expansion of commercial construction activities |
Note - Market size estimations and growth projections presented in this report are based on 6Wresearch’s advanced forecasting approach, validated with industry datasets as of June 2026.
Sri Lanka Filling Equipment Market Synopsis
Automation stands out as the most significant force shaping the Sri Lanka Filling Equipment Market. As manufacturers increasingly adopt automated solutions, the demand for high-speed, efficient filling systems is rising, reflecting a strategic shift towards minimizing operational costs and maximizing output.
Furthermore, the heightened awareness regarding product quality and hygiene is prompting companies to seek filling equipment that adheres to stringent standards. This trend is not only boosting sales but also enhancing the overall competitiveness of local manufacturers in the international market.
Sri Lanka Filling Equipment Market Key Takeaways
- The market is driven by the growth in the food and beverage industry, pharmaceutical advancements, and increasing consumer demand for quality products.
- Automation is becoming a crucial element, as companies look to improve operational efficiency and reduce waste through advanced technologies.
- Challenges such as high investment costs and a skills gap in the workforce are hindering smaller enterprises from fully capitalizing on market opportunities.
- Government regulations play a pivotal role in maintaining product integrity and consumer safety, thus shaping industry practices.
- Opportunities exist in developing eco-friendly and energy-efficient filling solutions that align with global sustainability trends.
Evaluation of Restraints in Sri Lanka Filling Equipment Market
The Sri Lanka Filling Equipment Market faces several real constraints that can limit its growth potential. One primary concern is the substantial initial capital required for acquiring advanced filling equipment. This creates barriers, particularly for small to medium-sized enterprises that may struggle with the costs associated with adopting cutting-edge technologies. Additionally, the limited availability of skilled technicians proficient in operating these modern systems adds another layer of complexity. Maintenance demands further contribute to operational costs, as ongoing service is essential to ensure performance reliability. Moreover, the presence of low-cost imported filling equipment intensifies competition, potentially squeezing the margins of domestic manufacturers.
Sri Lanka Filling Equipment Market Trends
The market is witnessing an increasing trend toward automation, with robotics and IoT being integrated into filling processes to enhance speed and accuracy. There is also a marked shift toward equipment capable of handling diverse products—ranging from liquids to powders and viscous materials—as industries diversify their offerings. Sustainability considerations are gaining traction, prompting manufacturers to focus on energy-efficient equipment that minimizes waste. Customization is another emerging trend, as companies seek flexible filling solutions tailored to specific industry requirements.
Sri Lanka Filling Equipment Market Opportunities
Investment opportunities in the Sri Lanka Filling Equipment Market are abundant, especially as the demand for packaged goods rises within the food and beverage sector. Companies that invest in modern, automated filling technologies stand to gain substantially in terms of improved efficiency and reduced costs. Additionally, as sustainability becomes a priority, the demand for eco-friendly filling solutions is set to grow. Investors can capitalize on this shift by introducing innovative equipment that caters to the market's evolving needs, thus positioning themselves advantageously in a competitive landscape.
Government Initiatives in the Sri Lanka Filling Equipment Market
The Sri Lankan government actively regulates the Filling Equipment Market to promote safety and efficiency. Oversight bodies like the Department of Measurement Units, Standards and Services (DMUSS) focus on standardizing and calibrating filling equipment to ensure accurate measurements. Additionally, the Consumer Affairs Authority (CAA) enforces pricing regulations that protect consumer interests. Through these initiatives, the government aims to foster a transparent and competitive market, benefiting both manufacturers and consumers alike.
Future Insights of the Sri Lanka Filling Equipment Market
Looking ahead to 2026-2032, the Sri Lanka Filling Equipment Market is expected to expand consistently, driven by the dual forces of rising consumer demand for packaged goods and the continuous growth of the food and beverage industry. As manufacturers increasingly emphasize automation for enhanced production efficiency, the need for state-of-the-art filling equipment will intensify. Additionally, adherence to stringent packaging regulations will compel companies to invest in advanced filling solutions that align with compliance standards. The future is ripe with possibilities for innovation and technological advancements that will ultimately reshape the market landscape.
Sri Lanka Filling Equipment Market Latest Developments (May 2025 - June 2026)
Recent developments in the Sri Lanka Filling Equipment Market indicate a strong move toward incorporating automated technologies that enhance production capabilities. Industry players are increasingly focused on investing in innovations that prioritize efficiency and sustainability. Furthermore, collaborations among manufacturers, technology providers, and research institutions are becoming more common as stakeholders seek to develop cutting-edge filling solutions tailored to evolving consumer demands.
Sri Lanka Filling Equipment Market - Key Attractiveness of the Report
- 10 Years of Market Numbers
- Historical Data Starting from 2022 to 2025
- Base Year: 2025
- Forecast Data until 2032
- Key Performance Indicators Impacting the Market
- Major Upcoming Developments and Projects
Key Highlights of the Report:
- Sri Lanka Filling Equipment Market Outlook
- Market Size of Sri Lanka Filling Equipment Market, 2025
- Forecast of Sri Lanka Filling Equipment Market, 2032
- Historical Data and Forecast of Sri Lanka Filling Equipment Revenues & Volume for the Period 2022-2032F
- Sri Lanka Filling Equipment Market Trend Evolution
- Sri Lanka Filling Equipment Market Drivers and Challenges
- Sri Lanka Filling Equipment Price Trends
- Sri Lanka Filling Equipment Porter's Five Forces
- Sri Lanka Filling Equipment Industry Life Cycle
- Historical Data and Forecast of Sri Lanka Filling Equipment Market Revenues & Volume By Type for the Period 2022-2032F
- Historical Data and Forecast of Sri Lanka Filling Equipment Market Revenues & Volume By Rotary Fillers for the Period 2022-2032F
- Historical Data and Forecast of Sri Lanka Filling Equipment Market Revenues & Volume By Volumetric Fillers for the Period 2022-2032F
- Historical Data and Forecast of Sri Lanka Filling Equipment Market Revenues & Volume By Aseptic Fillers for the Period 2022-2032F
- Historical Data and Forecast of Sri Lanka Filling Equipment Market Revenues & Volume By Net Weight Fillers for the Period 2022-2032F
- Historical Data and Forecast of Sri Lanka Filling Equipment Market Revenues & Volume By Other for the Period 2022-2032F
- Historical Data and Forecast of Sri Lanka Filling Equipment Market Revenues & Volume By Process for the Period 2022-2032F
- Historical Data and Forecast of Sri Lanka Filling Equipment Market Revenues & Volume By Manual for the Period 2022-2032F
- Historical Data and Forecast of Sri Lanka Filling Equipment Market Revenues & Volume By Semi-Automatic for the Period 2022-2032F
- Historical Data and Forecast of Sri Lanka Filling Equipment Market Revenues & Volume By Automatic for the Period 2022-2032F
- Historical Data and Forecast of Sri Lanka Filling Equipment Market Revenues & Volume By Applications for the Period 2022-2032F
- Historical Data and Forecast of Sri Lanka Filling Equipment Market Revenues & Volume By Food & Beverage for the Period 2022-2032F
- Historical Data and Forecast of Sri Lanka Filling Equipment Market Revenues & Volume By Pharmaceutical for the Period 2022-2032F
- Historical Data and Forecast of Sri Lanka Filling Equipment Market Revenues & Volume By Cosmetic for the Period 2022-2032F
- Historical Data and Forecast of Sri Lanka Filling Equipment Market Revenues & Volume By Others for the Period 2022-2032F
- Sri Lanka Filling Equipment Import Export Trade Statistics
- Market Opportunity Assessment By Type
- Market Opportunity Assessment By Process
- Market Opportunity Assessment By Applications
- Sri Lanka Filling Equipment Top Companies Market Share
- Sri Lanka Filling Equipment Competitive Benchmarking By Technical and Operational Parameters
- Sri Lanka Filling Equipment Company Profiles
- Sri Lanka Filling Equipment Key Strategic Recommendations
Sri Lanka Filling Equipment Market - Frequently Asked Questions
Key drivers include the rapid expansion of the food and beverage industry, the demand for efficient production processes, and adherence to quality standards.
The initial investment can be considerable, often presenting a barrier for small and medium-sized enterprises looking to modernize their operations.
The market was estimated at USD 401 Million in 2025 and is projected to reach USD 536 Million by 2032, growing at a CAGR of 4.2% from 2026 to 2032.
Automation, sustainability, and customization are currently reshaping market dynamics, with a significant shift towards efficient, eco-friendly filling solutions.
Government policies focus on ensuring safety, quality, and fair pricing, creating a competitive landscape that protects consumers and promotes industry integrity.
6Wresearch actively monitors the Sri Lanka Filling Equipment Market and publishes its comprehensive annual report, highlighting emerging trends, growth drivers, revenue analysis, and forecast outlook. Our insights help businesses to make data-backed strategic decisions with ongoing market dynamics. Our analysts track relevent industries related to the Sri Lanka Filling Equipment Market, allowing our clients with actionable intelligence and reliable forecasts tailored to emerging regional needs.
Yes, we provide customisation as per your requirements. To learn more, feel free to contact us on sales@6wresearch.com
1 Executive Summary |
2 Introduction |
2.1 Key Highlights of the Report |
2.2 Report Description |
2.3 Market Scope & Segmentation |
2.4 Research Methodology |
2.5 Assumptions |
3 Sri Lanka Filling Equipment Market Overview |
3.1 Sri Lanka Country Macro Economic Indicators |
3.2 Sri Lanka Filling Equipment Market Revenues & Volume, 2022 & 2032F |
3.3 Sri Lanka Filling Equipment Market - Industry Life Cycle |
3.4 Sri Lanka Filling Equipment Market - Porter's Five Forces |
3.5 Sri Lanka Filling Equipment Market Revenues & Volume Share, By Type, 2022 & 2032F |
3.6 Sri Lanka Filling Equipment Market Revenues & Volume Share, By Process, 2022 & 2032F |
3.7 Sri Lanka Filling Equipment Market Revenues & Volume Share, By Applications, 2022 & 2032F |
4 Sri Lanka Filling Equipment Market Dynamics |
4.1 Impact Analysis |
4.2 Market Drivers |
4.3 Market Restraints |
5 Sri Lanka Filling Equipment Market Trends |
6 Sri Lanka Filling Equipment Market, By Types |
6.1 Sri Lanka Filling Equipment Market, By Type |
6.1.1 Overview and Analysis |
6.1.2 Sri Lanka Filling Equipment Market Revenues & Volume, By Type, 2022-2032F |
6.1.3 Sri Lanka Filling Equipment Market Revenues & Volume, By Rotary Fillers, 2022-2032F |
6.1.4 Sri Lanka Filling Equipment Market Revenues & Volume, By Volumetric Fillers, 2022-2032F |
6.1.5 Sri Lanka Filling Equipment Market Revenues & Volume, By Aseptic Fillers, 2022-2032F |
6.1.6 Sri Lanka Filling Equipment Market Revenues & Volume, By Net Weight Fillers, 2022-2032F |
6.1.7 Sri Lanka Filling Equipment Market Revenues & Volume, By Other, 2022-2032F |
6.2 Sri Lanka Filling Equipment Market, By Process |
6.2.1 Overview and Analysis |
6.2.2 Sri Lanka Filling Equipment Market Revenues & Volume, By Manual, 2022-2032F |
6.2.3 Sri Lanka Filling Equipment Market Revenues & Volume, By Semi-Automatic, 2022-2032F |
6.2.4 Sri Lanka Filling Equipment Market Revenues & Volume, By Automatic, 2022-2032F |
6.3 Sri Lanka Filling Equipment Market, By Applications |
6.3.1 Overview and Analysis |
6.3.2 Sri Lanka Filling Equipment Market Revenues & Volume, By Food & Beverage, 2022-2032F |
6.3.3 Sri Lanka Filling Equipment Market Revenues & Volume, By Pharmaceutical, 2022-2032F |
6.3.4 Sri Lanka Filling Equipment Market Revenues & Volume, By Cosmetic, 2022-2032F |
6.3.5 Sri Lanka Filling Equipment Market Revenues & Volume, By Others, 2022-2032F |
7 Sri Lanka Filling Equipment Market Import-Export Trade Statistics |
7.1 Sri Lanka Filling Equipment Market Export to Major Countries |
7.2 Sri Lanka Filling Equipment Market Imports from Major Countries |
8 Sri Lanka Filling Equipment Market Key Performance Indicators |
9 Sri Lanka Filling Equipment Market - Opportunity Assessment |
9.1 Sri Lanka Filling Equipment Market Opportunity Assessment, By Type, 2022 & 2032F |
9.2 Sri Lanka Filling Equipment Market Opportunity Assessment, By Process, 2022 & 2032F |
9.3 Sri Lanka Filling Equipment Market Opportunity Assessment, By Applications, 2022 & 2032F |
10 Sri Lanka Filling Equipment Market - Competitive Landscape |
10.1 Sri Lanka Filling Equipment Market Revenue Share, By Companies, 2025 |
10.2 Sri Lanka Filling Equipment Market Competitive Benchmarking, By Operating and Technical Parameters |
11 Company Profiles |
12 Recommendations |
13 Disclaimer |
Global Go To Market Strategy - 2030
Export potential enables firms to identify high-growth global markets with greater confidence by combining advanced trade intelligence with a structured quantitative methodology. The framework analyzes emerging demand trends and country-level import patterns while integrating macroeconomic and trade datasets such as GDP and population forecasts, bilateral import–export flows, tariff structures, elasticity differentials between developed and developing economies, geographic distance, and import demand projections. Using weighted trade values from 2020–2024 as the base period to project country-to-country export potential for 2030, these inputs are operationalized through calculated drivers such as gravity model parameters, tariff impact factors, and projected GDP per-capita growth. Through an analysis of hidden potentials, demand hotspots, and market conditions that are most favorable to success, this method enables firms to focus on target countries, maximize returns, and global expansion with data, backed by accuracy.
By factoring in the projected importer demand gap that is currently unmet and could be potential opportunity, it identifies the potential for the Exporter (Country) among 190 countries, against the general trade analysis, which identifies the biggest importer or exporter.
To discover high-growth global markets and optimize your business strategy:
Click Here
Pricing
- Single User License$ 1,995
- Department License$ 2,400
- Site License$ 3,120
- Global License$ 3,795

Leadership Perspectives from Industry Events
Search
Thought Leadership and Analyst Meet


Our Clients
6WResearch In News
- India Air Conditioner Market Set for Strong Rebound in 2026 After Weather-Led Correction and GST-Driven Recovery: 6Wresearch
- ADAS in India: How Automatic Emergency Braking, Blind Spot Detection & Driver Monitoring are Transforming Road Safety
- Doha a strategic location for EV manufacturing hub: IPA Qatar
- Demand for luxury TVs surging in the GCC, says Samsung
- Empowering Growth: The Thriving Journey of Bangladesh’s Cable Industry
- Demand for luxury TVs surging in the GCC, says Samsung
Latest Reports
- Nicaragua RPG Gaming Market (2026-2032)
- New Zealand RPG Gaming Market (2026-2032)
- Netherlands RPG Gaming Market (2026-2032)
- Nauru RPG Gaming Market (2026-2032)
- Namibia RPG Gaming Market (2026-2032)
- Mozambique RPG Gaming Market (2026-2032)
- Montenegro RPG Gaming Market (2026-2032)
- Mongolia RPG Gaming Market (2026-2032)
- Monaco RPG Gaming Market (2026-2032)
- Micronesia RPG Gaming Market (2026-2032)
Industry Events and Analyst Meet

EV India Expo 2026

HIMTEX 2026

India Refining Summit 2026

India EV Show 2026

EV tech India Expo 2026
Whitepaper
- Middle East & Africa Commercial Security Market Click here to view more.
- Middle East & Africa Fire Safety Systems & Equipment Market Click here to view more.
- GCC Drone Market Click here to view more.
- Middle East Lighting Fixture Market Click here to view more.
- GCC Physical & Perimeter Security Market Click here to view more.