Sri Lanka Food Retail Market (2026-2032) | COVID-19 IMPACT, Analysis, Share, Outlook, Size, Trends, Forecast, Industry, Companies, Value, Revenue & Growth
Market Forecast By Product Types (Unpackaged Food, Packaged Food, Drinks, Household Products), By Packaging Types (Boxes, Cans, Cellophane Wrapping, Cylindrical Cardboard) And Competitive Landscape
| Product Code: ETC037071 | Publication Date: Jun 2023 | Updated Date: Jun 2026 | Product Type: Report | |
| Publisher: 6Wresearch | Author: Ravi Bhandari | No. of Pages: 70 | No. of Figures: 35 | No. of Tables: 5 |
Sri Lanka Food Retail Market Summary
The sri lanka food retail market was estimated at USD 723 Million in 2025 and is projected to reach USD 1199 Million by 2032, growing at a CAGR of 8.6% from 2026 to 2032.
Sri Lanka Food Retail Market Year-wise Growth Rate and Key Drivers
This graph highlights how the Sri Lanka Food Retail Market has steadily grown over the past five years, supported by major growth factors.
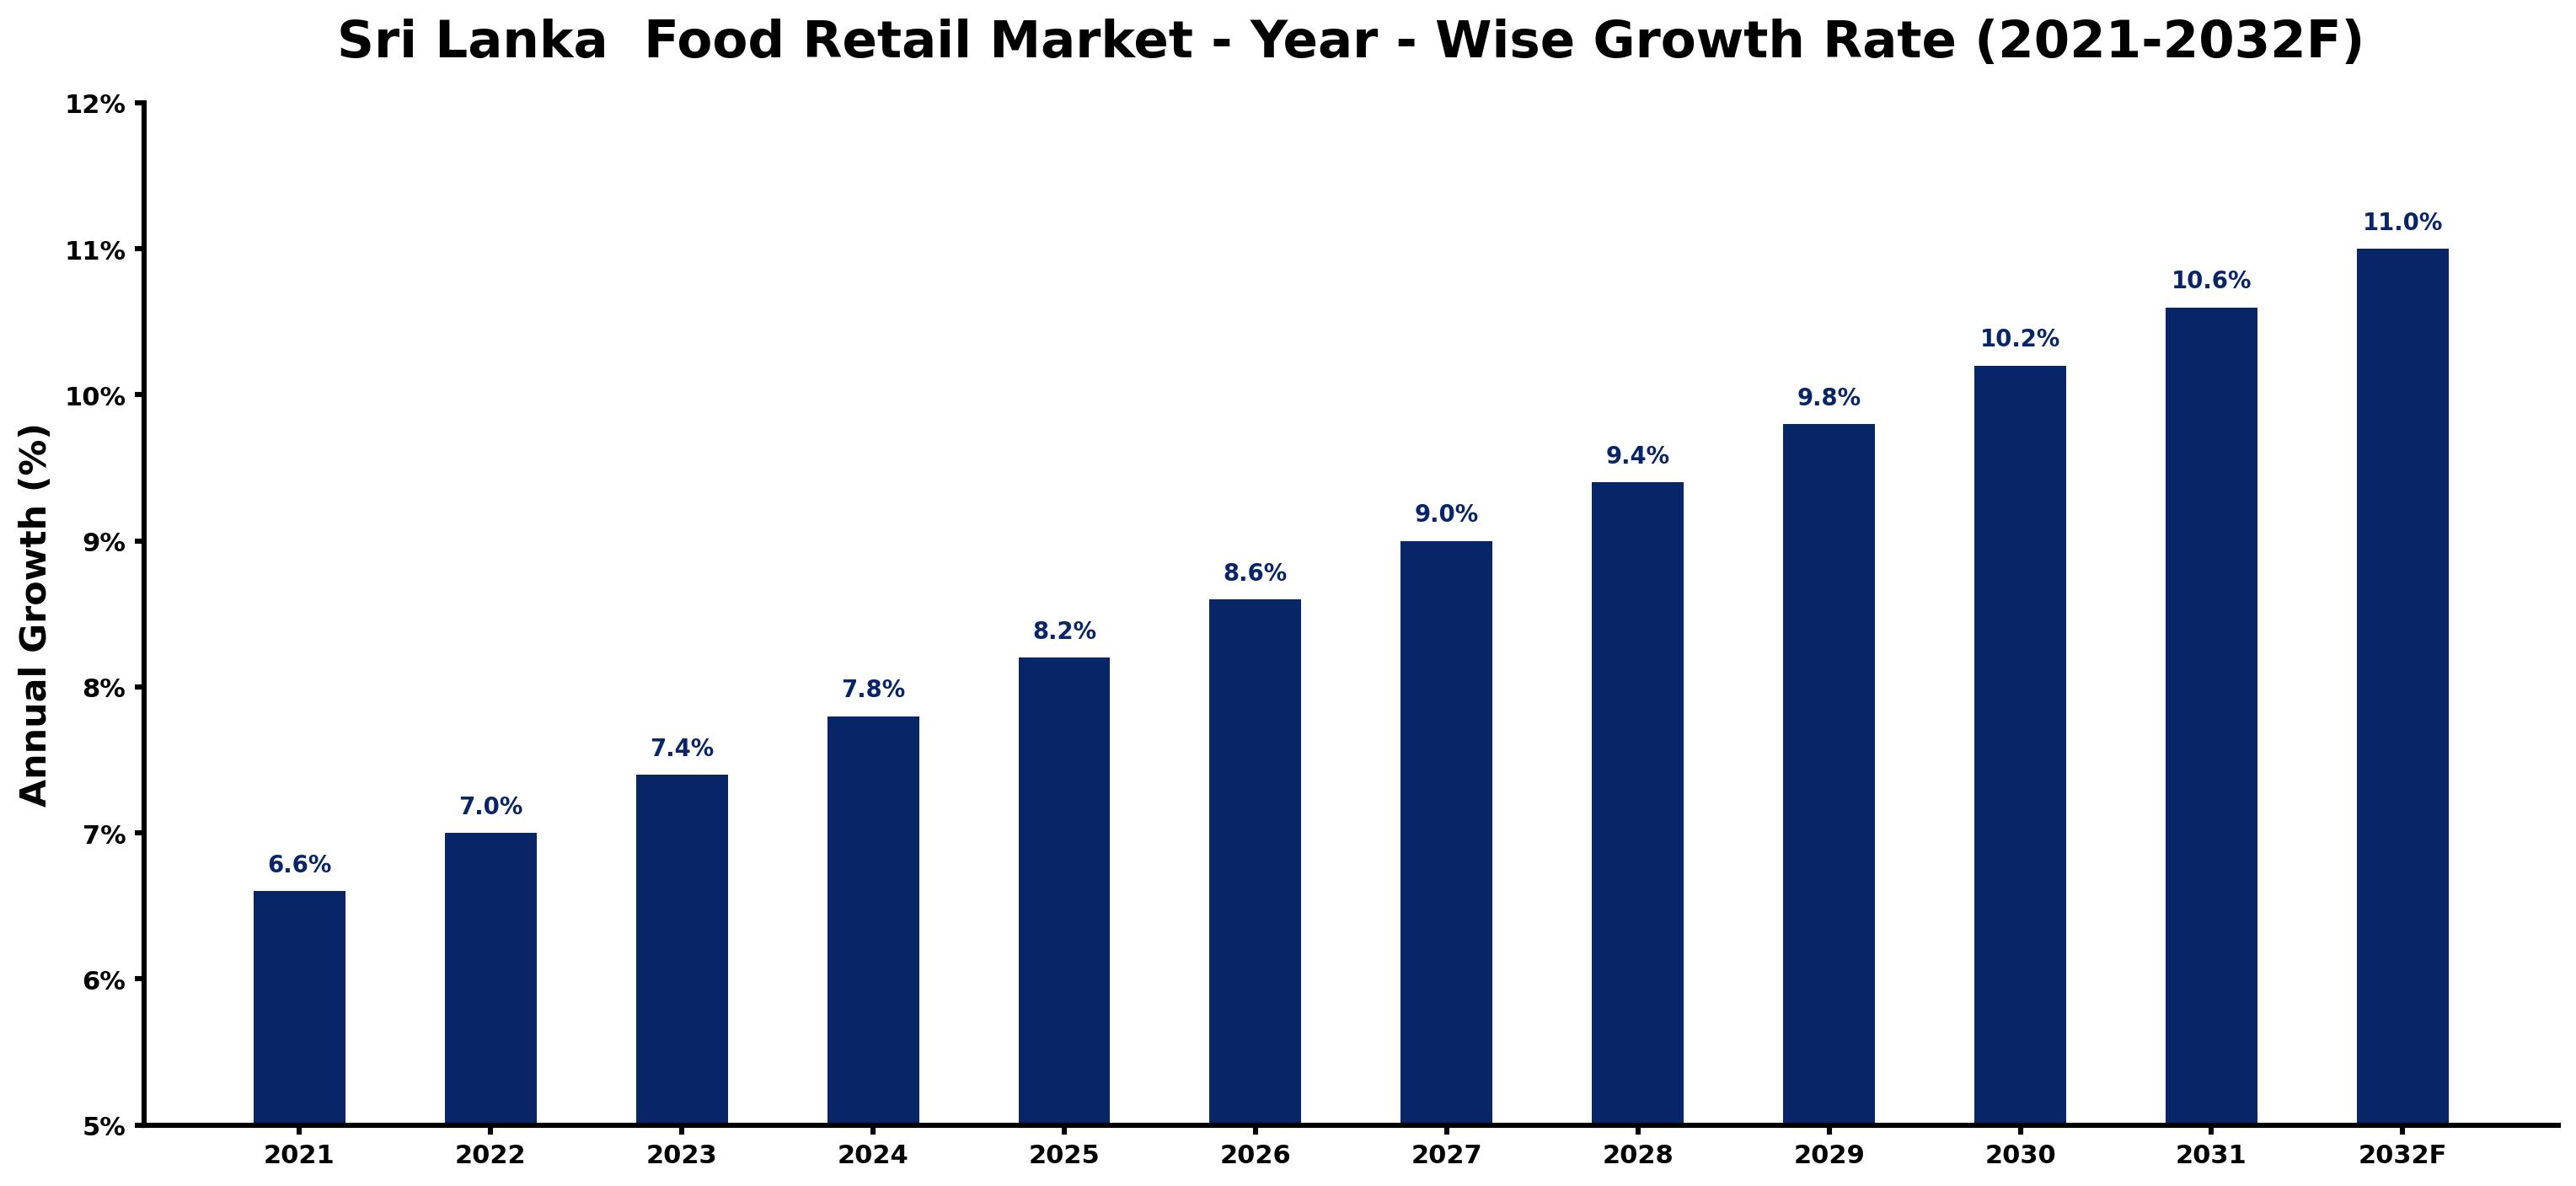
The table below presents the year wise growth rates along with the key drivers influencing the market
| Year | Growth Rate | Major Drivers |
| 2021 | 6.6% | Retail sector recovery post-COVID fuels increased consumer spending on food products. |
| 2022 | 7.0% | E-commerce platforms gain traction, reshaping traditional food shopping experiences significantly. |
| 2023 | 7.4% | Urbanization trends push demand for convenience stores and ready-to-eat meals upward. |
| 2024 | 7.8% | Health-conscious consumer preferences influence product offerings and branding strategies nationwide. |
| 2025 | 8.2% | New supply chain partnerships emerge, enhancing distribution efficiency across the island. |
| 2026 | 8.6% | Sustainable packaging innovations attract environmentally aware shoppers, boosting market competitiveness. |
| 2027 | 9.0% | Local farmers markets gain popularity, emphasizing fresh produce and community engagement. |
| 2028 | 9.4% | Technological investments in retail analytics improve inventory management and customer insights. |
| 2029 | 9.8% | Food safety regulations tighten, prompting retailers to enhance quality control measures. |
| 2030 | 10.2% | Emerging local brands challenge established players, diversifying product ranges significantly. |
| 2031 | 10.6% | Increased disposable income leads to higher spending on premium food items and services. |
| 2032 | 11.0% | Digital payment systems become mainstream, streamlining transactions for modern consumers. |
Note - Market size estimations and growth projections presented in this report are based on 6Wresearch's advanced forecasting approach, validated with industry datasets as of June 2026.
Key Highlights of the Report:
- Sri Lanka Food Retail Market Outlook
- Market Size of Sri Lanka Food Retail Market, 2025
- Forecast of Sri Lanka Food Retail Market, 2023F
- Historical Data and Forecast of Sri Lanka Food Retail Revenues & Volume for the Period 2022-2032F
- Sri Lanka Food Retail Market Trend Evolution
- Sri Lanka Food Retail Market Drivers and Challenges
- Sri Lanka Food Retail Price Trends
- Sri Lanka Food Retail Porter's Five Forces
- Sri Lanka Food Retail Industry Life Cycle
- Historical Data and Forecast of Sri Lanka Food Retail Market Revenues & Volume By Product Types for the Period 2022-2032F
- Historical Data and Forecast of Sri Lanka Food Retail Market Revenues & Volume By Unpackaged Food for the Period 2022-2032F
- Historical Data and Forecast of Sri Lanka Food Retail Market Revenues & Volume By Packaged Food for the Period 2022-2032F
- Historical Data and Forecast of Sri Lanka Food Retail Market Revenues & Volume By Drinks for the Period 2022-2032F
- Historical Data and Forecast of Sri Lanka Food Retail Market Revenues & Volume By Household Products for the Period 2022-2032F
- Historical Data and Forecast of Sri Lanka Food Retail Market Revenues & Volume By Packaging Types for the Period 2022-2032F
- Historical Data and Forecast of Sri Lanka Food Retail Market Revenues & Volume By Boxes for the Period 2022-2032F
- Historical Data and Forecast of Sri Lanka Food Retail Market Revenues & Volume By Cans for the Period 2022-2032F
- Historical Data and Forecast of Sri Lanka Food Retail Market Revenues & Volume By Cellophane Wrapping for the Period 2022-2032F
- Historical Data and Forecast of Sri Lanka Food Retail Market Revenues & Volume By Cylindrical Cardboard for the Period 2022-2032F
- Sri Lanka Food Retail Import Export Trade Statistics
- Market Opportunity Assessment By Product Types
- Market Opportunity Assessment By Packaging Types
- Sri Lanka Food Retail Top Companies Market Share
- Sri Lanka Food Retail Competitive Benchmarking By Technical and Operational Parameters
- Sri Lanka Food Retail Company Profiles
- Sri Lanka Food Retail Key Strategic Recommendations
Frequently Asked Questions About the Market Study (FAQs):
6Wresearch actively monitors the Sri Lanka Food Retail Market and publishes its comprehensive annual report, highlighting emerging trends, growth drivers, revenue analysis, and forecast outlook. Our insights help businesses to make data-backed strategic decisions with ongoing market dynamics. Our analysts track relevent industries related to the Sri Lanka Food Retail Market, allowing our clients with actionable intelligence and reliable forecasts tailored to emerging regional needs.
Yes, we provide customisation as per your requirements. To learn more, feel free to contact us on sales@6wresearch.com
1 Executive Summary |
2 Introduction |
2.1 Key Highlights of the Report |
2.2 Report Description |
2.3 Market Scope & Segmentation |
2.4 Research Methodology |
2.5 Assumptions |
3 Sri Lanka Food Retail Market Overview |
3.1 Sri Lanka Country Macro Economic Indicators |
3.2 Sri Lanka Food Retail Market Revenues & Volume, 2022 & 2032F |
3.3 Sri Lanka Food Retail Market - Industry Life Cycle |
3.4 Sri Lanka Food Retail Market - Porter's Five Forces |
3.5 Sri Lanka Food Retail Market Revenues & Volume Share, By Product Types, 2022 & 2032F |
3.6 Sri Lanka Food Retail Market Revenues & Volume Share, By Packaging Types, 2022 & 2032F |
4 Sri Lanka Food Retail Market Dynamics |
4.1 Impact Analysis |
4.2 Market Drivers |
4.3 Market Restraints |
5 Sri Lanka Food Retail Market Trends |
6 Sri Lanka Food Retail Market, By Types |
6.1 Sri Lanka Food Retail Market, By Product Types |
6.1.1 Overview and Analysis |
6.1.2 Sri Lanka Food Retail Market Revenues & Volume, By Product Types, 2016 - 2026F |
6.1.3 Sri Lanka Food Retail Market Revenues & Volume, By Unpackaged Food, 2016 - 2026F |
6.1.4 Sri Lanka Food Retail Market Revenues & Volume, By Packaged Food, 2016 - 2026F |
6.1.5 Sri Lanka Food Retail Market Revenues & Volume, By Drinks, 2016 - 2026F |
6.1.6 Sri Lanka Food Retail Market Revenues & Volume, By Household Products, 2016 - 2026F |
6.2 Sri Lanka Food Retail Market, By Packaging Types |
6.2.1 Overview and Analysis |
6.2.2 Sri Lanka Food Retail Market Revenues & Volume, By Boxes, 2016 - 2026F |
6.2.3 Sri Lanka Food Retail Market Revenues & Volume, By Cans, 2016 - 2026F |
6.2.4 Sri Lanka Food Retail Market Revenues & Volume, By Cellophane Wrapping, 2016 - 2026F |
6.2.5 Sri Lanka Food Retail Market Revenues & Volume, By Cylindrical Cardboard, 2016 - 2026F |
7 Sri Lanka Food Retail Market Import-Export Trade Statistics |
7.1 Sri Lanka Food Retail Market Export to Major Countries |
7.2 Sri Lanka Food Retail Market Imports from Major Countries |
8 Sri Lanka Food Retail Market Key Performance Indicators |
9 Sri Lanka Food Retail Market - Opportunity Assessment |
9.1 Sri Lanka Food Retail Market Opportunity Assessment, By Product Types, 2022 & 2032F |
9.2 Sri Lanka Food Retail Market Opportunity Assessment, By Packaging Types, 2022 & 2032F |
10 Sri Lanka Food Retail Market - Competitive Landscape |
10.1 Sri Lanka Food Retail Market Revenue Share, By Companies, 2019 |
10.2 Sri Lanka Food Retail Market Competitive Benchmarking, By Operating and Technical Parameters |
11 Company Profiles |
12 Recommendations |
13 Disclaimer |
Global Go To Market Strategy - 2030
Export potential enables firms to identify high-growth global markets with greater confidence by combining advanced trade intelligence with a structured quantitative methodology. The framework analyzes emerging demand trends and country-level import patterns while integrating macroeconomic and trade datasets such as GDP and population forecasts, bilateral import–export flows, tariff structures, elasticity differentials between developed and developing economies, geographic distance, and import demand projections. Using weighted trade values from 2020–2024 as the base period to project country-to-country export potential for 2030, these inputs are operationalized through calculated drivers such as gravity model parameters, tariff impact factors, and projected GDP per-capita growth. Through an analysis of hidden potentials, demand hotspots, and market conditions that are most favorable to success, this method enables firms to focus on target countries, maximize returns, and global expansion with data, backed by accuracy.
By factoring in the projected importer demand gap that is currently unmet and could be potential opportunity, it identifies the potential for the Exporter (Country) among 190 countries, against the general trade analysis, which identifies the biggest importer or exporter.
To discover high-growth global markets and optimize your business strategy:
Click Here
Pricing
- Single User License$ 1,995
- Department License$ 2,400
- Site License$ 3,120
- Global License$ 3,795

Leadership Perspectives from Industry Events
Search
Thought Leadership and Analyst Meet


Our Clients
6WResearch In News
- India Air Conditioner Market Set for Strong Rebound in 2026 After Weather-Led Correction and GST-Driven Recovery: 6Wresearch
- ADAS in India: How Automatic Emergency Braking, Blind Spot Detection & Driver Monitoring are Transforming Road Safety
- Doha a strategic location for EV manufacturing hub: IPA Qatar
- Demand for luxury TVs surging in the GCC, says Samsung
- Empowering Growth: The Thriving Journey of Bangladesh’s Cable Industry
- Demand for luxury TVs surging in the GCC, says Samsung
Latest Reports
- Nicaragua RPG Gaming Market (2026-2032)
- New Zealand RPG Gaming Market (2026-2032)
- Netherlands RPG Gaming Market (2026-2032)
- Nauru RPG Gaming Market (2026-2032)
- Namibia RPG Gaming Market (2026-2032)
- Mozambique RPG Gaming Market (2026-2032)
- Montenegro RPG Gaming Market (2026-2032)
- Mongolia RPG Gaming Market (2026-2032)
- Monaco RPG Gaming Market (2026-2032)
- Micronesia RPG Gaming Market (2026-2032)
Industry Events and Analyst Meet

EV India Expo 2026

HIMTEX 2026

India Refining Summit 2026

India EV Show 2026

EV tech India Expo 2026
Whitepaper
- Middle East & Africa Commercial Security Market Click here to view more.
- Middle East & Africa Fire Safety Systems & Equipment Market Click here to view more.
- GCC Drone Market Click here to view more.
- Middle East Lighting Fixture Market Click here to view more.
- GCC Physical & Perimeter Security Market Click here to view more.