Sri Lanka Industrial Silica Sand Market Outlook | COVID-19 IMPACT, Size, Growth, Revenue, Trends, Analysis, Value, Industry, Share, Companies & Forecast
Market Forecast By Classification (Less Than 40 Mesh, 40-70 Mesh, More Than 70 Mesh), By Application (Hydraulic Fracturing, Glassmaking, Foundry, Ceramics and Refractories, Others) And Competitive Landscape
| Product Code: ETC084350 | Publication Date: Jun 2021 | Updated Date: Sep 2025 | Product Type: Report | |
| Publisher: 6Wresearch | Author: Bhawna Singh | No. of Pages: 70 | No. of Figures: 35 | No. of Tables: 5 |
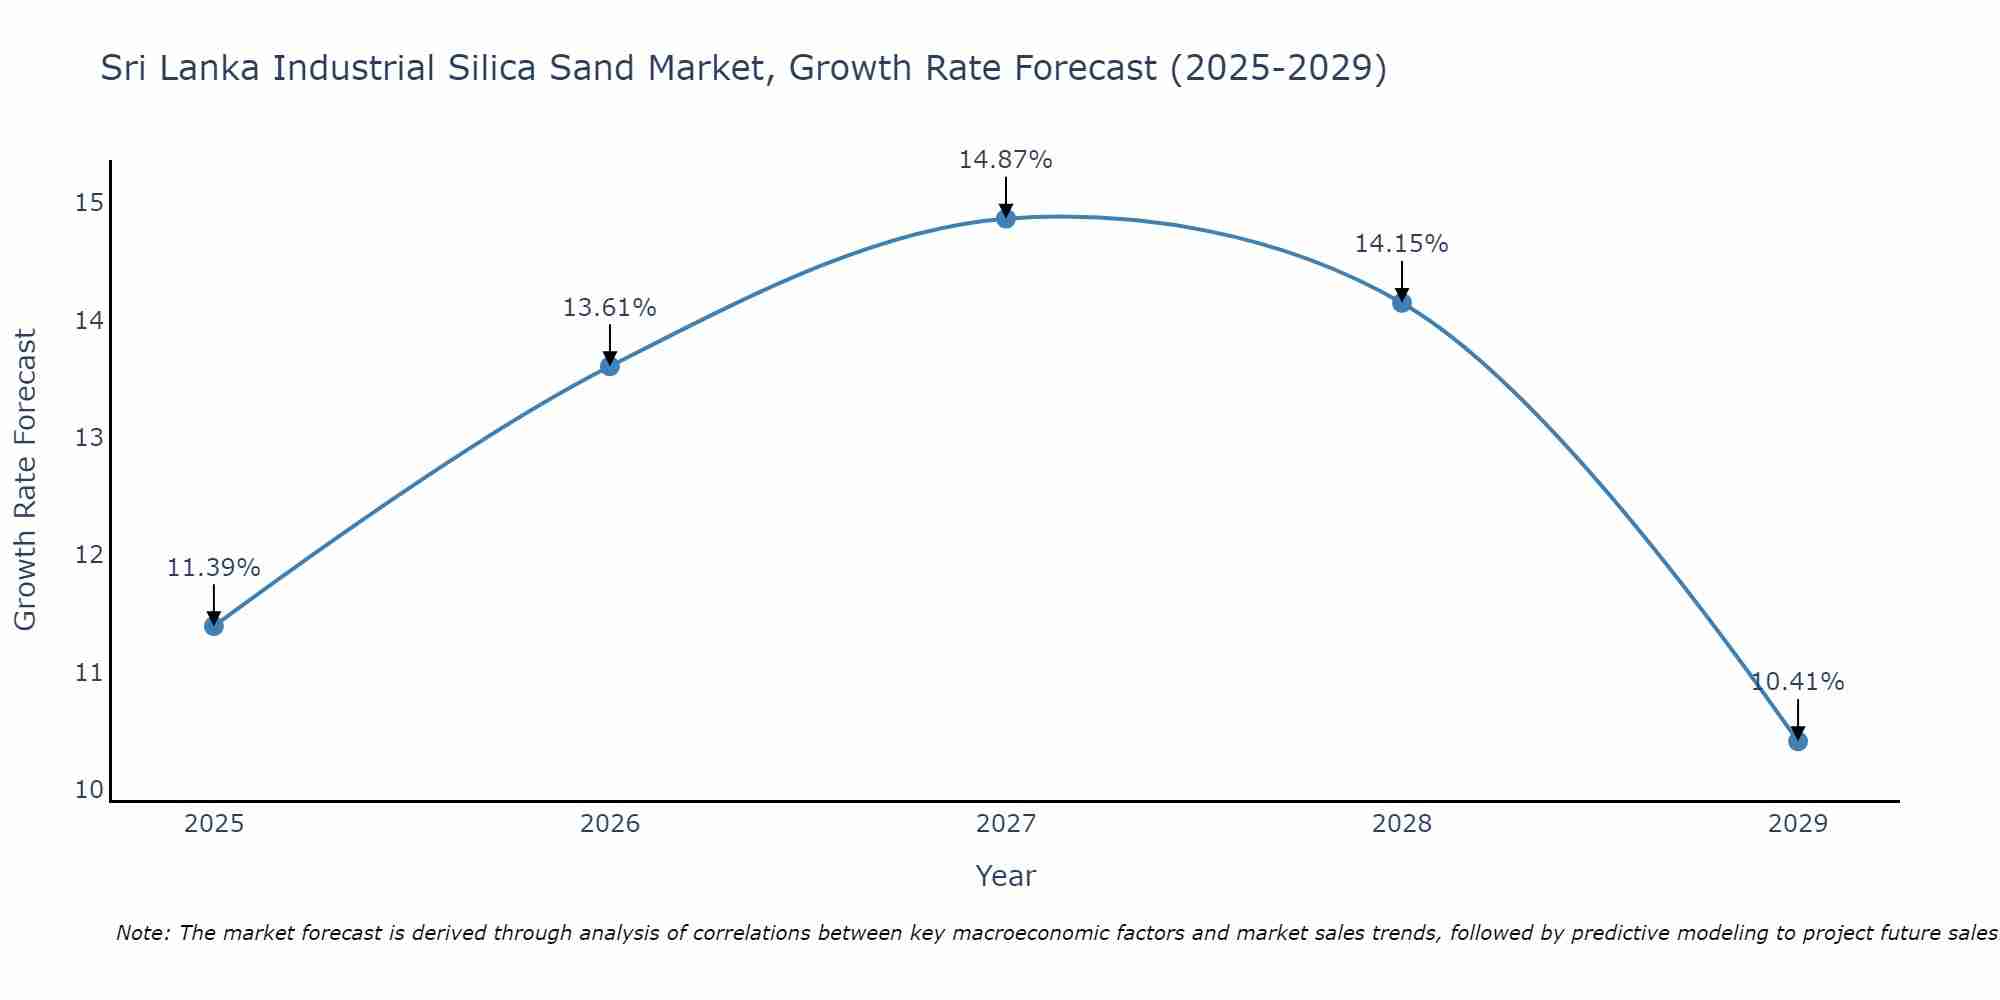
Sri Lanka Industrial Silica Sand Market Size Growth Rate
The Sri Lanka Industrial Silica Sand Market is projected to witness mixed growth rate patterns during 2025 to 2029. Growth accelerates to 14.87% in 2027, following an initial rate of 11.39%, before easing to 10.41% at the end of the period.
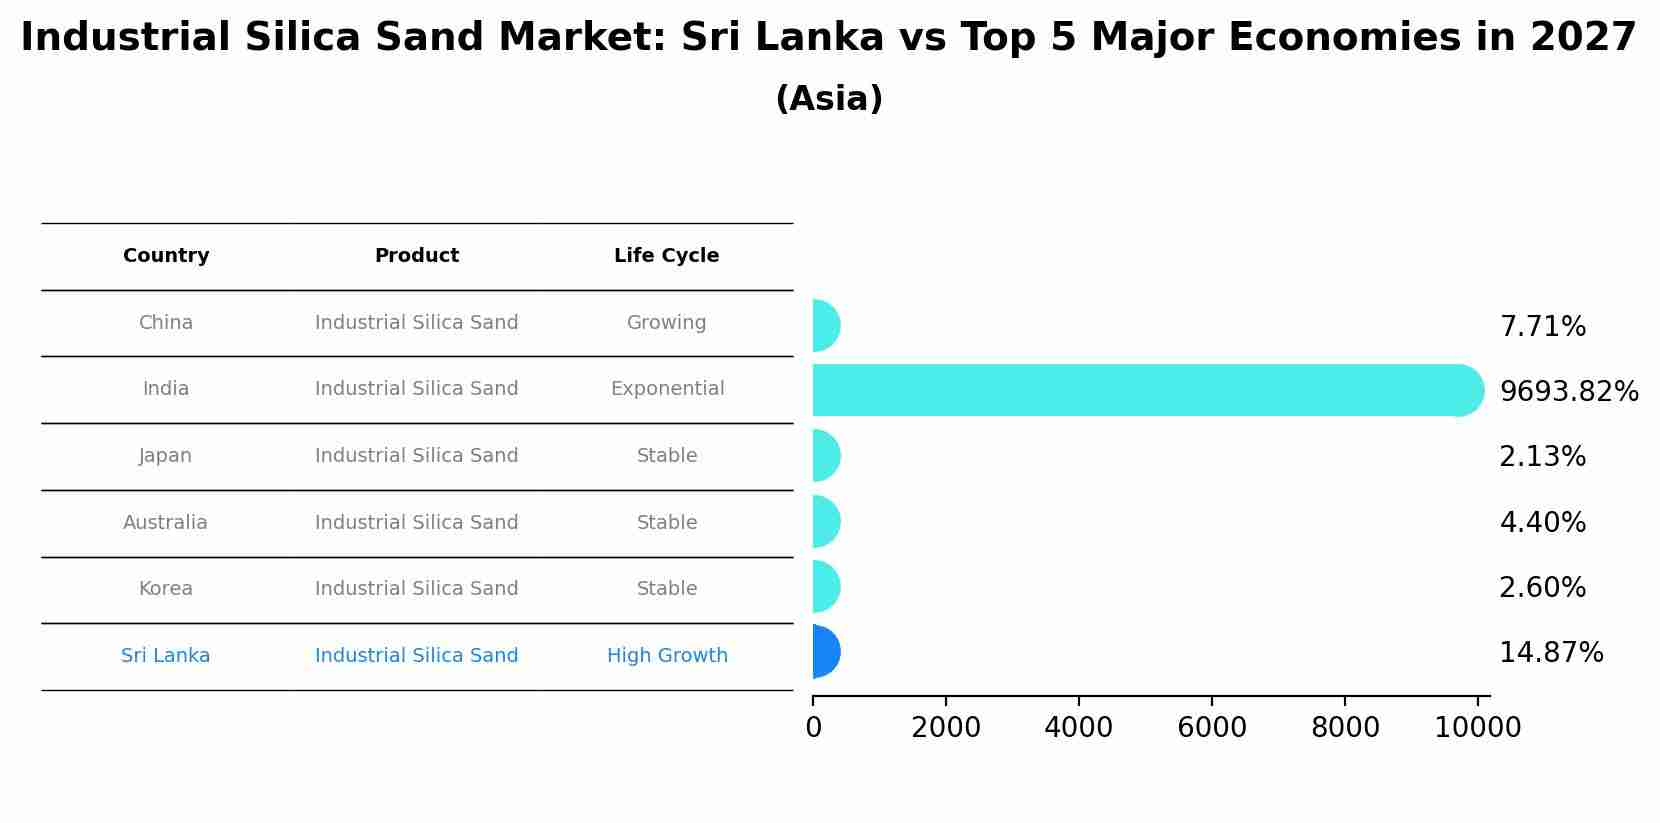
Industrial Silica Sand Market: Sri Lanka vs Top 5 Major Economies in 2027 (Asia)
The Industrial Silica Sand market in Sri Lanka is projected to grow at a high growth rate of 14.87% by 2027, within the Asia region led by China, along with other countries like India, Japan, Australia and South Korea, collectively shaping a dynamic and evolving market environment driven by innovation and increasing adoption of emerging technologies.
Sri Lanka Industrial Silica Sand Market Overview
The Sri Lanka Industrial Silica Sand market is experiencing steady growth due to its diverse applications in construction, glass manufacturing, foundry, and chemical industries. Silica sand is a key raw material used in the production of glass containers, flat glass, and fiberglass products. The construction sector, driven by infrastructure development projects, is a major consumer of silica sand for concrete and mortar production. Additionally, the increasing demand for high-purity silica sand in the electronics and solar panel industries further boosts market growth. Key players in the Sri Lankan market include Tokyo Cement Group, Ceylon Steel Corporation, and Lanka Mineral Sands Ltd. Government initiatives to promote local manufacturing and sustainable mining practices are expected to drive the market further in the coming years.
Sri Lanka Industrial Silica Sand Market Trends
In the Sri Lanka Industrial Silica Sand Market, there is a growing demand for high-purity silica sand due to its various industrial applications, such as in the production of glass, ceramics, and foundry molds. Manufacturers are increasingly focusing on ensuring the quality and consistency of silica sand to meet the stringent requirements of end-users. Environmental sustainability is also a key trend, with companies investing in eco-friendly mining and processing practices to minimize the impact on the environment. Additionally, the market is witnessing a rise in strategic partnerships and collaborations among key players to enhance their market presence and expand their product offerings. Overall, the Sri Lanka Industrial Silica Sand Market is poised for steady growth driven by increasing industrialization and infrastructure development projects in the country.
Sri Lanka Industrial Silica Sand Market Challenges
In the Sri Lanka Industrial Silica Sand Market, some of the key challenges include inconsistent quality of silica sand deposits, environmental concerns related to sand mining activities, and limited processing capabilities. The varying quality of silica sand deposits can impact the end product quality and consistency for industrial users. Additionally, issues such as deforestation, water pollution, and land degradation from sand mining activities raise environmental concerns and can lead to regulatory challenges. Furthermore, the lack of advanced processing facilities in Sri Lanka can hinder the production of high-grade silica sand products, limiting the competitiveness of the market. Addressing these challenges will require investments in sustainable mining practices, advanced processing technologies, and regulatory frameworks to ensure environmental protection and product quality standards in the Industrial Silica Sand Market in Sri Lanka.
Sri Lanka Industrial Silica Sand Market Investment Opportunities
In the Sri Lanka Industrial Silica Sand Market, there are several investment opportunities worth considering. The growing construction industry in Sri Lanka, driven by infrastructure development projects, presents a strong demand for industrial silica sand as a key component in concrete and other construction materials. Additionally, the increasing use of silica sand in the manufacturing of glass, ceramics, and electronics further boosts market potential. Investing in silica sand mining and processing operations, as well as establishing partnerships with construction companies and manufacturers, can be lucrative ventures in this market. Moreover, implementing sustainable practices in silica sand extraction and processing can appeal to environmentally conscious investors and align with the growing trend of responsible resource management in Sri Lanka.
Sri Lanka Industrial Silica Sand Market Government Policy
The Sri Lankan government has implemented several policies related to the Industrial Silica Sand Market to regulate and promote sustainable development. The Mineral Resources Act governs the extraction and export of silica sand, with strict regulations on licensing and environmental impact assessments. Additionally, the Industrial Development Board oversees the industry`s growth and provides support for local businesses through financial incentives and technical assistance. The government also encourages value addition and innovation in the silica sand sector to increase competitiveness and export earnings. Overall, these policies aim to balance economic growth with environmental protection and ensure the long-term sustainability of the Industrial Silica Sand Market in Sri Lanka.
Sri Lanka Industrial Silica Sand Market Future Outlook
The future outlook for the Sri Lanka Industrial Silica Sand Market appears promising, driven by increasing demand from various industries such as construction, glass manufacturing, and foundry. The country`s growing infrastructure projects and the expansion of the construction sector are expected to fuel the demand for industrial silica sand. Additionally, the government`s focus on promoting industrial development and attracting foreign investments is likely to create opportunities for market growth. However, challenges such as environmental concerns regarding sand mining and fluctuations in raw material prices may impact the market`s growth trajectory. Overall, with proper regulations and sustainable practices in place, the Sri Lanka Industrial Silica Sand Market is poised for steady growth in the coming years.
Key Highlights of the Report:
- Sri Lanka Industrial Silica Sand Market Outlook
- Market Size of Sri Lanka Industrial Silica Sand Market, 2021
- Forecast of Sri Lanka Industrial Silica Sand Market, 2027
- Historical Data and Forecast of Sri Lanka Industrial Silica Sand Revenues & Volume for the Period 2018 - 2027
- Sri Lanka Industrial Silica Sand Market Trend Evolution
- Sri Lanka Industrial Silica Sand Market Drivers and Challenges
- Sri Lanka Industrial Silica Sand Price Trends
- Sri Lanka Industrial Silica Sand Porter's Five Forces
- Sri Lanka Industrial Silica Sand Industry Life Cycle
- Historical Data and Forecast of Sri Lanka Industrial Silica Sand Market Revenues & Volume By Classification for the Period 2018 - 2027
- Historical Data and Forecast of Sri Lanka Industrial Silica Sand Market Revenues & Volume By Less Than 40 Mesh for the Period 2018 - 2027
- Historical Data and Forecast of Sri Lanka Industrial Silica Sand Market Revenues & Volume By 40-70 Mesh for the Period 2018 - 2027
- Historical Data and Forecast of Sri Lanka Industrial Silica Sand Market Revenues & Volume By More Than 70 Mesh for the Period 2018 - 2027
- Historical Data and Forecast of Sri Lanka Industrial Silica Sand Market Revenues & Volume By Application for the Period 2018 - 2027
- Historical Data and Forecast of Sri Lanka Industrial Silica Sand Market Revenues & Volume By Hydraulic Fracturing for the Period 2018 - 2027
- Historical Data and Forecast of Sri Lanka Industrial Silica Sand Market Revenues & Volume By Glassmaking for the Period 2018 - 2027
- Historical Data and Forecast of Sri Lanka Industrial Silica Sand Market Revenues & Volume By Foundry for the Period 2018 - 2027
- Historical Data and Forecast of Sri Lanka Industrial Silica Sand Market Revenues & Volume By Ceramics and Refractories for the Period 2018 - 2027
- Historical Data and Forecast of Sri Lanka Industrial Silica Sand Market Revenues & Volume By Others for the Period 2018 - 2027
- Sri Lanka Industrial Silica Sand Import Export Trade Statistics
- Market Opportunity Assessment By Classification
- Market Opportunity Assessment By Application
- Sri Lanka Industrial Silica Sand Top Companies Market Share
- Sri Lanka Industrial Silica Sand Competitive Benchmarking By Technical and Operational Parameters
- Sri Lanka Industrial Silica Sand Company Profiles
- Sri Lanka Industrial Silica Sand Key Strategic Recommendations
Frequently Asked Questions About the Market Study (FAQs):
6Wresearch actively monitors the Sri Lanka Industrial Silica Sand Market and publishes its comprehensive annual report, highlighting emerging trends, growth drivers, revenue analysis, and forecast outlook. Our insights help businesses to make data-backed strategic decisions with ongoing market dynamics. Our analysts track relevent industries related to the Sri Lanka Industrial Silica Sand Market, allowing our clients with actionable intelligence and reliable forecasts tailored to emerging regional needs.
Yes, we provide customisation as per your requirements. To learn more, feel free to contact us on sales@6wresearch.com
1 Executive Summary |
2 Introduction |
2.1 Key Highlights of the Report |
2.2 Report Description |
2.3 Market Scope & Segmentation |
2.4 Research Methodology |
2.5 Assumptions |
3 Sri Lanka Industrial Silica Sand Market Overview |
3.1 Sri Lanka Country Macro Economic Indicators |
3.2 Sri Lanka Industrial Silica Sand Market Revenues & Volume, 2021 & 2027F |
3.3 Sri Lanka Industrial Silica Sand Market - Industry Life Cycle |
3.4 Sri Lanka Industrial Silica Sand Market - Porter's Five Forces |
3.5 Sri Lanka Industrial Silica Sand Market Revenues & Volume Share, By Classification, 2021 & 2027F |
3.6 Sri Lanka Industrial Silica Sand Market Revenues & Volume Share, By Application, 2021 & 2027F |
4 Sri Lanka Industrial Silica Sand Market Dynamics |
4.1 Impact Analysis |
4.2 Market Drivers |
4.2.1 Growth in construction and infrastructure projects in Sri Lanka |
4.2.2 Increasing demand for glass manufacturing in the region |
4.2.3 Rising use of industrial silica sand in foundry applications |
4.3 Market Restraints |
4.3.1 Fluctuations in raw material prices |
4.3.2 Environmental concerns related to silica sand mining |
4.3.3 Competition from substitutes such as zircon sand and chromite sand |
5 Sri Lanka Industrial Silica Sand Market Trends |
6 Sri Lanka Industrial Silica Sand Market, By Types |
6.1 Sri Lanka Industrial Silica Sand Market, By Classification |
6.1.1 Overview and Analysis |
6.1.2 Sri Lanka Industrial Silica Sand Market Revenues & Volume, By Classification, 2018 - 2027F |
6.1.3 Sri Lanka Industrial Silica Sand Market Revenues & Volume, By Less Than 40 Mesh, 2018 - 2027F |
6.1.4 Sri Lanka Industrial Silica Sand Market Revenues & Volume, By 40-70 Mesh, 2018 - 2027F |
6.1.5 Sri Lanka Industrial Silica Sand Market Revenues & Volume, By More Than 70 Mesh, 2018 - 2027F |
6.2 Sri Lanka Industrial Silica Sand Market, By Application |
6.2.1 Overview and Analysis |
6.2.2 Sri Lanka Industrial Silica Sand Market Revenues & Volume, By Hydraulic Fracturing, 2018 - 2027F |
6.2.3 Sri Lanka Industrial Silica Sand Market Revenues & Volume, By Glassmaking, 2018 - 2027F |
6.2.4 Sri Lanka Industrial Silica Sand Market Revenues & Volume, By Foundry, 2018 - 2027F |
6.2.5 Sri Lanka Industrial Silica Sand Market Revenues & Volume, By Ceramics and Refractories, 2018 - 2027F |
6.2.6 Sri Lanka Industrial Silica Sand Market Revenues & Volume, By Others, 2018 - 2027F |
7 Sri Lanka Industrial Silica Sand Market Import-Export Trade Statistics |
7.1 Sri Lanka Industrial Silica Sand Market Export to Major Countries |
7.2 Sri Lanka Industrial Silica Sand Market Imports from Major Countries |
8 Sri Lanka Industrial Silica Sand Market Key Performance Indicators |
8.1 Average selling price of industrial silica sand |
8.2 Capacity utilization rate of silica sand mining operations |
8.3 Export volume of industrial silica sand |
8.4 Adoption rate of advanced processing technologies in silica sand industry |
8.5 Percentage of industrial silica sand used in high-value applications (e.g., glass manufacturing, foundry applications) |
9 Sri Lanka Industrial Silica Sand Market - Opportunity Assessment |
9.1 Sri Lanka Industrial Silica Sand Market Opportunity Assessment, By Classification, 2021 & 2027F |
9.2 Sri Lanka Industrial Silica Sand Market Opportunity Assessment, By Application, 2021 & 2027F |
10 Sri Lanka Industrial Silica Sand Market - Competitive Landscape |
10.1 Sri Lanka Industrial Silica Sand Market Revenue Share, By Companies, 2021 |
10.2 Sri Lanka Industrial Silica Sand Market Competitive Benchmarking, By Operating and Technical Parameters |
11 Company Profiles |
12 Recommendations |
13 Disclaimer |
Global Go To Market Strategy - 2030
Export potential enables firms to identify high-growth global markets with greater confidence by combining advanced trade intelligence with a structured quantitative methodology. The framework analyzes emerging demand trends and country-level import patterns while integrating macroeconomic and trade datasets such as GDP and population forecasts, bilateral import–export flows, tariff structures, elasticity differentials between developed and developing economies, geographic distance, and import demand projections. Using weighted trade values from 2020–2024 as the base period to project country-to-country export potential for 2030, these inputs are operationalized through calculated drivers such as gravity model parameters, tariff impact factors, and projected GDP per-capita growth. Through an analysis of hidden potentials, demand hotspots, and market conditions that are most favorable to success, this method enables firms to focus on target countries, maximize returns, and global expansion with data, backed by accuracy.
By factoring in the projected importer demand gap that is currently unmet and could be potential opportunity, it identifies the potential for the Exporter (Country) among 190 countries, against the general trade analysis, which identifies the biggest importer or exporter.
To discover high-growth global markets and optimize your business strategy:
Click Here
Pricing
- Single User License$ 1,995
- Department License$ 2,400
- Site License$ 3,120
- Global License$ 3,795

Leadership Perspectives from Industry Events
Search
Thought Leadership and Analyst Meet


Our Clients
6WResearch In News
- India Air Conditioner Market Set for Strong Rebound in 2026 After Weather-Led Correction and GST-Driven Recovery: 6Wresearch
- ADAS in India: How Automatic Emergency Braking, Blind Spot Detection & Driver Monitoring are Transforming Road Safety
- Doha a strategic location for EV manufacturing hub: IPA Qatar
- Demand for luxury TVs surging in the GCC, says Samsung
- Empowering Growth: The Thriving Journey of Bangladesh’s Cable Industry
- Demand for luxury TVs surging in the GCC, says Samsung
Latest Reports
- Nicaragua RPG Gaming Market (2026-2032)
- New Zealand RPG Gaming Market (2026-2032)
- Netherlands RPG Gaming Market (2026-2032)
- Nauru RPG Gaming Market (2026-2032)
- Namibia RPG Gaming Market (2026-2032)
- Mozambique RPG Gaming Market (2026-2032)
- Montenegro RPG Gaming Market (2026-2032)
- Mongolia RPG Gaming Market (2026-2032)
- Monaco RPG Gaming Market (2026-2032)
- Micronesia RPG Gaming Market (2026-2032)
Industry Events and Analyst Meet

EV India Expo 2026

HIMTEX 2026

India Refining Summit 2026

India EV Show 2026

EV tech India Expo 2026
Whitepaper
- Middle East & Africa Commercial Security Market Click here to view more.
- Middle East & Africa Fire Safety Systems & Equipment Market Click here to view more.
- GCC Drone Market Click here to view more.
- Middle East Lighting Fixture Market Click here to view more.
- GCC Physical & Perimeter Security Market Click here to view more.