Sri Lanka Soft Drinks Packaging Market (2026-2032) Outlook | Revenue, Forecast, Companies, Growth, Share, Trends, Value, Analysis, Size & Industry
Market Forecast By Material (Paper, Plastic, Metal, Glass), By Product Type (Cans, Boxes, Bottles, Cartons), By Capacity (Up to 100 ml, 100 to 250 ml, 250 to 500 ml, 500 to 1000 ml, 1000 to 2000 ml, Above 2000 ml), By Application (Carbonated soft drinks, Functional Drinks, Sport Drinks, Energy Drinks, Others, Juices) And Competitive Landscape
| Product Code: ETC189883 | Publication Date: May 2022 | Updated Date: Jun 2026 | Product Type: Market Research Report | |
| Publisher: 6Wresearch | Author: Ravi Bhandari | No. of Pages: 60 | No. of Figures: 40 | No. of Tables: 7 |
Sri Lanka Soft Drinks Packaging Market Size, Share & Growth Rate
The Sri Lanka Soft Drinks Packaging Market was estimated at USD 409 Million in 2025 and is projected to reach USD 580 Million by 2032, growing at a CAGR of 5.1% from 2026 to 2032. This growth trajectory is being fueled by the confluence of increasing urbanization, evolving consumer preferences towards healthier beverage options, and the rising demand for convenient on-the-go packaging solutions. As the market adapts to these trends, companies are increasingly investing in innovative and sustainable packaging materials to attract environmentally conscious consumers.
Sri Lanka Soft Drinks Packaging Market Year-wise Growth Rate and Key Drivers
This graph highlights how the Sri Lanka Soft Drinks Packaging Market has steadily grown over the years, supported by major growth factors.
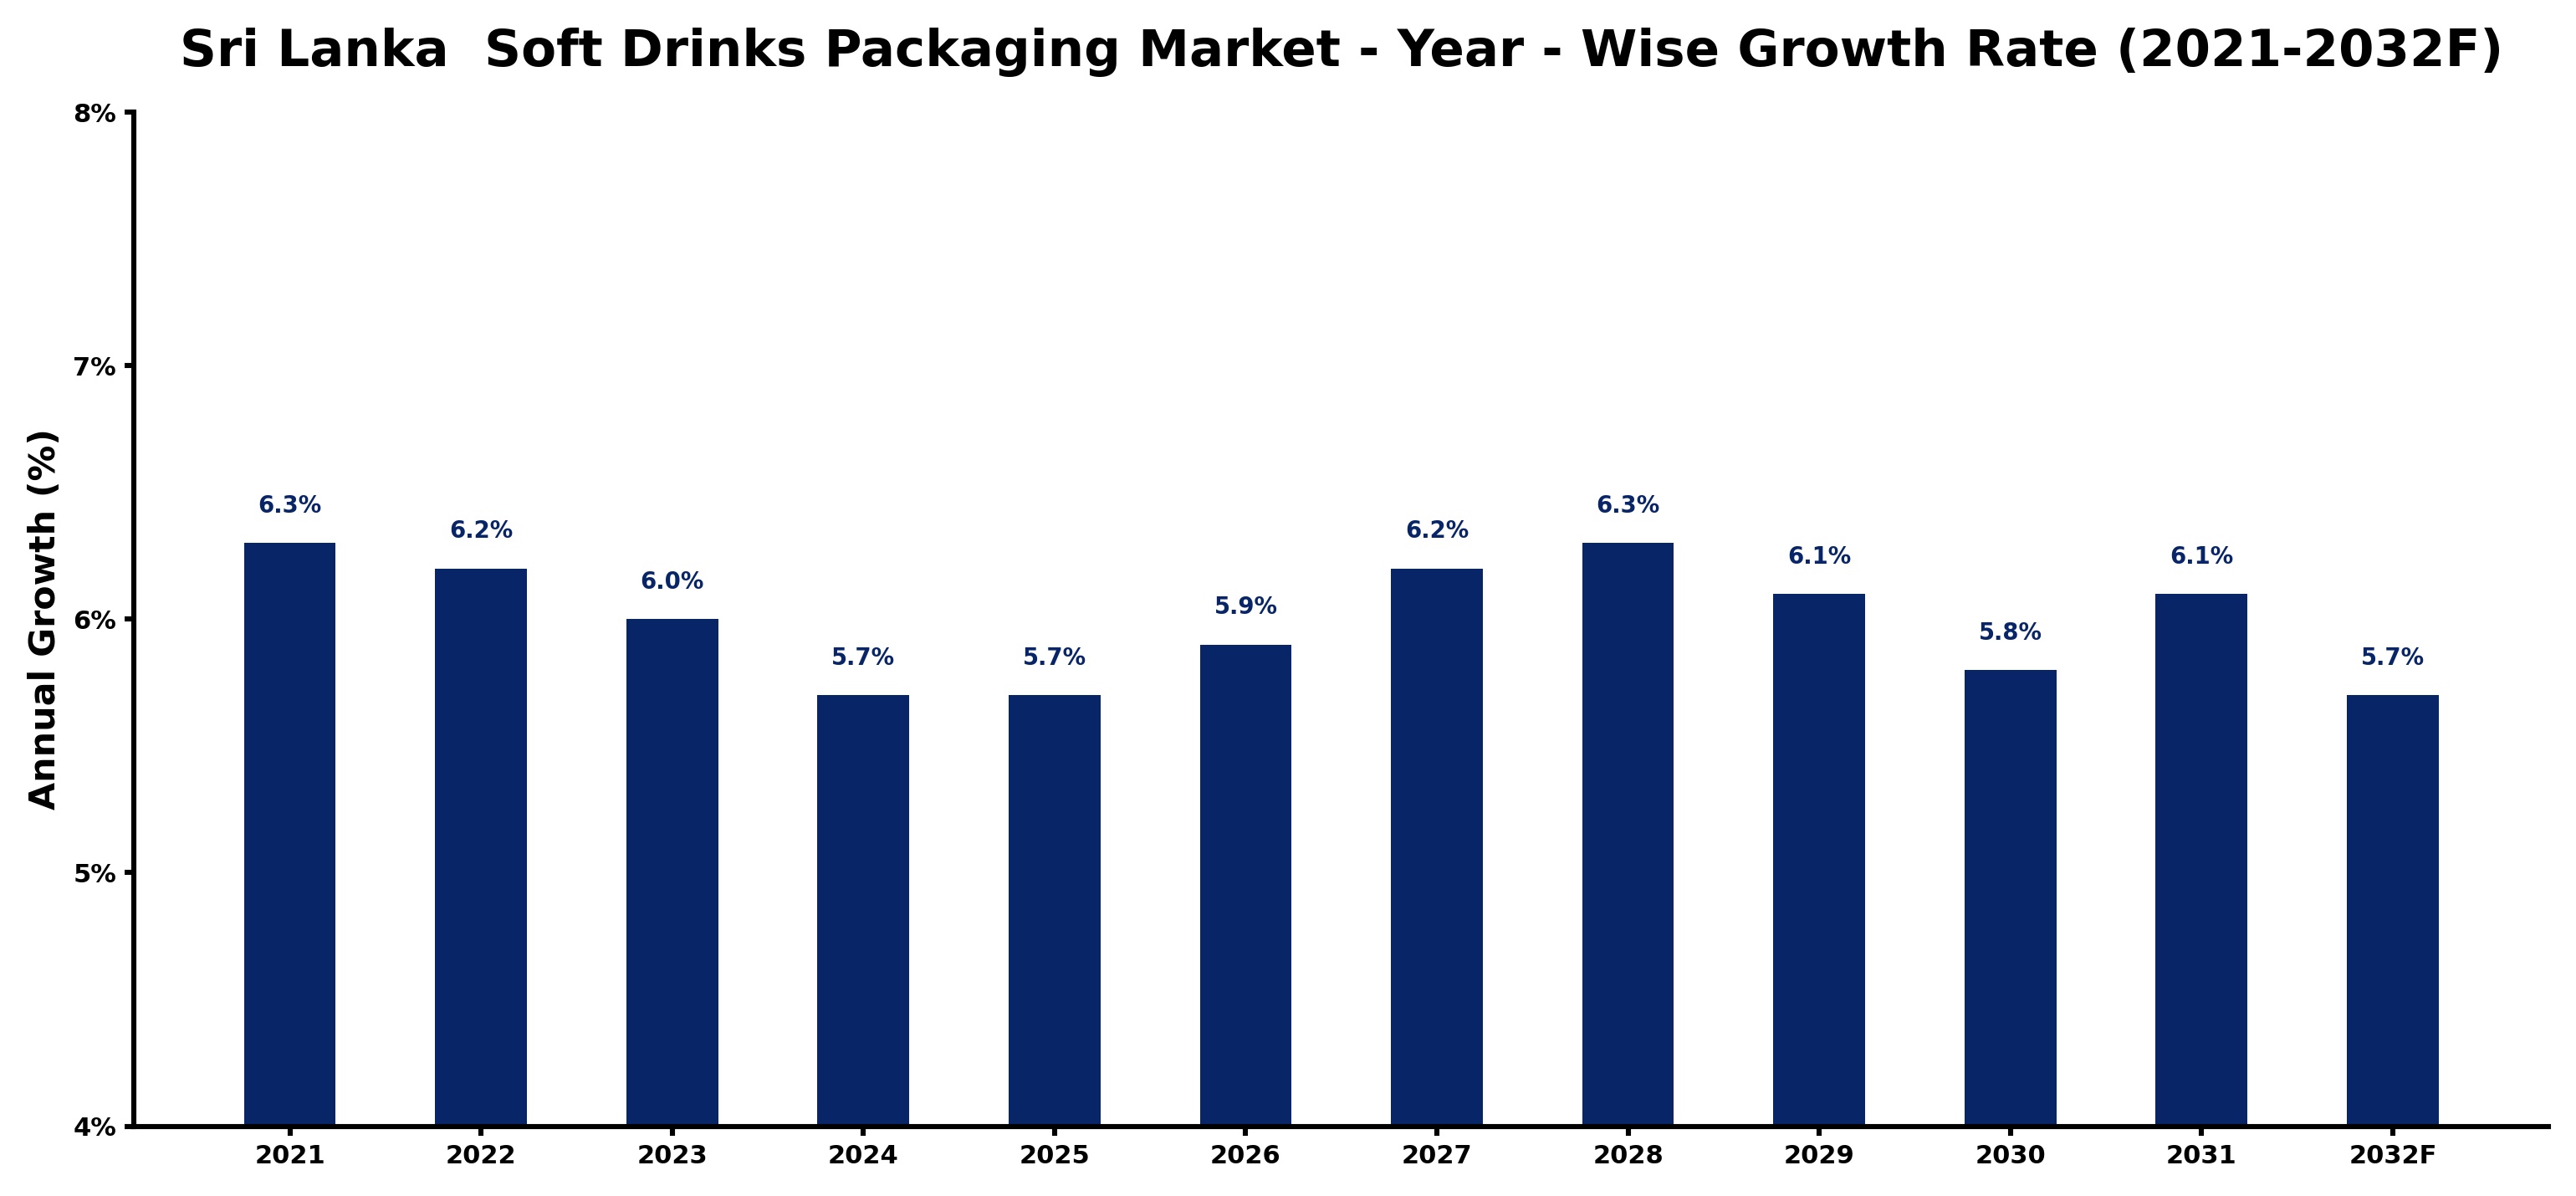
The table below presents the year‑wise growth rates along with the key drivers influencing the market
| Year | Growth Rate | Major Drivers |
| 2021 | 6.3% | Rising consumer demand for beverages |
| 2022 | 6.2% | Increased focus on sustainability initiatives |
| 2023 | 6.0% | Innovative packaging solutions introduced |
| 2024 | 5.7% | Health-conscious product offerings expanded |
| 2025 | 5.7% | E-commerce growth enhanced distribution channels |
| 2026 | 5.9% | Emerging market penetration increased sales |
| 2027 | 6.2% | Brand loyalty programs attracted consumers |
| 2028 | 6.3% | Collaborations with local producers strengthened |
| 2029 | 6.1% | Diversification of flavors attracted interest |
| 2030 | 5.8% | Investment in technology improved efficiency |
| 2031 | 6.1% | Promotional campaigns boosted brand visibility |
| 2032 | 5.7% | Consumer awareness of quality increased |
Note - Market size estimations and growth projections presented in this report are based on 6Wresearch’s advanced forecasting approach, validated with industry datasets as of June 2026.
Sri Lanka Soft Drinks Packaging Market Synopsis
The most significant force currently shaping the Sri Lanka Soft Drinks Packaging Market is the shift towards eco-friendly and sustainable packaging solutions. As consumers become more aware of their environmental impact, there is a pronounced demand for packaging that is recyclable or made from renewable resources, compelling manufacturers to rethink their approaches.
Additionally, the trend of convenience continues to drive market growth. With busy lifestyles becoming the norm, packaging formats that are portable and easy to use, such as PET bottles and cans, are gaining traction among consumers. This shift is pushing brands to innovate in design and functionality.
Sri Lanka Soft Drinks Packaging Market Key Takeaways
- Growing consumer preference for sustainable packaging is transforming the market landscape.
- Convenience and portability remain key drivers of packaging demand in the beverage sector.
- Investment in innovative packaging materials is essential for brands to remain competitive.
- Regulatory policies are increasingly focused on promoting environmental sustainability.
- Collaboration with local manufacturers can yield customized packaging solutions, enhancing market opportunities.
Evaluation of Restraints in Sri Lanka Soft Drinks Packaging Market
Despite its growth potential, the Sri Lanka Soft Drinks Packaging Market faces notable restraints. The increasing competition among beverage companies often leads to pricing pressures, which can impact profit margins. Additionally, the volatility in raw material costs presents a challenge for manufacturers trying to maintain both affordability and quality. Regulatory requirements, particularly around sustainability, further complicate matters, necessitating ongoing adaptations and innovations to meet compliance. As health-conscious trends dominate consumer preferences, there is a pressing need for packaging solutions that align with these values, which may necessitate significant investment in research and development.
Sri Lanka Soft Drinks Packaging Market Trends
Currently, the Sri Lanka Soft Drinks Packaging Market is witnessing a strong movement towards sustainability, with companies increasingly adopting biodegradable materials, recycled PET bottles, and paper-based options. This shift not only caters to environmentally conscious consumers but also aligns with global trends in reducing plastic waste. Furthermore, there's a rising emphasis on product convenience, driving innovations in packaging designs that enhance usability and shelf appeal.
Sri Lanka Soft Drinks Packaging Market Opportunities
Investment opportunities abound in this market, particularly for those focusing on sustainable packaging solutions. Companies that innovate in biodegradable and recyclable materials stand to gain a competitive edge as consumer awareness of environmental issues continues to grow. Furthermore, partnerships with local beverage manufacturers offer an avenue for tailored packaging solutions that can meet specific needs, while advancements in technology provide the potential for enhanced packaging designs that improve shelf life and product safety.
Government Initiatives in the Sri Lanka Soft Drinks Packaging Market
The Sri Lankan government has enacted several policies aimed at regulating the Soft Drinks Packaging Market, including the introduction of a sugar tax on sweetened beverages to encourage healthier consumption habits. Additionally, regulations have been implemented to ensure accurate labeling of soft drink packaging, informing consumers about nutritional content and ingredients. The government also promotes eco-friendly practices by encouraging the use of recyclable materials and implementing restrictions on single-use plastics, thus fostering a market environment focused on sustainability.
Future Insights of the Sri Lanka Soft Drinks Packaging Market
Looking ahead to 2026-2032, the Sri Lanka Soft Drinks Packaging Market is poised for significant growth, driven by a burgeoning population and rising disposable incomes. The shift towards healthier beverage options will continue to be a catalyst for innovation, particularly in sustainable packaging solutions. Moreover, as on-the-go consumption trends gain traction, companies will likely introduce even more innovative packaging formats, while investments in technology for automation and customization will be essential to meet the evolving demands of consumers.
Sri Lanka Soft Drinks Packaging Market Latest Developments (May 2025 - June 2026)
In recent months, the Sri Lanka Soft Drinks Packaging Market has seen a notable increase in the adoption of environmentally friendly packaging solutions. Many companies are exploring new materials and technologies aimed at reducing environmental impact. Additionally, there has been a surge in collaborative efforts among beverage manufacturers to develop customized packaging that caters to changing consumer preferences, enhancing both convenience and sustainability.
Sri Lanka Soft Drinks Packaging Market - Key Attractiveness of the Report
- 10 Years of Market Numbers
- Historical Data Starting from 2022 to 2025
- Base Year: 2025
- Forecast Data until 2032
- Key Performance Indicators Impacting the Market
- Major Upcoming Developments and Projects
Key Highlights of the Report:
- Sri Lanka Soft Drinks Packaging Market Outlook
- Market Size of Sri Lanka Soft Drinks Packaging Market, 2025
- Forecast of Sri Lanka Soft Drinks Packaging Market, 2032
- Historical Data and Forecast of Sri Lanka Soft Drinks Packaging Revenues & Volume for the Period 2022-2032F
- Sri Lanka Soft Drinks Packaging Market Trend Evolution
- Sri Lanka Soft Drinks Packaging Market Drivers and Challenges
- Sri Lanka Soft Drinks Packaging Price Trends
- Sri Lanka Soft Drinks Packaging Porter's Five Forces
- Sri Lanka Soft Drinks Packaging Industry Life Cycle
- Historical Data and Forecast of Sri Lanka Soft Drinks Packaging Market Revenues & Volume By Material for the Period 2022-2032F
- Historical Data and Forecast of Sri Lanka Soft Drinks Packaging Market Revenues & Volume By Paper for the Period 2022-2032F
- Historical Data and Forecast of Sri Lanka Soft Drinks Packaging Market Revenues & Volume By Plastic for the Period 2022-2032F
- Historical Data and Forecast of Sri Lanka Soft Drinks Packaging Market Revenues & Volume By Metal for the Period 2022-2032F
- Historical Data and Forecast of Sri Lanka Soft Drinks Packaging Market Revenues & Volume By Glass for the Period 2022-2032F
- Historical Data and Forecast of Sri Lanka Soft Drinks Packaging Market Revenues & Volume By for the Period 2022-2032F
- Historical Data and Forecast of Sri Lanka Soft Drinks Packaging Market Revenues & Volume By for the Period 2022-2032F
- Historical Data and Forecast of Sri Lanka Soft Drinks Packaging Market Revenues & Volume By Product Type for the Period 2022-2032F
- Historical Data and Forecast of Sri Lanka Soft Drinks Packaging Market Revenues & Volume By Cans for the Period 2022-2032F
- Historical Data and Forecast of Sri Lanka Soft Drinks Packaging Market Revenues & Volume By Boxes for the Period 2022-2032F
- Historical Data and Forecast of Sri Lanka Soft Drinks Packaging Market Revenues & Volume By Bottles for the Period 2022-2032F
- Historical Data and Forecast of Sri Lanka Soft Drinks Packaging Market Revenues & Volume By Cartons for the Period 2022-2032F
- Historical Data and Forecast of Sri Lanka Soft Drinks Packaging Market Revenues & Volume By for the Period 2022-2032F
- Historical Data and Forecast of Sri Lanka Soft Drinks Packaging Market Revenues & Volume By for the Period 2022-2032F
- Historical Data and Forecast of Sri Lanka Soft Drinks Packaging Market Revenues & Volume By Capacity for the Period 2022-2032F
- Historical Data and Forecast of Sri Lanka Soft Drinks Packaging Market Revenues & Volume By Up to 100 ml for the Period 2022-2032F
- Historical Data and Forecast of Sri Lanka Soft Drinks Packaging Market Revenues & Volume By 100 to 250 ml for the Period 2022-2032F
- Historical Data and Forecast of Sri Lanka Soft Drinks Packaging Market Revenues & Volume By 250 to 500 ml for the Period 2022-2032F
- Historical Data and Forecast of Sri Lanka Soft Drinks Packaging Market Revenues & Volume By 500 to 1000 ml for the Period 2022-2032F
- Historical Data and Forecast of Sri Lanka Soft Drinks Packaging Market Revenues & Volume By 1000 to 2000 ml for the Period 2022-2032F
- Historical Data and Forecast of Sri Lanka Soft Drinks Packaging Market Revenues & Volume By Above 2000 ml for the Period 2022-2032F
- Historical Data and Forecast of Sri Lanka Soft Drinks Packaging Market Revenues & Volume By Application for the Period 2022-2032F
- Historical Data and Forecast of Sri Lanka Soft Drinks Packaging Market Revenues & Volume By Carbonated soft drinks for the Period 2022-2032F
- Historical Data and Forecast of Sri Lanka Soft Drinks Packaging Market Revenues & Volume By Functional Drinks for the Period 2022-2032F
- Historical Data and Forecast of Sri Lanka Soft Drinks Packaging Market Revenues & Volume By Sport Drinks for the Period 2022-2032F
- Historical Data and Forecast of Sri Lanka Soft Drinks Packaging Market Revenues & Volume By Energy Drinks for the Period 2022-2032F
- Historical Data and Forecast of Sri Lanka Soft Drinks Packaging Market Revenues & Volume By Others for the Period 2022-2032F
- Historical Data and Forecast of Sri Lanka Soft Drinks Packaging Market Revenues & Volume By Juices for the Period 2022-2032F
- Sri Lanka Soft Drinks Packaging Import Export Trade Statistics
- Market Opportunity Assessment By Material
- Market Opportunity Assessment By Product Type
- Market Opportunity Assessment By Capacity
- Market Opportunity Assessment By Application
- Sri Lanka Soft Drinks Packaging Top Companies Market Share
- Sri Lanka Soft Drinks Packaging Competitive Benchmarking By Technical and Operational Parameters
- Sri Lanka Soft Drinks Packaging Company Profiles
- Sri Lanka Soft Drinks Packaging Key Strategic Recommendations
Sri Lanka Soft Drinks Packaging Market - Frequently Asked Questions
The Sri Lanka Soft Drinks Packaging Market is estimated to be USD 409 Million in 2025 and is projected to grow to USD 580 Million by 2032, at a CAGR of 5.1% from 2026 to 2032.
The main trends include a growing preference for sustainable packaging, increased demand for convenient on-the-go packaging, and a shift towards healthier beverage options, all influencing the types of materials and designs used.
Government initiatives, such as the sugar tax and regulations promoting eco-friendly practices, are reshaping the market by encouraging companies to adopt sustainable packaging solutions and informing consumers about product contents.
Opportunities lie in developing innovative sustainable packaging materials, forming partnerships with local manufacturers, and leveraging technology to enhance packaging safety and shelf life.
Companies are grappling with pricing pressures due to increased competition, fluctuations in raw material costs, and the ongoing need to comply with stringent sustainability regulations.
6Wresearch actively monitors the Sri Lanka Soft Drinks Packaging Market and publishes its comprehensive annual report, highlighting emerging trends, growth drivers, revenue analysis, and forecast outlook. Our insights help businesses to make data-backed strategic decisions with ongoing market dynamics. Our analysts track relevent industries related to the Sri Lanka Soft Drinks Packaging Market, allowing our clients with actionable intelligence and reliable forecasts tailored to emerging regional needs.
Yes, we provide customisation as per your requirements. To learn more, feel free to contact us on sales@6wresearch.com
1 Executive Summary |
2 Introduction |
2.1 Key Highlights of the Report |
2.2 Report Description |
2.3 Market Scope & Segmentation |
2.4 Research Methodology |
2.5 Assumptions |
3 Sri Lanka Soft Drinks Packaging Market Overview |
3.1 Sri Lanka Country Macro Economic Indicators |
3.2 Sri Lanka Soft Drinks Packaging Market Revenues & Volume, 2022 & 2032F |
3.3 Sri Lanka Soft Drinks Packaging Market - Industry Life Cycle |
3.4 Sri Lanka Soft Drinks Packaging Market - Porter's Five Forces |
3.5 Sri Lanka Soft Drinks Packaging Market Revenues & Volume Share, By Material, 2022 & 2032F |
3.6 Sri Lanka Soft Drinks Packaging Market Revenues & Volume Share, By Product Type, 2022 & 2032F |
3.7 Sri Lanka Soft Drinks Packaging Market Revenues & Volume Share, By Capacity, 2022 & 2032F |
3.8 Sri Lanka Soft Drinks Packaging Market Revenues & Volume Share, By Application, 2022 & 2032F |
4 Sri Lanka Soft Drinks Packaging Market Dynamics |
4.1 Impact Analysis |
4.2 Market Drivers |
4.2.1 Increasing demand for convenience and on-the-go consumption |
4.2.2 Growing awareness about health and wellness leading to higher demand for healthier beverage options |
4.2.3 Rising disposable incomes and changing lifestyles driving consumption of soft drinks |
4.3 Market Restraints |
4.3.1 Stringent regulations on packaging materials and recycling practices |
4.3.2 Fluctuating raw material prices impacting production costs |
4.3.3 Growing environmental concerns leading to a shift towards sustainable packaging solutions |
5 Sri Lanka Soft Drinks Packaging Market Trends |
6 Sri Lanka Soft Drinks Packaging Market, By Types |
6.1 Sri Lanka Soft Drinks Packaging Market, By Material |
6.1.1 Overview and Analysis |
6.1.2 Sri Lanka Soft Drinks Packaging Market Revenues & Volume, By Material, 2022-2032F |
6.1.3 Sri Lanka Soft Drinks Packaging Market Revenues & Volume, By Paper, 2022-2032F |
6.1.4 Sri Lanka Soft Drinks Packaging Market Revenues & Volume, By Plastic, 2022-2032F |
6.1.5 Sri Lanka Soft Drinks Packaging Market Revenues & Volume, By Metal, 2022-2032F |
6.1.6 Sri Lanka Soft Drinks Packaging Market Revenues & Volume, By Glass, 2022-2032F |
6.1.7 Sri Lanka Soft Drinks Packaging Market Revenues & Volume, By , 2022-2032F |
6.1.8 Sri Lanka Soft Drinks Packaging Market Revenues & Volume, By , 2022-2032F |
6.2 Sri Lanka Soft Drinks Packaging Market, By Product Type |
6.2.1 Overview and Analysis |
6.2.2 Sri Lanka Soft Drinks Packaging Market Revenues & Volume, By Cans, 2022-2032F |
6.2.3 Sri Lanka Soft Drinks Packaging Market Revenues & Volume, By Boxes, 2022-2032F |
6.2.4 Sri Lanka Soft Drinks Packaging Market Revenues & Volume, By Bottles, 2022-2032F |
6.2.5 Sri Lanka Soft Drinks Packaging Market Revenues & Volume, By Cartons, 2022-2032F |
6.2.6 Sri Lanka Soft Drinks Packaging Market Revenues & Volume, By , 2022-2032F |
6.2.7 Sri Lanka Soft Drinks Packaging Market Revenues & Volume, By , 2022-2032F |
6.3 Sri Lanka Soft Drinks Packaging Market, By Capacity |
6.3.1 Overview and Analysis |
6.3.2 Sri Lanka Soft Drinks Packaging Market Revenues & Volume, By Up to 100 ml, 2022-2032F |
6.3.3 Sri Lanka Soft Drinks Packaging Market Revenues & Volume, By 100 to 250 ml, 2022-2032F |
6.3.4 Sri Lanka Soft Drinks Packaging Market Revenues & Volume, By 250 to 500 ml, 2022-2032F |
6.3.5 Sri Lanka Soft Drinks Packaging Market Revenues & Volume, By 500 to 1000 ml, 2022-2032F |
6.3.6 Sri Lanka Soft Drinks Packaging Market Revenues & Volume, By 1000 to 2000 ml, 2022-2032F |
6.3.7 Sri Lanka Soft Drinks Packaging Market Revenues & Volume, By Above 2000 ml, 2022-2032F |
6.4 Sri Lanka Soft Drinks Packaging Market, By Application |
6.4.1 Overview and Analysis |
6.4.2 Sri Lanka Soft Drinks Packaging Market Revenues & Volume, By Carbonated soft drinks, 2022-2032F |
6.4.3 Sri Lanka Soft Drinks Packaging Market Revenues & Volume, By Functional Drinks, 2022-2032F |
6.4.4 Sri Lanka Soft Drinks Packaging Market Revenues & Volume, By Sport Drinks, 2022-2032F |
6.4.5 Sri Lanka Soft Drinks Packaging Market Revenues & Volume, By Energy Drinks, 2022-2032F |
6.4.6 Sri Lanka Soft Drinks Packaging Market Revenues & Volume, By Others, 2022-2032F |
6.4.7 Sri Lanka Soft Drinks Packaging Market Revenues & Volume, By Juices, 2022-2032F |
7 Sri Lanka Soft Drinks Packaging Market Import-Export Trade Statistics |
7.1 Sri Lanka Soft Drinks Packaging Market Export to Major Countries |
7.2 Sri Lanka Soft Drinks Packaging Market Imports from Major Countries |
8 Sri Lanka Soft Drinks Packaging Market Key Performance Indicators |
8.1 Percentage of soft drinks packaged in eco-friendly materials |
8.2 Number of new product launches in the soft drinks segment |
8.3 Consumer perception and preference towards sustainable packaging options |
9 Sri Lanka Soft Drinks Packaging Market - Opportunity Assessment |
9.1 Sri Lanka Soft Drinks Packaging Market Opportunity Assessment, By Material, 2022 & 2032F |
9.2 Sri Lanka Soft Drinks Packaging Market Opportunity Assessment, By Product Type, 2022 & 2032F |
9.3 Sri Lanka Soft Drinks Packaging Market Opportunity Assessment, By Capacity, 2022 & 2032F |
9.4 Sri Lanka Soft Drinks Packaging Market Opportunity Assessment, By Application, 2022 & 2032F |
10 Sri Lanka Soft Drinks Packaging Market - Competitive Landscape |
10.1 Sri Lanka Soft Drinks Packaging Market Revenue Share, By Companies, 2025 |
10.2 Sri Lanka Soft Drinks Packaging Market Competitive Benchmarking, By Operating and Technical Parameters |
11 Company Profiles |
12 Recommendations |
13 Disclaimer |
Global Go To Market Strategy - 2030
Export potential enables firms to identify high-growth global markets with greater confidence by combining advanced trade intelligence with a structured quantitative methodology. The framework analyzes emerging demand trends and country-level import patterns while integrating macroeconomic and trade datasets such as GDP and population forecasts, bilateral import–export flows, tariff structures, elasticity differentials between developed and developing economies, geographic distance, and import demand projections. Using weighted trade values from 2020–2024 as the base period to project country-to-country export potential for 2030, these inputs are operationalized through calculated drivers such as gravity model parameters, tariff impact factors, and projected GDP per-capita growth. Through an analysis of hidden potentials, demand hotspots, and market conditions that are most favorable to success, this method enables firms to focus on target countries, maximize returns, and global expansion with data, backed by accuracy.
By factoring in the projected importer demand gap that is currently unmet and could be potential opportunity, it identifies the potential for the Exporter (Country) among 190 countries, against the general trade analysis, which identifies the biggest importer or exporter.
To discover high-growth global markets and optimize your business strategy:
Click Here
Pricing
- Single User License$ 1,995
- Department License$ 2,400
- Site License$ 3,120
- Global License$ 3,795

Leadership Perspectives from Industry Events
Search
Thought Leadership and Analyst Meet


Our Clients
6WResearch In News
- India Air Conditioner Market Set for Strong Rebound in 2026 After Weather-Led Correction and GST-Driven Recovery: 6Wresearch
- ADAS in India: How Automatic Emergency Braking, Blind Spot Detection & Driver Monitoring are Transforming Road Safety
- Doha a strategic location for EV manufacturing hub: IPA Qatar
- Demand for luxury TVs surging in the GCC, says Samsung
- Empowering Growth: The Thriving Journey of Bangladesh’s Cable Industry
- Demand for luxury TVs surging in the GCC, says Samsung
Latest Reports
- Nicaragua RPG Gaming Market (2026-2032)
- New Zealand RPG Gaming Market (2026-2032)
- Netherlands RPG Gaming Market (2026-2032)
- Nauru RPG Gaming Market (2026-2032)
- Namibia RPG Gaming Market (2026-2032)
- Mozambique RPG Gaming Market (2026-2032)
- Montenegro RPG Gaming Market (2026-2032)
- Mongolia RPG Gaming Market (2026-2032)
- Monaco RPG Gaming Market (2026-2032)
- Micronesia RPG Gaming Market (2026-2032)
Industry Events and Analyst Meet

EV India Expo 2026

HIMTEX 2026

India Refining Summit 2026

India EV Show 2026

EV tech India Expo 2026
Whitepaper
- Middle East & Africa Commercial Security Market Click here to view more.
- Middle East & Africa Fire Safety Systems & Equipment Market Click here to view more.
- GCC Drone Market Click here to view more.
- Middle East Lighting Fixture Market Click here to view more.
- GCC Physical & Perimeter Security Market Click here to view more.