Sweden LNG as a Fuel Market (2026-2032) | Competitive, Growth, Analysis, Investment Trends, Trends, Size, Outlook, Competition, Restraints, Challenges, Value, Segments, Companies, Demand, Drivers, Strategic Insights, Supply, Share, Industry, Strategy, Opportunities, Revenue, Consumer Insights, Forecast, Pricing Analysis, Segmentation
Market Forecast By Application (Power Generation, Transportation, Industrial Processes, Residential Heating), By Technology Type (Combined Cycle Gas Turbines, LNG-Fueled Engines, Direct Use in Manufacturing, Domestic Heating Systems), By End User (Utilities, Maritime Industry, Manufacturing Plants, Households), By Product Type (LNG-Fueled Power Plants, LNG-Powered Vessels, LNG-Fueled Industrial Boilers, LNG Heating Units) And Competitive Landscape
| Product Code: ETC12563371 | Publication Date: Apr 2025 | Updated Date: Apr 2026 | Product Type: Market Research Report | |
| Publisher: 6Wresearch | Author: Sachin Kumar Rai | No. of Pages: 65 | No. of Figures: 34 | No. of Tables: 19 |
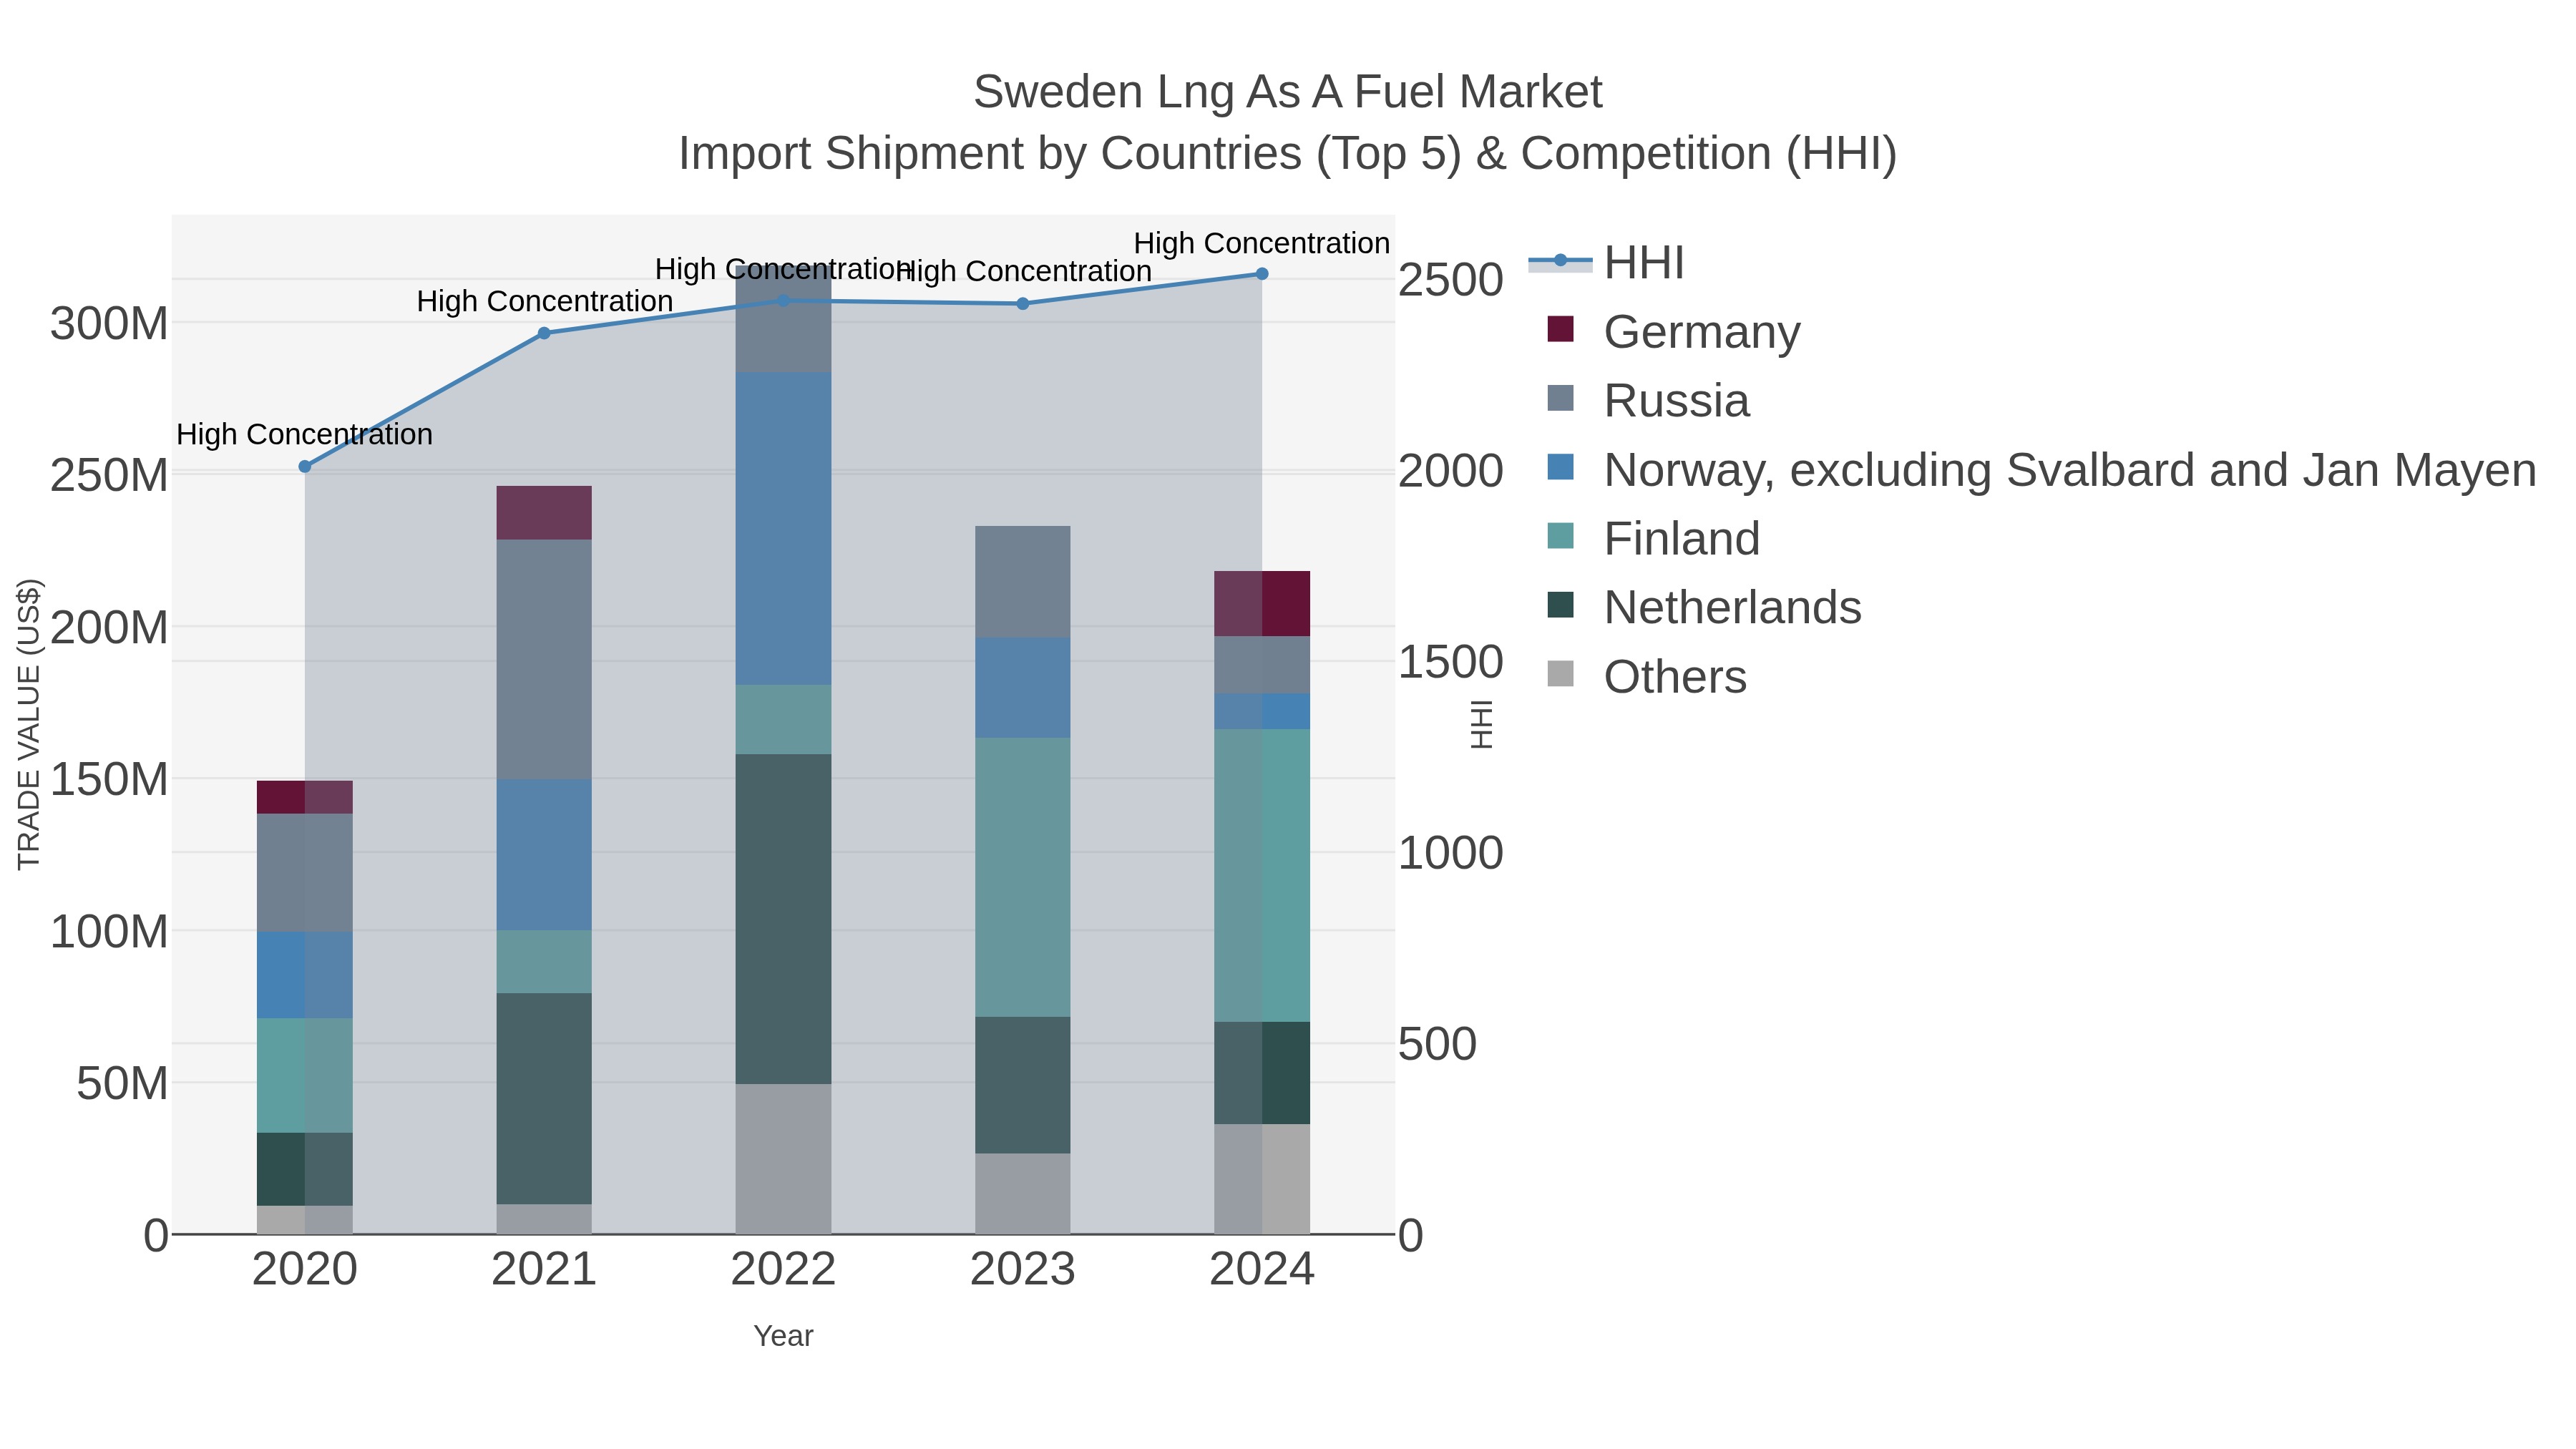
Sweden Lng As A Fuel Market Top 5 Importing Countries and Market Competition (HHI) Analysis
Despite a slight decrease in growth rate from 2023 to 2024, Sweden continues to rely on LNG imports as a key fuel source. With the top exporting countries being Finland, Netherlands, Lithuania, Germany, and Russia, the market remains concentrated with a high HHI in 2024. The impressive compound annual growth rate (CAGR) of 9.95% from 2020 to 2024 indicates a steady increase in demand for LNG as a fuel in Sweden. Continued monitoring of market dynamics and regulatory developments will be crucial for stakeholders in the LNG industry.
Key Highlights of the Report:
- Sweden LNG as a Fuel Market Outlook
- Market Size of Sweden LNG as a Fuel Market, 2025
- Forecast of Sweden LNG as a Fuel Market, 2032
- Historical Data and Forecast of Sweden LNG as a Fuel Revenues & Volume for the Period 2022 - 2032F
- Sweden LNG as a Fuel Market Trend Evolution
- Sweden LNG as a Fuel Market Drivers and Challenges
- Sweden LNG as a Fuel Price Trends
- Sweden LNG as a Fuel Porter's Five Forces
- Sweden LNG as a Fuel Industry Life Cycle
- Historical Data and Forecast of Sweden LNG as a Fuel Market Revenues & Volume By Application for the Period 2022 - 2032F
- Historical Data and Forecast of Sweden LNG as a Fuel Market Revenues & Volume By Power Generation for the Period 2022 - 2032F
- Historical Data and Forecast of Sweden LNG as a Fuel Market Revenues & Volume By Transportation for the Period 2022 - 2032F
- Historical Data and Forecast of Sweden LNG as a Fuel Market Revenues & Volume By Industrial Processes for the Period 2022 - 2032F
- Historical Data and Forecast of Sweden LNG as a Fuel Market Revenues & Volume By Residential Heating for the Period 2022 - 2032F
- Historical Data and Forecast of Sweden LNG as a Fuel Market Revenues & Volume By Technology Type for the Period 2022 - 2032F
- Historical Data and Forecast of Sweden LNG as a Fuel Market Revenues & Volume By Combined Cycle Gas Turbines for the Period 2022 - 2032F
- Historical Data and Forecast of Sweden LNG as a Fuel Market Revenues & Volume By LNG-Fueled Engines for the Period 2022 - 2032F
- Historical Data and Forecast of Sweden LNG as a Fuel Market Revenues & Volume By Direct Use in Manufacturing for the Period 2022 - 2032F
- Historical Data and Forecast of Sweden LNG as a Fuel Market Revenues & Volume By Domestic Heating Systems for the Period 2022 - 2032F
- Historical Data and Forecast of Sweden LNG as a Fuel Market Revenues & Volume By End User for the Period 2022 - 2032F
- Historical Data and Forecast of Sweden LNG as a Fuel Market Revenues & Volume By Utilities for the Period 2022 - 2032F
- Historical Data and Forecast of Sweden LNG as a Fuel Market Revenues & Volume By Maritime Industry for the Period 2022 - 2032F
- Historical Data and Forecast of Sweden LNG as a Fuel Market Revenues & Volume By Manufacturing Plants for the Period 2022 - 2032F
- Historical Data and Forecast of Sweden LNG as a Fuel Market Revenues & Volume By Households for the Period 2022 - 2032F
- Historical Data and Forecast of Sweden LNG as a Fuel Market Revenues & Volume By Product Type for the Period 2022 - 2032F
- Historical Data and Forecast of Sweden LNG as a Fuel Market Revenues & Volume By LNG-Fueled Power Plants for the Period 2022 - 2032F
- Historical Data and Forecast of Sweden LNG as a Fuel Market Revenues & Volume By LNG-Powered Vessels for the Period 2022 - 2032F
- Historical Data and Forecast of Sweden LNG as a Fuel Market Revenues & Volume By LNG-Fueled Industrial Boilers for the Period 2022 - 2032F
- Historical Data and Forecast of Sweden LNG as a Fuel Market Revenues & Volume By LNG Heating Units for the Period 2022 - 2032F
- Sweden LNG as a Fuel Import Export Trade Statistics
- Market Opportunity Assessment By Application
- Market Opportunity Assessment By Technology Type
- Market Opportunity Assessment By End User
- Market Opportunity Assessment By Product Type
- Sweden LNG as a Fuel Top Companies Market Share
- Sweden LNG as a Fuel Competitive Benchmarking By Technical and Operational Parameters
- Sweden LNG as a Fuel Company Profiles
- Sweden LNG as a Fuel Key Strategic Recommendations
Frequently Asked Questions About the Market Study (FAQs):
6Wresearch actively monitors the Sweden LNG as a Fuel Market and publishes its comprehensive annual report, highlighting emerging trends, growth drivers, revenue analysis, and forecast outlook. Our insights help businesses to make data-backed strategic decisions with ongoing market dynamics. Our analysts track relevent industries related to the Sweden LNG as a Fuel Market, allowing our clients with actionable intelligence and reliable forecasts tailored to emerging regional needs.
Yes, we provide customisation as per your requirements. To learn more, feel free to contact us on sales@6wresearch.com
1 Executive Summary |
2 Introduction |
2.1 Key Highlights of the Report |
2.2 Report Description |
2.3 Market Scope & Segmentation |
2.4 Research Methodology |
2.5 Assumptions |
3 Sweden LNG as a Fuel Market Overview |
3.1 Sweden Country Macro Economic Indicators |
3.2 Sweden LNG as a Fuel Market Revenues & Volume, 2022 & 2032F |
3.3 Sweden LNG as a Fuel Market - Industry Life Cycle |
3.4 Sweden LNG as a Fuel Market - Porter's Five Forces |
3.5 Sweden LNG as a Fuel Market Revenues & Volume Share, By Application, 2022 & 2032F |
3.6 Sweden LNG as a Fuel Market Revenues & Volume Share, By Technology Type, 2022 & 2032F |
3.7 Sweden LNG as a Fuel Market Revenues & Volume Share, By End User, 2022 & 2032F |
3.8 Sweden LNG as a Fuel Market Revenues & Volume Share, By Product Type, 2022 & 2032F |
4 Sweden LNG as a Fuel Market Dynamics |
4.1 Impact Analysis |
4.2 Market Drivers |
4.2.1 Environmental regulations favoring cleaner fuel alternatives |
4.2.2 Increasing focus on reducing carbon emissions in the transportation sector |
4.2.3 Growing availability and infrastructure for LNG refueling stations |
4.3 Market Restraints |
4.3.1 High initial investment costs for building LNG infrastructure |
4.3.2 Limited LNG supply chain and distribution network in Sweden |
4.3.3 Competition from other alternative fuels like electric and hydrogen |
5 Sweden LNG as a Fuel Market Trends |
6 Sweden LNG as a Fuel Market, By Types |
6.1 Sweden LNG as a Fuel Market, By Application |
6.1.1 Overview and Analysis |
6.1.2 Sweden LNG as a Fuel Market Revenues & Volume, By Application, 2022 - 2032F |
6.1.3 Sweden LNG as a Fuel Market Revenues & Volume, By Power Generation, 2022 - 2032F |
6.1.4 Sweden LNG as a Fuel Market Revenues & Volume, By Transportation, 2022 - 2032F |
6.1.5 Sweden LNG as a Fuel Market Revenues & Volume, By Industrial Processes, 2022 - 2032F |
6.1.6 Sweden LNG as a Fuel Market Revenues & Volume, By Residential Heating, 2022 - 2032F |
6.2 Sweden LNG as a Fuel Market, By Technology Type |
6.2.1 Overview and Analysis |
6.2.2 Sweden LNG as a Fuel Market Revenues & Volume, By Combined Cycle Gas Turbines, 2022 - 2032F |
6.2.3 Sweden LNG as a Fuel Market Revenues & Volume, By LNG-Fueled Engines, 2022 - 2032F |
6.2.4 Sweden LNG as a Fuel Market Revenues & Volume, By Direct Use in Manufacturing, 2022 - 2032F |
6.2.5 Sweden LNG as a Fuel Market Revenues & Volume, By Domestic Heating Systems, 2022 - 2032F |
6.3 Sweden LNG as a Fuel Market, By End User |
6.3.1 Overview and Analysis |
6.3.2 Sweden LNG as a Fuel Market Revenues & Volume, By Utilities, 2022 - 2032F |
6.3.3 Sweden LNG as a Fuel Market Revenues & Volume, By Maritime Industry, 2022 - 2032F |
6.3.4 Sweden LNG as a Fuel Market Revenues & Volume, By Manufacturing Plants, 2022 - 2032F |
6.3.5 Sweden LNG as a Fuel Market Revenues & Volume, By Households, 2022 - 2032F |
6.4 Sweden LNG as a Fuel Market, By Product Type |
6.4.1 Overview and Analysis |
6.4.2 Sweden LNG as a Fuel Market Revenues & Volume, By LNG-Fueled Power Plants, 2022 - 2032F |
6.4.3 Sweden LNG as a Fuel Market Revenues & Volume, By LNG-Powered Vessels, 2022 - 2032F |
6.4.4 Sweden LNG as a Fuel Market Revenues & Volume, By LNG-Fueled Industrial Boilers, 2022 - 2032F |
6.4.5 Sweden LNG as a Fuel Market Revenues & Volume, By LNG Heating Units, 2022 - 2032F |
7 Sweden LNG as a Fuel Market Import-Export Trade Statistics |
7.1 Sweden LNG as a Fuel Market Export to Major Countries |
7.2 Sweden LNG as a Fuel Market Imports from Major Countries |
8 Sweden LNG as a Fuel Market Key Performance Indicators |
8.1 Number of new LNG refueling stations opened in Sweden |
8.2 Growth in the adoption of LNG-powered vehicles in the transportation sector |
8.3 Investment in research and development for improving LNG technology |
8.4 Carbon emissions reduction attributed to the use of LNG as a fuel |
8.5 Government incentives and policies supporting the development of the LNG market |
9 Sweden LNG as a Fuel Market - Opportunity Assessment |
9.1 Sweden LNG as a Fuel Market Opportunity Assessment, By Application, 2022 & 2032F |
9.2 Sweden LNG as a Fuel Market Opportunity Assessment, By Technology Type, 2022 & 2032F |
9.3 Sweden LNG as a Fuel Market Opportunity Assessment, By End User, 2022 & 2032F |
9.4 Sweden LNG as a Fuel Market Opportunity Assessment, By Product Type, 2022 & 2032F |
10 Sweden LNG as a Fuel Market - Competitive Landscape |
10.1 Sweden LNG as a Fuel Market Revenue Share, By Companies, 2025 |
10.2 Sweden LNG as a Fuel Market Competitive Benchmarking, By Operating and Technical Parameters |
11 Company Profiles |
12 Recommendations |
13 Disclaimer |
Export potential assessment - trade Analytics for 2030
Export potential enables firms to identify high-growth global markets with greater confidence by combining advanced trade intelligence with a structured quantitative methodology. The framework analyzes emerging demand trends and country-level import patterns while integrating macroeconomic and trade datasets such as GDP and population forecasts, bilateral import–export flows, tariff structures, elasticity differentials between developed and developing economies, geographic distance, and import demand projections. Using weighted trade values from 2020–2024 as the base period to project country-to-country export potential for 2030, these inputs are operationalized through calculated drivers such as gravity model parameters, tariff impact factors, and projected GDP per-capita growth. Through an analysis of hidden potentials, demand hotspots, and market conditions that are most favorable to success, this method enables firms to focus on target countries, maximize returns, and global expansion with data, backed by accuracy.
By factoring in the projected importer demand gap that is currently unmet and could be potential opportunity, it identifies the potential for the Exporter (Country) among 190 countries, against the general trade analysis, which identifies the biggest importer or exporter.
To discover high-growth global markets and optimize your business strategy:
Click Here
Pricing
- Single User License$ 1,995
- Department License$ 2,400
- Site License$ 3,120
- Global License$ 3,795

Search
Thought Leadership and Analyst Meet


Our Clients
Latest Reports
- United Kingdom (UK) Outdoor Cooking Equipment Market (2026-2032) | Investment Opportunities, Outlook, Growth, Competition, Trends, Pricing, Demand, Insights, Challenges, Drivers, Size, Restraints, segmentation, Value, Share, Forecast, Companies, Analysis, Revenue, Strategy
- United Arab Emirates (UAE) Outdoor Cooking Equipment Market (2026-2032) | Challenges, Value, Restraints, Growth, Competition, Revenue, Trends, Outlook, Analysis, Drivers, Share, Investment Opportunities, Strategy, Demand, Companies, Forecast, Pricing, segmentation, Size, Insights
- Vietnam Outdoor Cooking Equipment Market (2026-2032) | Demand, Investment Opportunities, Growth, Pricing, Trends, Restraints, Competition, Outlook, Drivers, Strategy, Challenges, Revenue, Analysis, segmentation, Value, Size, Share, Insights, Companies, Forecast
- Venezuela Outdoor Cooking Equipment Market (2026-2032) | Challenges, Revenue, Demand, Value, Pricing, Strategy, Competition, Analysis, Companies, Insights, Growth, Outlook, Forecast, Size, Restraints, segmentation, Drivers, Trends, Investment Opportunities, Share
- Uganda Outdoor Cooking Equipment Market (2026-2032) | Drivers, Pricing, Challenges, Value, Growth, Companies, segmentation, Strategy, Analysis, Demand, Outlook, Size, Competition, Restraints, Revenue, Forecast, Investment Opportunities, Insights, Trends, Share
- Turkey Outdoor Cooking Equipment Market (2026-2032) | Size, Competition, Outlook, Strategy, Forecast, Drivers, Trends, Companies, Revenue, Growth, Analysis, segmentation, Insights, Pricing, Restraints, Demand, Investment Opportunities, Value, Share, Challenges
- Tunisia Outdoor Cooking Equipment Market (2026-2032) | Analysis, Share, Pricing, Trends, Size, Outlook, Revenue, segmentation, Demand, Insights, Investment Opportunities, Restraints, Growth, Forecast, Competition, Drivers, Challenges, Companies, Strategy, Value
- Thailand Outdoor Cooking Equipment Market (2026-2032) | Growth, Revenue, Insights, Companies, Drivers, Strategy, Forecast, Size, Analysis, segmentation, Trends, Challenges, Competition, Share, Investment Opportunities, Demand, Pricing, Value, Restraints, Outlook
- Tanzania Outdoor Cooking Equipment Market (2026-2032) | Share, Drivers, Forecast, Revenue, Growth, Outlook, Analysis, Investment Opportunities, Restraints, segmentation, Demand, Pricing, Size, Insights, Challenges, Competition, Companies, Value, Trends, Strategy
- Tajikistan Outdoor Cooking Equipment Market (2026-2032) | Value, Pricing, Companies, Share, Strategy, Revenue, Investment Opportunities, Demand, Forecast, Size, Competition, Challenges, Growth, Insights, Restraints, segmentation, Analysis, Trends, Drivers, Outlook
Industry Events and Analyst Meet

HIMTEX 2026

India Refining Summit 2026

India EV Show 2026

EV tech India Expo 2026

Auto Tech Asia 2026
Whitepaper
- Middle East & Africa Commercial Security Market Click here to view more.
- Middle East & Africa Fire Safety Systems & Equipment Market Click here to view more.
- GCC Drone Market Click here to view more.
- Middle East Lighting Fixture Market Click here to view more.
- GCC Physical & Perimeter Security Market Click here to view more.
6WResearch In News
- Doha a strategic location for EV manufacturing hub: IPA Qatar
- Demand for luxury TVs surging in the GCC, says Samsung
- Empowering Growth: The Thriving Journey of Bangladesh’s Cable Industry
- Demand for luxury TVs surging in the GCC, says Samsung
- Video call with a traditional healer? Once unthinkable, it’s now common in South Africa
- Intelligent Buildings To Smooth GCC’s Path To Net Zero