Sweden NFC Juice Market (2026-2032) | Strategy, Outlook, Challenges, Companies, Industry, Demand, Competition, Share, Segments, Supply, Segmentation, Size, Competitive, Growth, Consumer Insights, Forecast, Restraints, Trends, Pricing Analysis, Drivers, Investment Trends, Analysis, Strategic Insights, Revenue, Value, Opportunities
Market Forecast By Product Type (Orange Juice, Apple Juice, Pineapple Juice, Mixed Fruit Juice), By Packaging Type (Bottles, Cartons, Cans, Pouches), By Distribution Channel (Supermarkets, Convenience Stores, Online Retail, Specialty Stores, Food Service) And Competitive Landscape
| Product Code: ETC12747691 | Publication Date: Apr 2025 | Updated Date: Apr 2026 | Product Type: Market Research Report | |
| Publisher: 6Wresearch | Author: Sachin Kumar Rai | No. of Pages: 65 | No. of Figures: 34 | No. of Tables: 19 |
Sweden Nfc Juice Market Size (2020-2030)
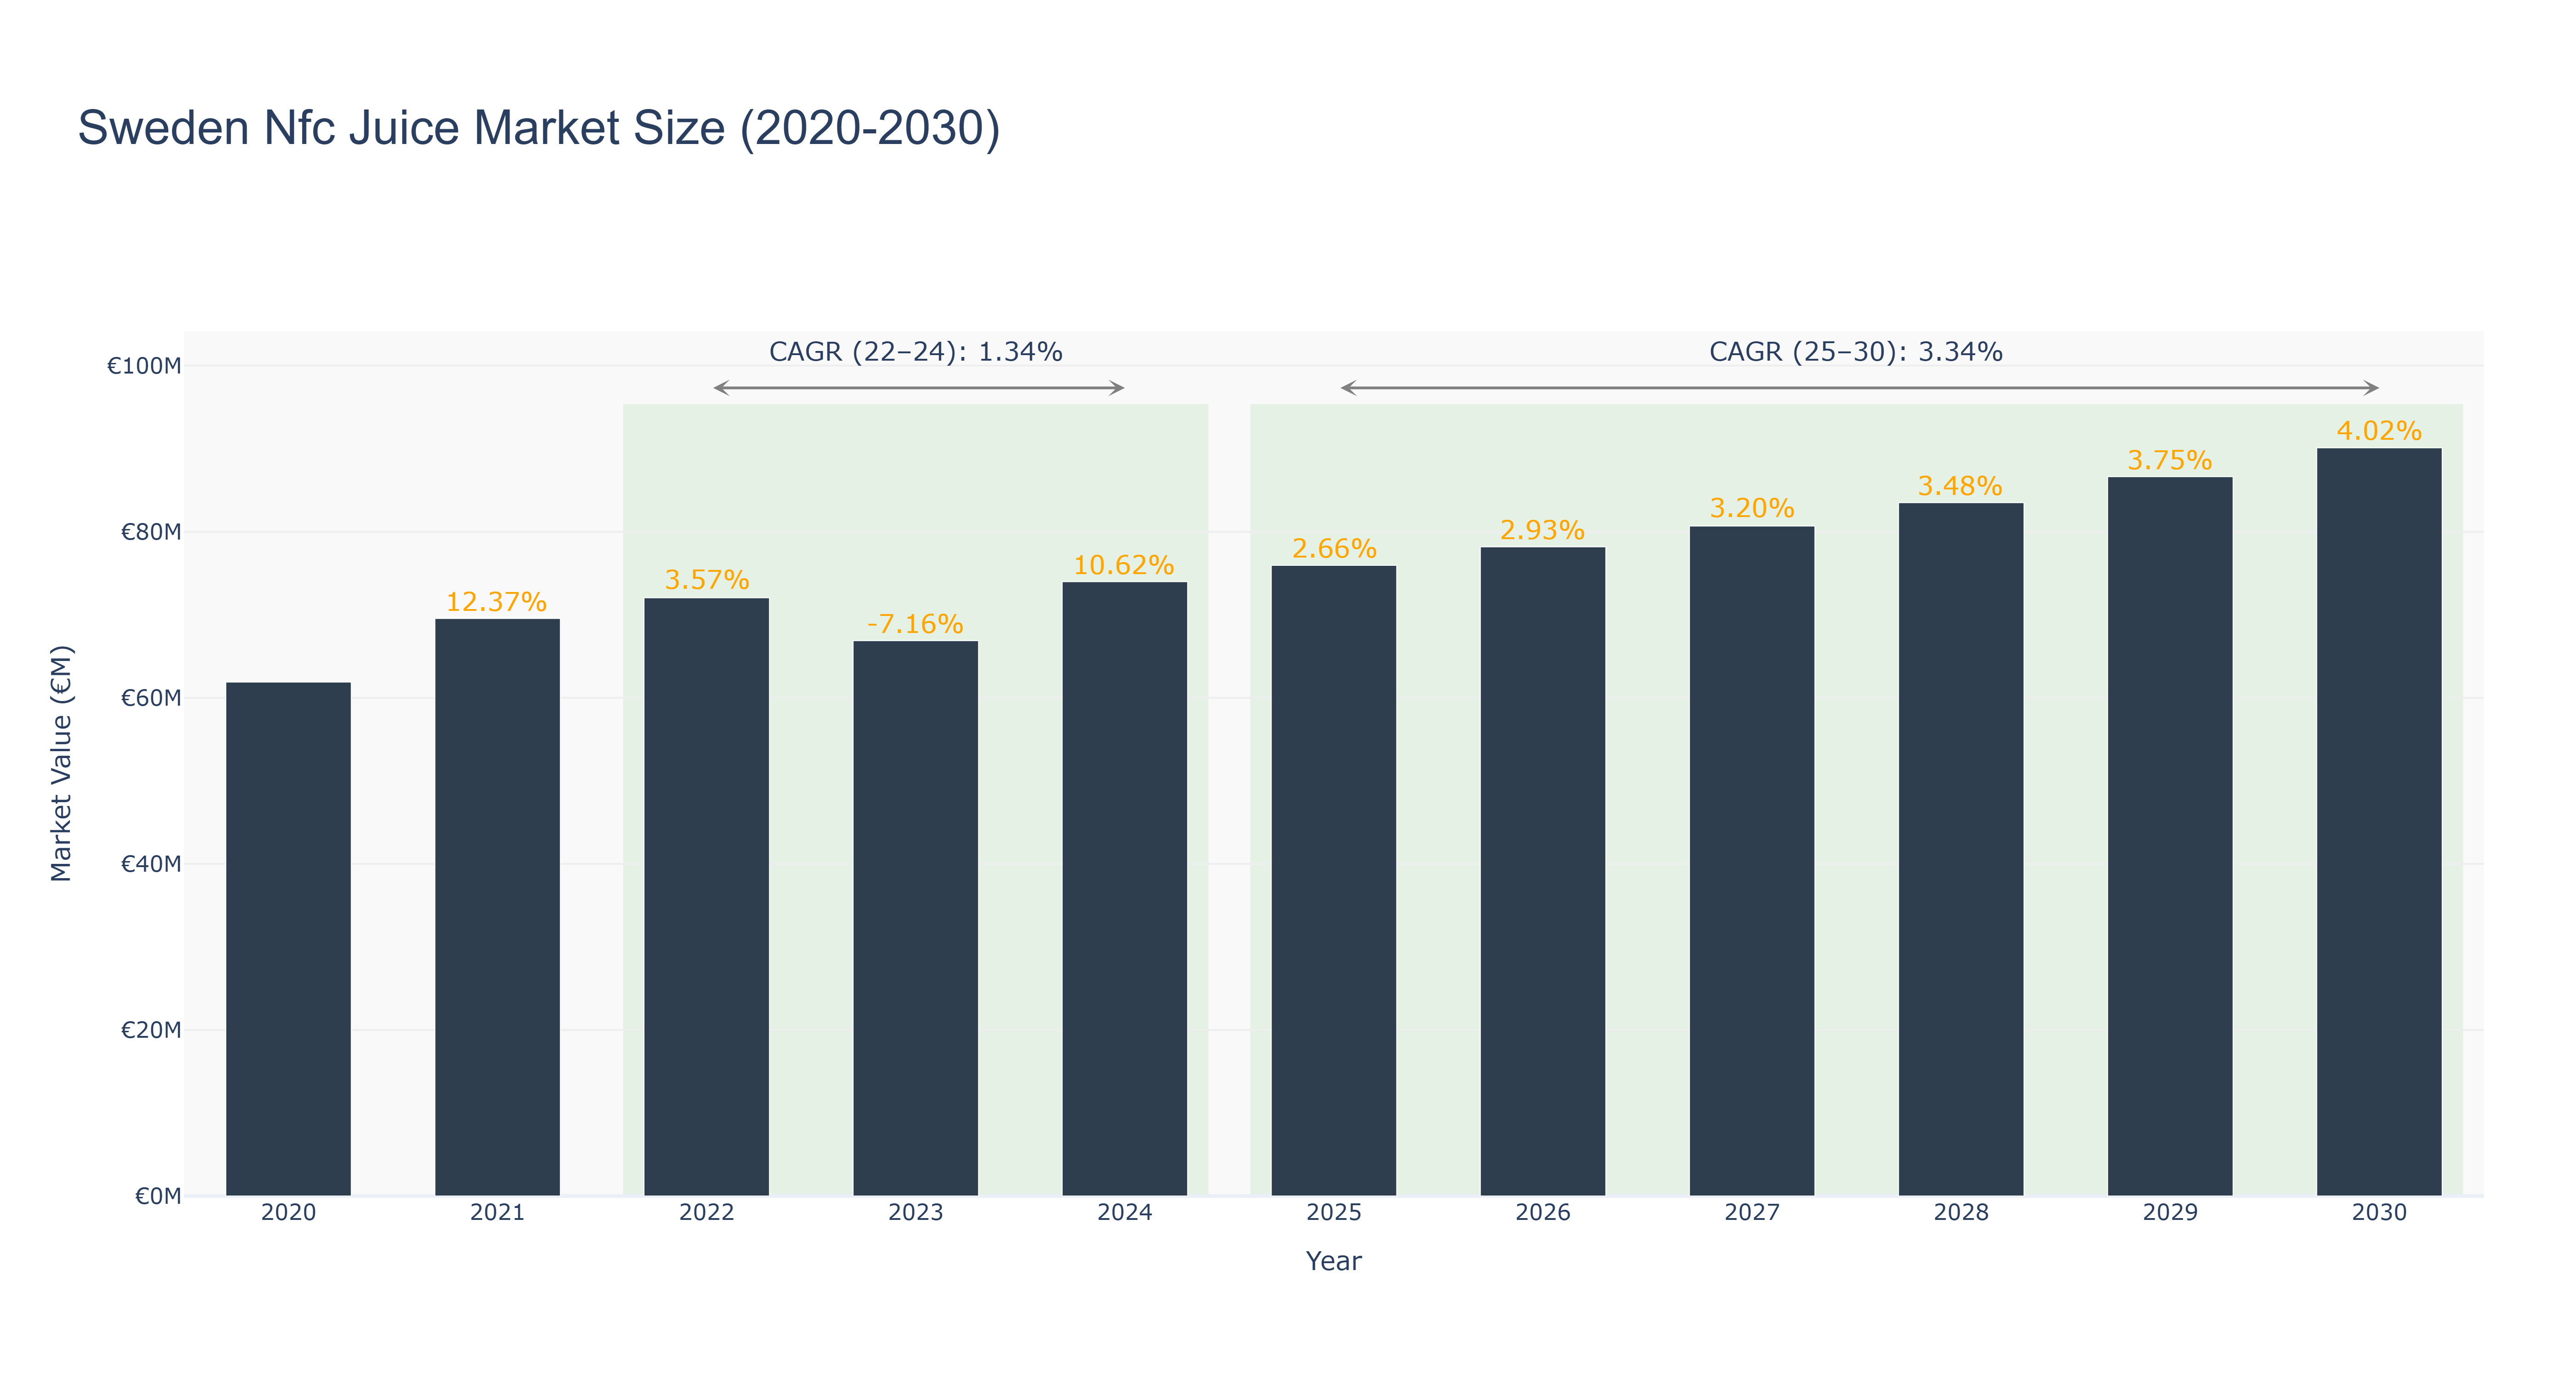
Sweden NFC Juice Market has shown a steady growth trajectory over the past decade. The peak market size was €90.11 million in 2030, with a notable increase from €61.90 million in 2020. The market experienced a dip in 2023 to €66.88 million, attributed to changing consumer preferences and economic factors. The forecasted market size from 2025 to 2030 is expected to continue the upward trend, with a CAGR of 3.34% post-2025. Industry drivers such as increasing health consciousness and demand for convenient beverages have fueled this growth. Looking ahead, Sweden is set to introduce sustainable packaging initiatives in the NFC juice market, aligning with the country's environmental sustainability goals and consumer preferences.
Sweden Nfc Juice Market: Production & Trade Performance (2019-2025)
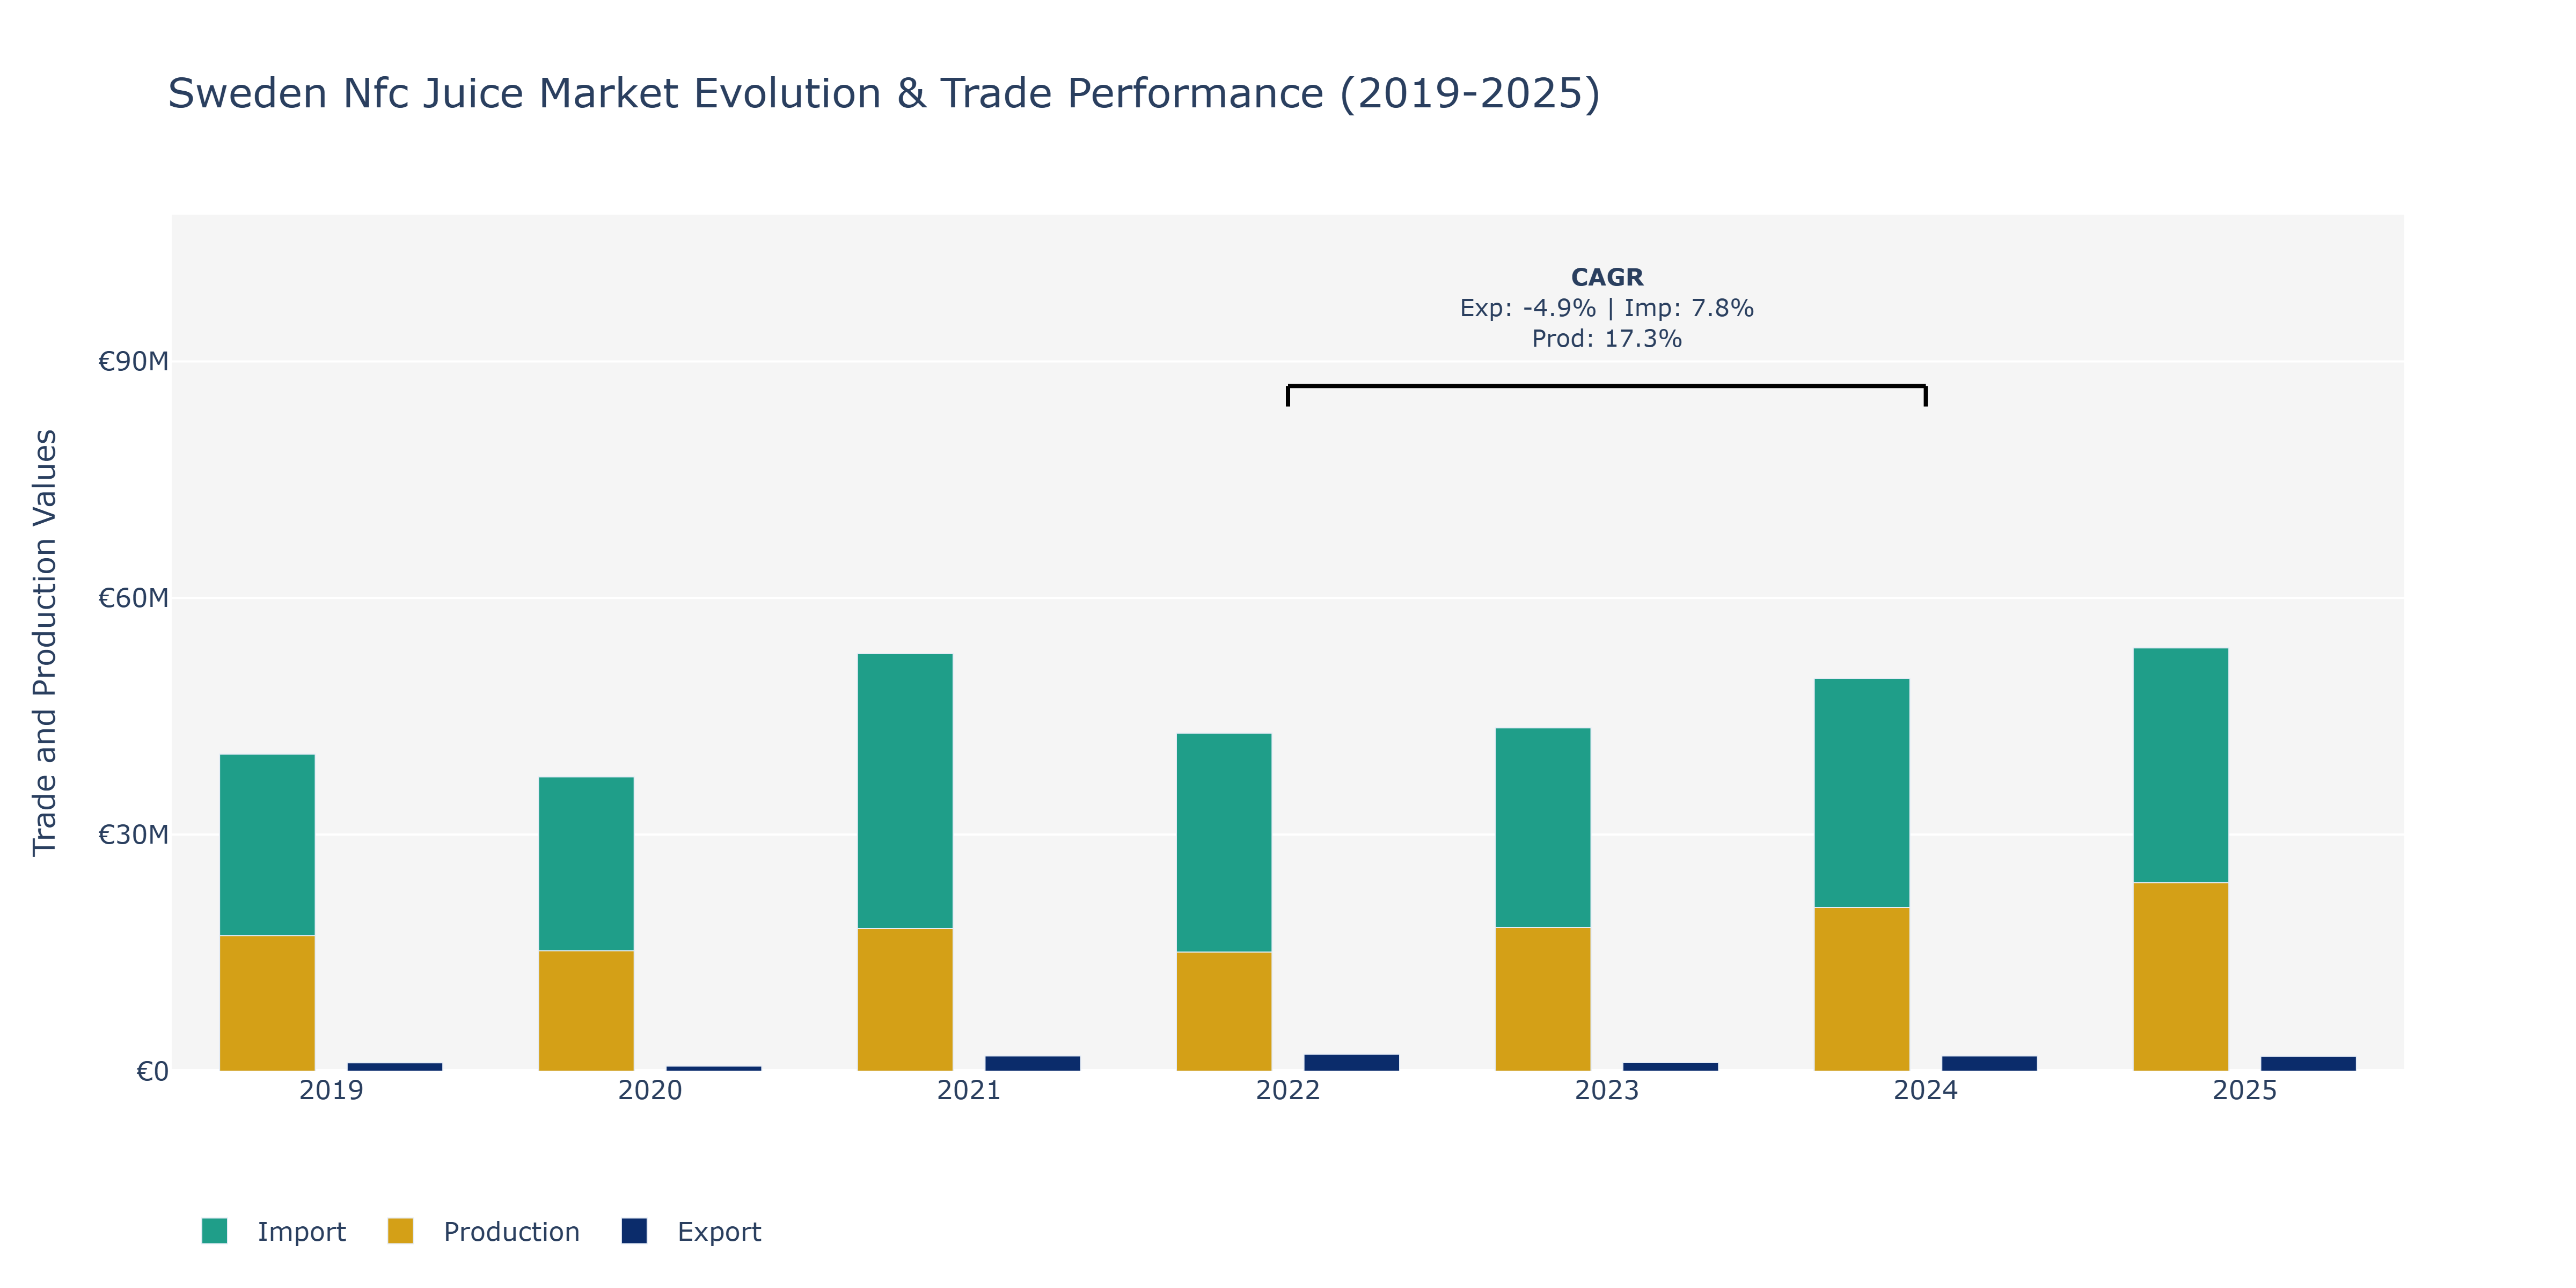
In the Sweden Nfc Juice Market, exports exhibited fluctuations over the years, with a peak in 2021 at €1.94 million, followed by a slight decline in 2022 but recovering in 2023 and 2024. Imports, on the other hand, showed steady growth from €40.2 million in 2019 to €53.7 million in 2025, indicating a continuous upward trend, supported by factors like increasing consumer demand for diverse juice products and globalization driving trade expansion. Production saw a notable spike in 2025, reaching €23.9 billion, reflecting enhanced manufacturing capabilities and innovation in the sector to meet rising consumer preferences for healthy and natural beverages. These trends align with the global shift towards healthier lifestyles and preferences for premium juice products, reinforcing the importance of product quality and sustainability in the market to attract and retain consumers.
Key Highlights of the Report:
- Sweden NFC Juice Market Outlook
- Market Size of Sweden NFC Juice Market, 2025
- Forecast of Sweden NFC Juice Market, 2032
- Historical Data and Forecast of Sweden NFC Juice Revenues & Volume for the Period 2022 - 2032F
- Sweden NFC Juice Market Trend Evolution
- Sweden NFC Juice Market Drivers and Challenges
- Sweden NFC Juice Price Trends
- Sweden NFC Juice Porter's Five Forces
- Sweden NFC Juice Industry Life Cycle
- Historical Data and Forecast of Sweden NFC Juice Market Revenues & Volume By Product Type for the Period 2022 - 2032F
- Historical Data and Forecast of Sweden NFC Juice Market Revenues & Volume By Orange Juice for the Period 2022 - 2032F
- Historical Data and Forecast of Sweden NFC Juice Market Revenues & Volume By Apple Juice for the Period 2022 - 2032F
- Historical Data and Forecast of Sweden NFC Juice Market Revenues & Volume By Pineapple Juice for the Period 2022 - 2032F
- Historical Data and Forecast of Sweden NFC Juice Market Revenues & Volume By Mixed Fruit Juice for the Period 2022 - 2032F
- Historical Data and Forecast of Sweden NFC Juice Market Revenues & Volume By Packaging Type for the Period 2022 - 2032F
- Historical Data and Forecast of Sweden NFC Juice Market Revenues & Volume By Bottles for the Period 2022 - 2032F
- Historical Data and Forecast of Sweden NFC Juice Market Revenues & Volume By Cartons for the Period 2022 - 2032F
- Historical Data and Forecast of Sweden NFC Juice Market Revenues & Volume By Cans for the Period 2022 - 2032F
- Historical Data and Forecast of Sweden NFC Juice Market Revenues & Volume By Pouches for the Period 2022 - 2032F
- Historical Data and Forecast of Sweden NFC Juice Market Revenues & Volume By Distribution Channel for the Period 2022 - 2032F
- Historical Data and Forecast of Sweden NFC Juice Market Revenues & Volume By Supermarkets for the Period 2022 - 2032F
- Historical Data and Forecast of Sweden NFC Juice Market Revenues & Volume By Convenience Stores for the Period 2022 - 2032F
- Historical Data and Forecast of Sweden NFC Juice Market Revenues & Volume By Online Retail for the Period 2022 - 2032F
- Historical Data and Forecast of Sweden NFC Juice Market Revenues & Volume By Specialty Stores for the Period 2022 - 2032F
- Historical Data and Forecast of Sweden NFC Juice Market Revenues & Volume By Food Service for the Period 2022 - 2032F
- Sweden NFC Juice Import Export Trade Statistics
- Market Opportunity Assessment By Product Type
- Market Opportunity Assessment By Packaging Type
- Market Opportunity Assessment By Distribution Channel
- Sweden NFC Juice Top Companies Market Share
- Sweden NFC Juice Competitive Benchmarking By Technical and Operational Parameters
- Sweden NFC Juice Company Profiles
- Sweden NFC Juice Key Strategic Recommendations
Frequently Asked Questions About the Market Study (FAQs):
6Wresearch actively monitors the Sweden NFC Juice Market and publishes its comprehensive annual report, highlighting emerging trends, growth drivers, revenue analysis, and forecast outlook. Our insights help businesses to make data-backed strategic decisions with ongoing market dynamics. Our analysts track relevent industries related to the Sweden NFC Juice Market, allowing our clients with actionable intelligence and reliable forecasts tailored to emerging regional needs.
Yes, we provide customisation as per your requirements. To learn more, feel free to contact us on sales@6wresearch.com
1 Executive Summary |
2 Introduction |
2.1 Key Highlights of the Report |
2.2 Report Description |
2.3 Market Scope & Segmentation |
2.4 Research Methodology |
2.5 Assumptions |
3 Sweden NFC Juice Market Overview |
3.1 Sweden Country Macro Economic Indicators |
3.2 Sweden NFC Juice Market Revenues & Volume, 2022 & 2032F |
3.3 Sweden NFC Juice Market - Industry Life Cycle |
3.4 Sweden NFC Juice Market - Porter's Five Forces |
3.5 Sweden NFC Juice Market Revenues & Volume Share, By Product Type, 2022 & 2032F |
3.6 Sweden NFC Juice Market Revenues & Volume Share, By Packaging Type, 2022 & 2032F |
3.7 Sweden NFC Juice Market Revenues & Volume Share, By Distribution Channel, 2022 & 2032F |
4 Sweden NFC Juice Market Dynamics |
4.1 Impact Analysis |
4.2 Market Drivers |
4.2.1 Increasing consumer awareness about the health benefits of NFC (Not From Concentrate) juices |
4.2.2 Growing demand for natural and organic beverages in Sweden |
4.2.3 Rise in disposable income leading to higher spending on premium juice products |
4.3 Market Restraints |
4.3.1 Seasonal fluctuations in fruit harvest impacting the availability and cost of NFC juices |
4.3.2 Competition from other beverage categories like smoothies and energy drinks |
4.3.3 Stringent regulations on labeling and packaging of juice products |
5 Sweden NFC Juice Market Trends |
6 Sweden NFC Juice Market, By Types |
6.1 Sweden NFC Juice Market, By Product Type |
6.1.1 Overview and Analysis |
6.1.2 Sweden NFC Juice Market Revenues & Volume, By Product Type, 2022 - 2032F |
6.1.3 Sweden NFC Juice Market Revenues & Volume, By Orange Juice, 2022 - 2032F |
6.1.4 Sweden NFC Juice Market Revenues & Volume, By Apple Juice, 2022 - 2032F |
6.1.5 Sweden NFC Juice Market Revenues & Volume, By Pineapple Juice, 2022 - 2032F |
6.1.6 Sweden NFC Juice Market Revenues & Volume, By Mixed Fruit Juice, 2022 - 2032F |
6.2 Sweden NFC Juice Market, By Packaging Type |
6.2.1 Overview and Analysis |
6.2.2 Sweden NFC Juice Market Revenues & Volume, By Bottles, 2022 - 2032F |
6.2.3 Sweden NFC Juice Market Revenues & Volume, By Cartons, 2022 - 2032F |
6.2.4 Sweden NFC Juice Market Revenues & Volume, By Cans, 2022 - 2032F |
6.2.5 Sweden NFC Juice Market Revenues & Volume, By Pouches, 2022 - 2032F |
6.3 Sweden NFC Juice Market, By Distribution Channel |
6.3.1 Overview and Analysis |
6.3.2 Sweden NFC Juice Market Revenues & Volume, By Supermarkets, 2022 - 2032F |
6.3.3 Sweden NFC Juice Market Revenues & Volume, By Convenience Stores, 2022 - 2032F |
6.3.4 Sweden NFC Juice Market Revenues & Volume, By Online Retail, 2022 - 2032F |
6.3.5 Sweden NFC Juice Market Revenues & Volume, By Specialty Stores, 2022 - 2032F |
6.3.6 Sweden NFC Juice Market Revenues & Volume, By Food Service, 2022 - 2032F |
7 Sweden NFC Juice Market Import-Export Trade Statistics |
7.1 Sweden NFC Juice Market Export to Major Countries |
7.2 Sweden NFC Juice Market Imports from Major Countries |
8 Sweden NFC Juice Market Key Performance Indicators |
8.1 Consumer engagement on social media platforms for NFC juice brands |
8.2 Number of new product launches and innovations in the NFC juice market |
8.3 Percentage increase in distribution channels for NFC juice products |
9 Sweden NFC Juice Market - Opportunity Assessment |
9.1 Sweden NFC Juice Market Opportunity Assessment, By Product Type, 2022 & 2032F |
9.2 Sweden NFC Juice Market Opportunity Assessment, By Packaging Type, 2022 & 2032F |
9.3 Sweden NFC Juice Market Opportunity Assessment, By Distribution Channel, 2022 & 2032F |
10 Sweden NFC Juice Market - Competitive Landscape |
10.1 Sweden NFC Juice Market Revenue Share, By Companies, 2025 |
10.2 Sweden NFC Juice Market Competitive Benchmarking, By Operating and Technical Parameters |
11 Company Profiles |
12 Recommendations |
13 Disclaimer |
Export potential assessment - trade Analytics for 2030
Export potential enables firms to identify high-growth global markets with greater confidence by combining advanced trade intelligence with a structured quantitative methodology. The framework analyzes emerging demand trends and country-level import patterns while integrating macroeconomic and trade datasets such as GDP and population forecasts, bilateral import–export flows, tariff structures, elasticity differentials between developed and developing economies, geographic distance, and import demand projections. Using weighted trade values from 2020–2024 as the base period to project country-to-country export potential for 2030, these inputs are operationalized through calculated drivers such as gravity model parameters, tariff impact factors, and projected GDP per-capita growth. Through an analysis of hidden potentials, demand hotspots, and market conditions that are most favorable to success, this method enables firms to focus on target countries, maximize returns, and global expansion with data, backed by accuracy.
By factoring in the projected importer demand gap that is currently unmet and could be potential opportunity, it identifies the potential for the Exporter (Country) among 190 countries, against the general trade analysis, which identifies the biggest importer or exporter.
To discover high-growth global markets and optimize your business strategy:
Click Here
Pricing
- Single User License$ 1,995
- Department License$ 2,400
- Site License$ 3,120
- Global License$ 3,795

Search
Thought Leadership and Analyst Meet


Our Clients
Latest Reports
- India Ultrasonic Smart Water Meter Market (2026-2032) | Outlook, Competition, Drivers, Trends, Demand, Competitive, Strategic Insights, Companies, Challenges, Strategy, Consumer Insights, Analysis, Opportunities, Growth, Size, Share, Industry, Revenue, Segments, Value, Segmentation, Supply, Forecast, Restraints,
- India Electromagnetic Bulk Flow Meter Market (2026-2032) | Analysis, Challenges, Strategic Insights, Supply, Forecast, Growth, Share, Consumer Insights, Competitive, Value, Outlook, Size & Demand,
- India Battery Powered Bulk Flow Meter Market (2026-2032) | Outlook, Analysis, Competitive Landscape, Growth, Size, Trends, Value, Revenue, Companies, Segmentation, Share & Forecast
- Bosnia and Herzegovina Fuel-Efficient Winglets Market (2026-2032) | Growth, Competition, Strategy, Restraints, Trends, Challenges, segmentation, Value, Outlook, Investment Opportunities, Analysis, Revenue, Companies, Insights, Pricing, Size, Drivers, Demand, Share, Forecast
- Canada Cloud CFD Market (2026-2032) | Size & Revenue, Industry, Growth, Competitive Landscape, Forecast, Segmentation, Value, Outlook, Trends, Share, Analysis, Companies
- Taiwan Food Delivery Platform Market (2026-2032) | Companies, Outlook, Analysis, Trends, Value, Revenue, Segmentation, Share, Forecast, Competitive Landscape, Growth, Size & Forecast
- United Kingdom (UK) Long-term Care Insurance Market (2026-2032) | Growth, Share, Consumer Insights, Drivers, Opportunities, Competition, Pricing Analysis, Segments, Restraints, Companies, Competitive, Value, Outlook, Size, Demand, Analysis, Challenges, Strategic Insights, Investment Trends, Revenue, Trends, Supply, Forecast
- United Kingdom (UK) Long Term Care Market (2026-2032) | Companies, Outlook, Analysis, Trends, Value, Revenue, Segmentation, Share, Forecast, Competitive Landscape, Growth, Size & Forecast
- Iraq Insulation and Waterproofing Market (2026-2032) | Outlook, Drivers, Growth, Size, Share, Industry, Revenue, Trends, Demand, Competitive, Strategic Insights, Opportunities, Segments, Companies, Challenges, Strategy, Consumer Insights, Analysis, Investment Trends, Value, Segmentation, Forecast, Restraints
- India Switchgear Market Outlook (2026-2032) | Size, Share, Trends, Growth, Revenue, Forecast, Analysis, Value, Outlook
Industry Events and Analyst Meet

HIMTEX 2026

India Refining Summit 2026

India EV Show 2026

EV tech India Expo 2026

Auto Tech Asia 2026
Whitepaper
- Middle East & Africa Commercial Security Market Click here to view more.
- Middle East & Africa Fire Safety Systems & Equipment Market Click here to view more.
- GCC Drone Market Click here to view more.
- Middle East Lighting Fixture Market Click here to view more.
- GCC Physical & Perimeter Security Market Click here to view more.
6WResearch In News
- Doha a strategic location for EV manufacturing hub: IPA Qatar
- Demand for luxury TVs surging in the GCC, says Samsung
- Empowering Growth: The Thriving Journey of Bangladesh’s Cable Industry
- Demand for luxury TVs surging in the GCC, says Samsung
- Video call with a traditional healer? Once unthinkable, it’s now common in South Africa
- Intelligent Buildings To Smooth GCC’s Path To Net Zero