Sweden Single Photon Emission Computerized Tomography (SPECT) Probes Market (2026-2032) | Analysis, Forecast, Size & Revenue, Segmentation, Share, Companies, Value, Growth, Competitive Landscape, Trends, Outlook, Industry
Market Forecast By Type (Small Molecule Bimodal Probes, Nano-Sized Bimodal Probes, Small Molecular Trimodal Probes, Nano-Sized Trimodal Probes), By Indication (Alzheimers Disease (AD), Parkinsons Disease (PD), Others), By Product (Fluoroscent Imaging, Tau Aggregates), By Application (Presymptomatic Diagnosis, Monitoring, Others), By End Use (Hospitals, Diagnostic Centers, Imaging Center, Pathology Labs, Others) And Competitive Landscape
| Product Code: ETC9565285 | Publication Date: Sep 2024 | Updated Date: Apr 2026 | Product Type: Market Research Report | |
| Publisher: 6Wresearch | Author: Summon Dutta | No. of Pages: 75 | No. of Figures: 35 | No. of Tables: 20 |
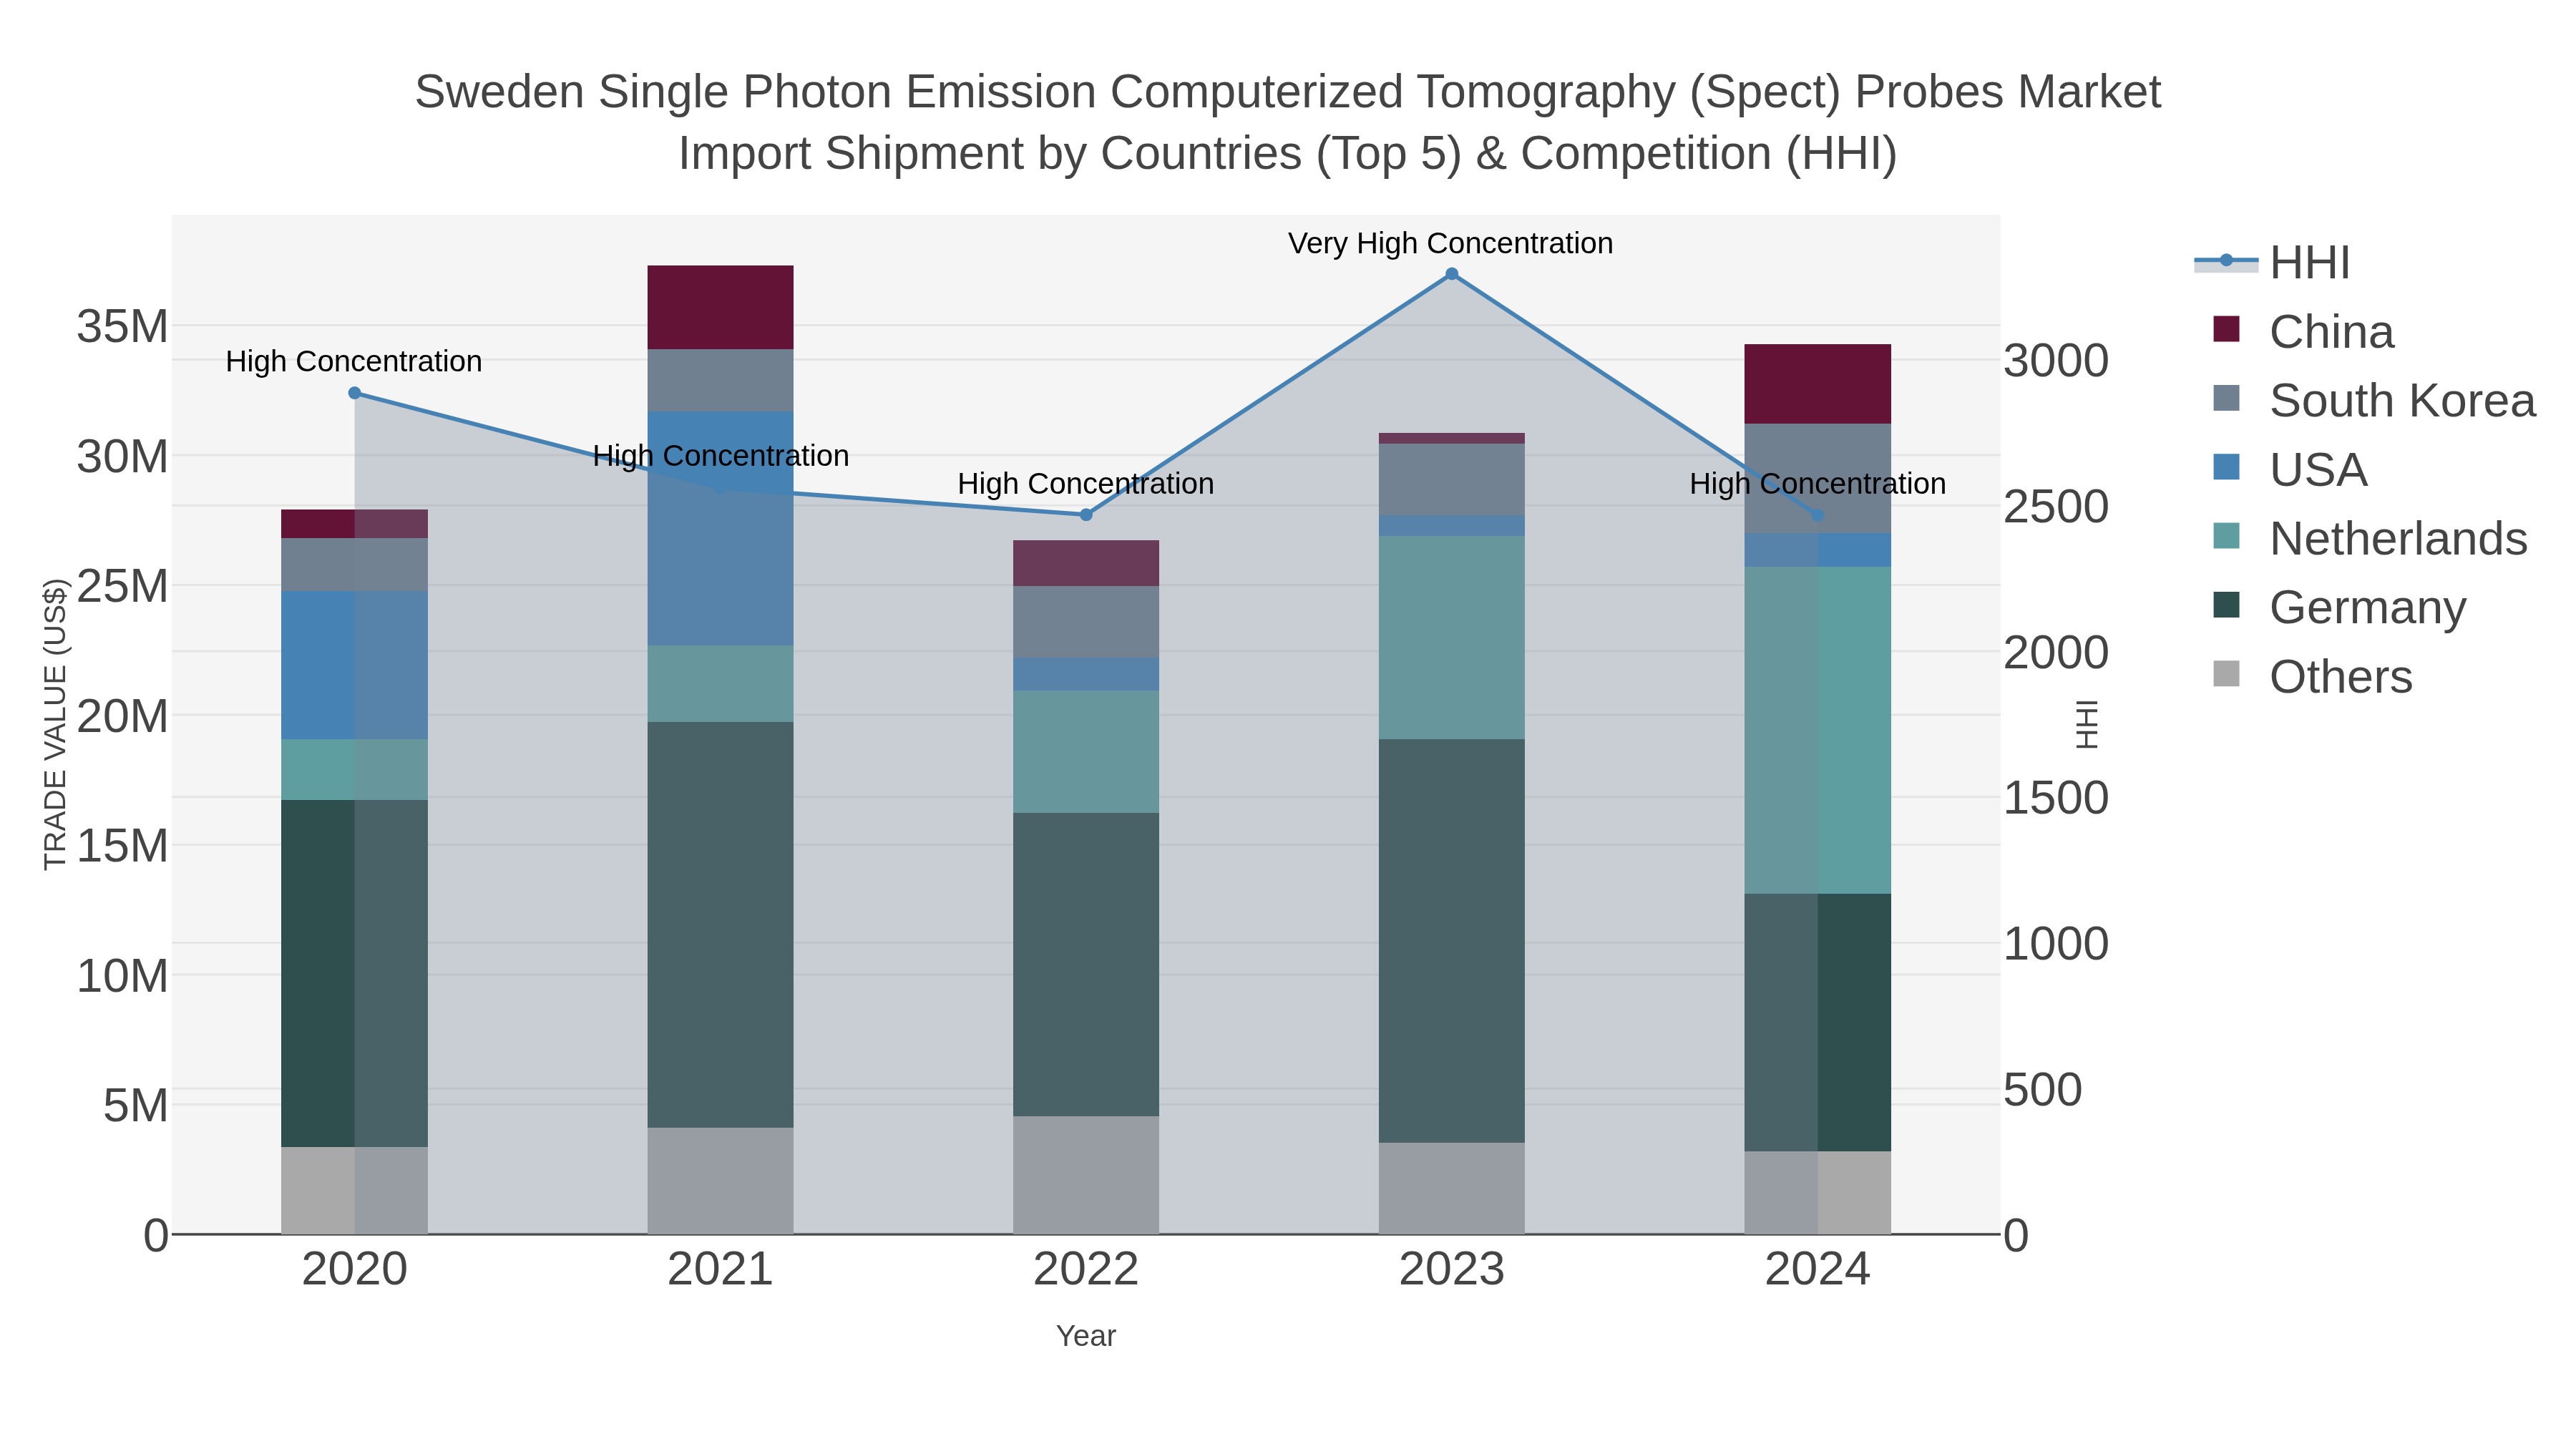
Sweden Single Photon Emission Computerized Tomography Spect Probes Market Top 5 Importing Countries and Market Competition (HHI) Analysis
The import shipments of single photon emission computerized tomography (SPECT) probes to Sweden in 2024 show a diverse range of top exporting countries, with Netherlands, Germany, South Korea, China, and Denmark leading the way. The Herfindahl-Hirschman Index (HHI) indicates a transition from very high concentration in 2023 to high concentration in 2024, reflecting evolving market dynamics. The compound annual growth rate (CAGR) from 2020 to 2024 stands at a steady 5.26%, while the impressive growth rate of 11.12% from 2023 to 2024 highlights the increasing demand and competitiveness in the industry.
Key Highlights of the Report:
- Sweden Single Photon Emission Computerized Tomography (SPECT) Probes Market Outlook
- Market Size of Sweden Single Photon Emission Computerized Tomography (SPECT) Probes Market, 2025
- Forecast of Sweden Single Photon Emission Computerized Tomography (SPECT) Probes Market, 2032
- Historical Data and Forecast of Sweden Single Photon Emission Computerized Tomography (SPECT) Probes Revenues & Volume for the Period 2022 - 2032
- Sweden Single Photon Emission Computerized Tomography (SPECT) Probes Market Trend Evolution
- Sweden Single Photon Emission Computerized Tomography (SPECT) Probes Market Drivers and Challenges
- Sweden Single Photon Emission Computerized Tomography (SPECT) Probes Price Trends
- Sweden Single Photon Emission Computerized Tomography (SPECT) Probes Porter's Five Forces
- Sweden Single Photon Emission Computerized Tomography (SPECT) Probes Industry Life Cycle
- Historical Data and Forecast of Sweden Single Photon Emission Computerized Tomography (SPECT) Probes Market Revenues & Volume By Type for the Period 2022 - 2032
- Historical Data and Forecast of Sweden Single Photon Emission Computerized Tomography (SPECT) Probes Market Revenues & Volume By Small Molecule Bimodal Probes for the Period 2022 - 2032
- Historical Data and Forecast of Sweden Single Photon Emission Computerized Tomography (SPECT) Probes Market Revenues & Volume By Nano-Sized Bimodal Probes for the Period 2022 - 2032
- Historical Data and Forecast of Sweden Single Photon Emission Computerized Tomography (SPECT) Probes Market Revenues & Volume By Small Molecular Trimodal Probes for the Period 2022 - 2032
- Historical Data and Forecast of Sweden Single Photon Emission Computerized Tomography (SPECT) Probes Market Revenues & Volume By Nano-Sized Trimodal Probes for the Period 2022 - 2032
- Historical Data and Forecast of Sweden Single Photon Emission Computerized Tomography (SPECT) Probes Market Revenues & Volume By Indication for the Period 2022 - 2032
- Historical Data and Forecast of Sweden Single Photon Emission Computerized Tomography (SPECT) Probes Market Revenues & Volume By Alzheimers Disease (AD) for the Period 2022 - 2032
- Historical Data and Forecast of Sweden Single Photon Emission Computerized Tomography (SPECT) Probes Market Revenues & Volume By Parkinsons Disease (PD) for the Period 2022 - 2032
- Historical Data and Forecast of Sweden Single Photon Emission Computerized Tomography (SPECT) Probes Market Revenues & Volume By Others for the Period 2022 - 2032
- Historical Data and Forecast of Sweden Single Photon Emission Computerized Tomography (SPECT) Probes Market Revenues & Volume By Product for the Period 2022 - 2032
- Historical Data and Forecast of Sweden Single Photon Emission Computerized Tomography (SPECT) Probes Market Revenues & Volume By Fluoroscent Imaging for the Period 2022 - 2032
- Historical Data and Forecast of Sweden Single Photon Emission Computerized Tomography (SPECT) Probes Market Revenues & Volume By Tau Aggregates for the Period 2022 - 2032
- Historical Data and Forecast of Sweden Single Photon Emission Computerized Tomography (SPECT) Probes Market Revenues & Volume By Application for the Period 2022 - 2032
- Historical Data and Forecast of Sweden Single Photon Emission Computerized Tomography (SPECT) Probes Market Revenues & Volume By Presymptomatic Diagnosis for the Period 2022 - 2032
- Historical Data and Forecast of Sweden Single Photon Emission Computerized Tomography (SPECT) Probes Market Revenues & Volume By Monitoring for the Period 2022 - 2032
- Historical Data and Forecast of Sweden Single Photon Emission Computerized Tomography (SPECT) Probes Market Revenues & Volume By Others for the Period 2022 - 2032
- Historical Data and Forecast of Sweden Single Photon Emission Computerized Tomography (SPECT) Probes Market Revenues & Volume By End Use for the Period 2022 - 2032
- Historical Data and Forecast of Sweden Single Photon Emission Computerized Tomography (SPECT) Probes Market Revenues & Volume By Hospitals for the Period 2022 - 2032
- Historical Data and Forecast of Sweden Single Photon Emission Computerized Tomography (SPECT) Probes Market Revenues & Volume By Diagnostic Centers for the Period 2022 - 2032
- Historical Data and Forecast of Sweden Single Photon Emission Computerized Tomography (SPECT) Probes Market Revenues & Volume By Imaging Center for the Period 2022 - 2032
- Historical Data and Forecast of Sweden Single Photon Emission Computerized Tomography (SPECT) Probes Market Revenues & Volume By Pathology Labs for the Period 2022 - 2032
- Historical Data and Forecast of Sweden Single Photon Emission Computerized Tomography (SPECT) Probes Market Revenues & Volume By Others for the Period 2022 - 2032
- Sweden Single Photon Emission Computerized Tomography (SPECT) Probes Import Export Trade Statistics
- Market Opportunity Assessment By Type
- Market Opportunity Assessment By Indication
- Market Opportunity Assessment By Product
- Market Opportunity Assessment By Application
- Market Opportunity Assessment By End Use
- Sweden Single Photon Emission Computerized Tomography (SPECT) Probes Top Companies Market Share
- Sweden Single Photon Emission Computerized Tomography (SPECT) Probes Competitive Benchmarking By Technical and Operational Parameters
- Sweden Single Photon Emission Computerized Tomography (SPECT) Probes Company Profiles
- Sweden Single Photon Emission Computerized Tomography (SPECT) Probes Key Strategic Recommendations
Frequently Asked Questions About the Market Study (FAQs):
6Wresearch actively monitors the Sweden Single Photon Emission Computerized Tomography (SPECT) Probes Market and publishes its comprehensive annual report, highlighting emerging trends, growth drivers, revenue analysis, and forecast outlook. Our insights help businesses to make data-backed strategic decisions with ongoing market dynamics. Our analysts track relevent industries related to the Sweden Single Photon Emission Computerized Tomography (SPECT) Probes Market, allowing our clients with actionable intelligence and reliable forecasts tailored to emerging regional needs.
Yes, we provide customisation as per your requirements. To learn more, feel free to contact us on sales@6wresearch.com
1 Executive Summary |
2 Introduction |
2.1 Key Highlights of the Report |
2.2 Report Description |
2.3 Market Scope & Segmentation |
2.4 Research Methodology |
2.5 Assumptions |
3 Sweden Single Photon Emission Computerized Tomography (SPECT) Probes Market Overview |
3.1 Sweden Country Macro Economic Indicators |
3.2 Sweden Single Photon Emission Computerized Tomography (SPECT) Probes Market Revenues & Volume, 2022 & 2032F |
3.3 Sweden Single Photon Emission Computerized Tomography (SPECT) Probes Market - Industry Life Cycle |
3.4 Sweden Single Photon Emission Computerized Tomography (SPECT) Probes Market - Porter's Five Forces |
3.5 Sweden Single Photon Emission Computerized Tomography (SPECT) Probes Market Revenues & Volume Share, By Type, 2022 & 2032F |
3.6 Sweden Single Photon Emission Computerized Tomography (SPECT) Probes Market Revenues & Volume Share, By Indication, 2022 & 2032F |
3.7 Sweden Single Photon Emission Computerized Tomography (SPECT) Probes Market Revenues & Volume Share, By Product, 2022 & 2032F |
3.8 Sweden Single Photon Emission Computerized Tomography (SPECT) Probes Market Revenues & Volume Share, By Application, 2022 & 2032F |
3.9 Sweden Single Photon Emission Computerized Tomography (SPECT) Probes Market Revenues & Volume Share, By End Use, 2022 & 2032F |
4 Sweden Single Photon Emission Computerized Tomography (SPECT) Probes Market Dynamics |
4.1 Impact Analysis |
4.2 Market Drivers |
4.2.1 Increasing prevalence of chronic diseases requiring diagnostic imaging, driving the demand for SPECT probes. |
4.2.2 Technological advancements in SPECT imaging technology leading to improved image quality and diagnostic accuracy. |
4.2.3 Rising investments in healthcare infrastructure and facilities in Sweden, boosting the adoption of SPECT probes. |
4.3 Market Restraints |
4.3.1 High costs associated with SPECT imaging equipment and probes may limit market growth. |
4.3.2 Limited availability of skilled professionals proficient in operating SPECT equipment could hinder market expansion. |
4.3.3 Stringent regulatory requirements and approval processes for SPECT probes may slow down market development. |
5 Sweden Single Photon Emission Computerized Tomography (SPECT) Probes Market Trends |
6 Sweden Single Photon Emission Computerized Tomography (SPECT) Probes Market, By Types |
6.1 Sweden Single Photon Emission Computerized Tomography (SPECT) Probes Market, By Type |
6.1.1 Overview and Analysis |
6.1.2 Sweden Single Photon Emission Computerized Tomography (SPECT) Probes Market Revenues & Volume, By Type, 2022 - 2032F |
6.1.3 Sweden Single Photon Emission Computerized Tomography (SPECT) Probes Market Revenues & Volume, By Small Molecule Bimodal Probes, 2022 - 2032F |
6.1.4 Sweden Single Photon Emission Computerized Tomography (SPECT) Probes Market Revenues & Volume, By Nano-Sized Bimodal Probes, 2022 - 2032F |
6.1.5 Sweden Single Photon Emission Computerized Tomography (SPECT) Probes Market Revenues & Volume, By Small Molecular Trimodal Probes, 2022 - 2032F |
6.1.6 Sweden Single Photon Emission Computerized Tomography (SPECT) Probes Market Revenues & Volume, By Nano-Sized Trimodal Probes, 2022 - 2032F |
6.2 Sweden Single Photon Emission Computerized Tomography (SPECT) Probes Market, By Indication |
6.2.1 Overview and Analysis |
6.2.2 Sweden Single Photon Emission Computerized Tomography (SPECT) Probes Market Revenues & Volume, By Alzheimers Disease (AD), 2022 - 2032F |
6.2.3 Sweden Single Photon Emission Computerized Tomography (SPECT) Probes Market Revenues & Volume, By Parkinsons Disease (PD), 2022 - 2032F |
6.2.4 Sweden Single Photon Emission Computerized Tomography (SPECT) Probes Market Revenues & Volume, By Others, 2022 - 2032F |
6.3 Sweden Single Photon Emission Computerized Tomography (SPECT) Probes Market, By Product |
6.3.1 Overview and Analysis |
6.3.2 Sweden Single Photon Emission Computerized Tomography (SPECT) Probes Market Revenues & Volume, By Fluoroscent Imaging, 2022 - 2032F |
6.3.3 Sweden Single Photon Emission Computerized Tomography (SPECT) Probes Market Revenues & Volume, By Tau Aggregates, 2022 - 2032F |
6.4 Sweden Single Photon Emission Computerized Tomography (SPECT) Probes Market, By Application |
6.4.1 Overview and Analysis |
6.4.2 Sweden Single Photon Emission Computerized Tomography (SPECT) Probes Market Revenues & Volume, By Presymptomatic Diagnosis, 2022 - 2032F |
6.4.3 Sweden Single Photon Emission Computerized Tomography (SPECT) Probes Market Revenues & Volume, By Monitoring, 2022 - 2032F |
6.4.4 Sweden Single Photon Emission Computerized Tomography (SPECT) Probes Market Revenues & Volume, By Others, 2022 - 2032F |
6.5 Sweden Single Photon Emission Computerized Tomography (SPECT) Probes Market, By End Use |
6.5.1 Overview and Analysis |
6.5.2 Sweden Single Photon Emission Computerized Tomography (SPECT) Probes Market Revenues & Volume, By Hospitals, 2022 - 2032F |
6.5.3 Sweden Single Photon Emission Computerized Tomography (SPECT) Probes Market Revenues & Volume, By Diagnostic Centers, 2022 - 2032F |
6.5.4 Sweden Single Photon Emission Computerized Tomography (SPECT) Probes Market Revenues & Volume, By Imaging Center, 2022 - 2032F |
6.5.5 Sweden Single Photon Emission Computerized Tomography (SPECT) Probes Market Revenues & Volume, By Pathology Labs, 2022 - 2032F |
6.5.6 Sweden Single Photon Emission Computerized Tomography (SPECT) Probes Market Revenues & Volume, By Others, 2022 - 2032F |
7 Sweden Single Photon Emission Computerized Tomography (SPECT) Probes Market Import-Export Trade Statistics |
7.1 Sweden Single Photon Emission Computerized Tomography (SPECT) Probes Market Export to Major Countries |
7.2 Sweden Single Photon Emission Computerized Tomography (SPECT) Probes Market Imports from Major Countries |
8 Sweden Single Photon Emission Computerized Tomography (SPECT) Probes Market Key Performance Indicators |
8.1 Adoption rate of SPECT probes in healthcare institutions. |
8.2 Rate of technological innovation and upgrades in SPECT imaging systems. |
8.3 Number of research studies and clinical trials utilizing SPECT probes for diagnostic purposes. |
9 Sweden Single Photon Emission Computerized Tomography (SPECT) Probes Market - Opportunity Assessment |
9.1 Sweden Single Photon Emission Computerized Tomography (SPECT) Probes Market Opportunity Assessment, By Type, 2022 & 2032F |
9.2 Sweden Single Photon Emission Computerized Tomography (SPECT) Probes Market Opportunity Assessment, By Indication, 2022 & 2032F |
9.3 Sweden Single Photon Emission Computerized Tomography (SPECT) Probes Market Opportunity Assessment, By Product, 2022 & 2032F |
9.4 Sweden Single Photon Emission Computerized Tomography (SPECT) Probes Market Opportunity Assessment, By Application, 2022 & 2032F |
9.5 Sweden Single Photon Emission Computerized Tomography (SPECT) Probes Market Opportunity Assessment, By End Use, 2022 & 2032F |
10 Sweden Single Photon Emission Computerized Tomography (SPECT) Probes Market - Competitive Landscape |
10.1 Sweden Single Photon Emission Computerized Tomography (SPECT) Probes Market Revenue Share, By Companies, 2025 |
10.2 Sweden Single Photon Emission Computerized Tomography (SPECT) Probes Market Competitive Benchmarking, By Operating and Technical Parameters |
11 Company Profiles |
12 Recommendations |
13 Disclaimer |
Global Go To Market Strategy - 2030
Export potential enables firms to identify high-growth global markets with greater confidence by combining advanced trade intelligence with a structured quantitative methodology. The framework analyzes emerging demand trends and country-level import patterns while integrating macroeconomic and trade datasets such as GDP and population forecasts, bilateral import–export flows, tariff structures, elasticity differentials between developed and developing economies, geographic distance, and import demand projections. Using weighted trade values from 2020–2024 as the base period to project country-to-country export potential for 2030, these inputs are operationalized through calculated drivers such as gravity model parameters, tariff impact factors, and projected GDP per-capita growth. Through an analysis of hidden potentials, demand hotspots, and market conditions that are most favorable to success, this method enables firms to focus on target countries, maximize returns, and global expansion with data, backed by accuracy.
By factoring in the projected importer demand gap that is currently unmet and could be potential opportunity, it identifies the potential for the Exporter (Country) among 190 countries, against the general trade analysis, which identifies the biggest importer or exporter.
To discover high-growth global markets and optimize your business strategy:
Click Here
Pricing
- Single User License$ 1,995
- Department License$ 2,400
- Site License$ 3,120
- Global License$ 3,795

Leadership Perspectives from Industry Events
Search
Thought Leadership and Analyst Meet


Our Clients
6WResearch In News
- Doha a strategic location for EV manufacturing hub: IPA Qatar
- Demand for luxury TVs surging in the GCC, says Samsung
- Empowering Growth: The Thriving Journey of Bangladesh’s Cable Industry
- Demand for luxury TVs surging in the GCC, says Samsung
- Video call with a traditional healer? Once unthinkable, it’s now common in South Africa
- Intelligent Buildings To Smooth GCC’s Path To Net Zero
Latest Reports
- New Zealand Aseptic Manufacturing Market (2026-2032)
- Netherlands Aseptic Manufacturing Market (2026-2032)
- Nauru Aseptic Manufacturing Market (2026-2032)
- Namibia Aseptic Manufacturing Market (2026-2032)
- Mozambique Aseptic Manufacturing Market (2026-2032)
- Montenegro Aseptic Manufacturing Market (2026-2032)
- Mongolia Aseptic Manufacturing Market (2026-2032)
- Monaco Aseptic Manufacturing Market (2026-2032)
- Micronesia Aseptic Manufacturing Market (2026-2032)
- Mauritius Aseptic Manufacturing Market (2026-2032)
Industry Events and Analyst Meet

HIMTEX 2026

India Refining Summit 2026

India EV Show 2026

EV tech India Expo 2026

Auto Tech Asia 2026
Whitepaper
- Middle East & Africa Commercial Security Market Click here to view more.
- Middle East & Africa Fire Safety Systems & Equipment Market Click here to view more.
- GCC Drone Market Click here to view more.
- Middle East Lighting Fixture Market Click here to view more.
- GCC Physical & Perimeter Security Market Click here to view more.