Tajikistan Chemical Packaging Market (2026-2032) | Outlook, Forecast, Value, Revenue, Share, Analysis, Size, Trends, Companies, Industry & Growth
Market Forecast By Product Types (Sacks, Drums, FIBC, Other), By Applications (Pharmaceutical Factory, Laboratory, Chemical Plant, Others) And Competitive Landscape
| Product Code: ETC006919 | Publication Date: Sep 2020 | Updated Date: Jun 2026 | Product Type: Report | |
| Publisher: 6Wresearch | Author: Shubham Deep | No. of Pages: 70 | No. of Figures: 35 | No. of Tables: 5 |
Tajikistan Chemical Packaging Market Summary
The tajikistan chemical packaging market was estimated at USD 197 Million in 2025 and is projected to reach USD 270 Million by 2032, growing at a CAGR of 5.2% from 2026 to 2032.
Tajikistan Chemical Packaging Market Year-wise Growth Rate and Key Drivers
This graph highlights how the Tajikistan Chemical Packaging Market has steadily grown over the past five years, supported by major growth factors.
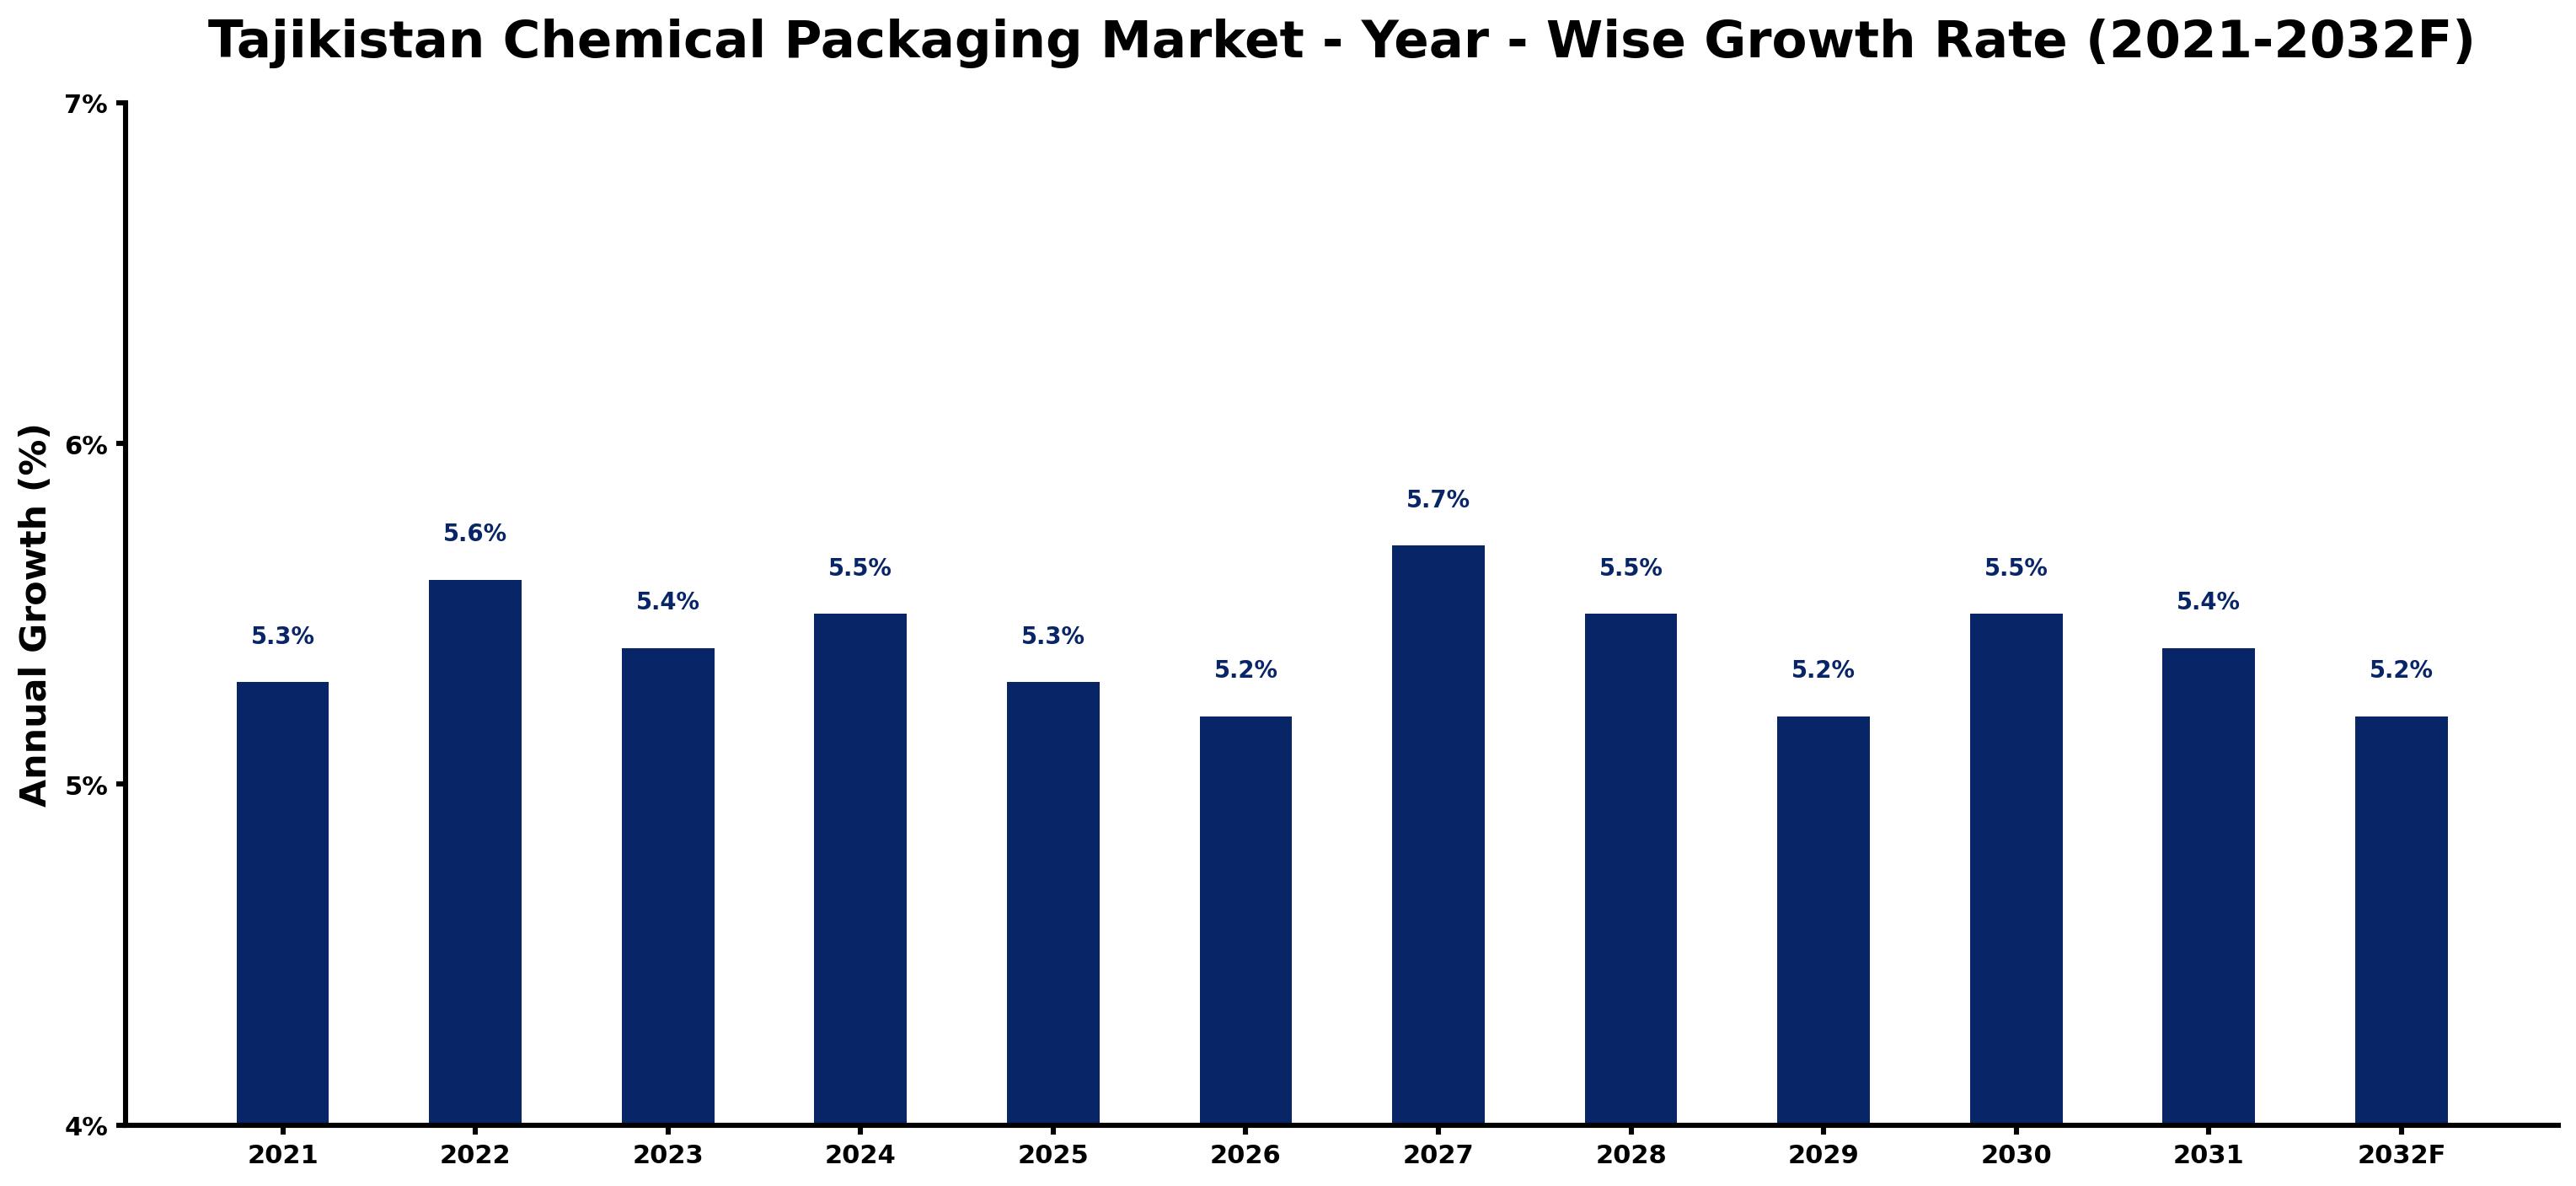
The table below presents the year wise growth rates along with the key drivers influencing the market
| Year | Growth Rate | Major Drivers |
| 2021 | 5.3% | Supply chain disruptions highlighted packaging inefficiencies across chemical industries. |
| 2022 | 5.6% | Local manufacturers began investing in sustainable and biodegradable packaging solutions. |
| 2023 | 5.4% | Increased foreign direct investment enhanced technological capabilities within packaging firms. |
| 2024 | 5.5% | Chemical producers focused on cost-effective packaging to maximize profit margins. |
| 2025 | 5.3% | E-commerce growth demanded more versatile and durable chemical packaging options. |
| 2026 | 5.2% | Local regulations began emphasizing safety standards for hazardous material packaging. |
| 2027 | 5.7% | Consumer awareness of environmental issues influenced demand for eco-friendly packaging. |
| 2028 | 5.5% | Innovation in materials science led to lighter and stronger packaging alternatives. |
| 2029 | 5.2% | Collaboration among companies fostered shared resources for packaging technology advancements. |
| 2030 | 5.5% | Integration of smart packaging technology improved supply chain transparency and efficiency. |
| 2031 | 5.4% | Rising domestic production capabilities reduced reliance on imported packaging materials. |
| 2032 | 5.2% | Market consolidation among packaging companies allowed for enhanced service offerings. |
Note - Market size estimations and growth projections presented in this report are based on 6Wresearch's advanced forecasting approach, validated with industry datasets as of June 2026.
Tajikistan Chemical Packaging Market Synopsis
The Tajikistan Chemical Packaging Market is projected to reach 5.2% and witness significant growth during the forecast period (2026-2032). This growth is largely attributed to the expanding industrial sector, which is increasingly reliant on chemical products. Key industries such as agriculture, pharmaceuticals, and manufacturing are driving the demand for effective and compliant packaging solutions, thereby propelling the chemical packaging market forward.
Tajikistan Chemical Packaging Market Growth Drivers
The growth trajectory of the Tajikistan Chemical Packaging Market is influenced by several key factors:
- Increased industrial activity in sectors such as agriculture and pharmaceuticals necessitates efficient packaging solutions for the safe handling and transportation of chemicals.
- The rising consumer awareness and demand for sustainable packaging solutions are pushing manufacturers to innovate environmentally friendly products.
- Policy changes aimed at enhancing regulatory compliance in chemical safety and packaging are creating a favorable environment for market growth.
- Technological advancements in packaging manufacturing processes are enabling the development of smart packaging solutions, thereby improving supply chain efficiency.
- Growing foreign investments in Tajikistan's industrial sector are expected to spur demand for highly specialized chemical packaging solutions.
Tajikistan Chemical Packaging Market Trends and Opportunities
Several notable trends are shaping the future of the Tajikistan Chemical Packaging Market, all of which present valuable opportunities:
- The shift toward sustainable and eco-friendly packaging solutions is leading to innovations in materials that are recyclable and biodegradable, reducing environmental impact.
- Manufacturers are increasingly adopting advanced technologies, such as RFID and embedded sensors, for smart packaging solutions that aid in tracking product conditions throughout the supply chain.
- There is a growing emphasis on designs that enhance product safety during transportation, allowing businesses to meet stringent compliance requirements and minimize risks.
- Collaboration between local and international manufacturers is rising, fostering the development of customized packaging solutions that cater to specific market needs.
- The increasing importance of aesthetics in packaging is prompting businesses to devise attractive designs that improve shelf visibility and consumer appeal.
Tajikistan Chemical Packaging Market Challenges and Restraints
Despite the positive growth outlook, the Tajikistan Chemical Packaging Market faces several challenges that must be addressed:
- Limited access to modern packaging technologies hinders the ability of many companies to upgrade their processes and meet current market demands.
- Inconsistent quality standards and regulatory frameworks can create uncertainty for businesses, making compliance a significant challenge.
- The shortage of skilled labor poses difficulties in maintaining high-quality packaging solutions, preventing companies from meeting international standards.
- Inadequate infrastructure impacts logistical capabilities, affecting the efficiency of distribution networks and supply chains.
- The market's tendency toward outdated practices can stifle innovation and adaptation to global trends.
Tajikistan Chemical Packaging Market Government Investment and Initiatives
The Tajikistan government has implemented various policies aimed at enhancing the safety and efficiency of chemical packaging practices. Key initiatives include:
- Establishing regulations focused on proper labeling and packaging materials to ensure safe handling and minimize risks of leakage or contamination.
- Promoting the proper disposal of chemical packaging waste to mitigate environmental impacts, thereby fostering sustainable practices within the industry.
- Investing in infrastructure improvements to support the transportation of chemicals, ensuring compliance with safety standards during transit.
- Creating awareness campaigns about the importance of chemical safety, which encourages businesses to invest in compliant packaging solutions.
- Incentivizing investments in advanced packaging technologies that conform to international norms, thereby enhancing the overall competitiveness of the market.
Tajikistan Chemical Packaging Market Latest Developments (May 2025 - June 2026)
In the period from May 2025 to June 2026, the Tajikistan Chemical Packaging Market witnessed a notable shift toward innovative practices. Emphasis on sustainable packaging solutions gained traction, with companies exploring biodegradable materials and recycling initiatives. Advanced technologies, including smart packaging that integrates sensors for real-time monitoring, started to gain acceptance within the industry. Regulatory bodies focused on enhancing compliance frameworks to align with international standards, thus promoting greater safety and quality assurance across chemical packaging. Discussions around public and private partnerships aimed at improving packaging infrastructure highlighted the potential for long-term growth in the sector.
Tajikistan Chemical Packaging Market - Key Attractiveness of the Report
- 10 Years of Market Numbers
- Historical Data Starting from 2022 to 2025
- Base Year: 2025
- Forecast Data until 2032
- Key Performance Indicators Impacting the Market
- Major Upcoming Developments and Projects
Key Highlights of the Report:
- Tajikistan Chemical Packaging Market Outlook
- Market Size of Tajikistan Chemical Packaging Market, 2025
- Forecast of Tajikistan Chemical Packaging Market, 2032F
- Historical Data and Forecast of Tajikistan Chemical Packaging Revenues & Volume for the Period 2022-2032F
- Tajikistan Chemical Packaging Market Trend Evolution
- Tajikistan Chemical Packaging Market Drivers and Challenges
- Tajikistan Chemical Packaging Price Trends
- Tajikistan Chemical Packaging Porter's Five Forces
- Tajikistan Chemical Packaging Industry Life Cycle
- Historical Data and Forecast of Tajikistan Chemical Packaging Market Revenues & Volume By Product Types for the Period 2022-2032F
- Historical Data and Forecast of Tajikistan Chemical Packaging Market Revenues & Volume By Sacks for the Period 2022-2032F
- Historical Data and Forecast of Tajikistan Chemical Packaging Market Revenues & Volume By Drums for the Period 2022-2032F
- Historical Data and Forecast of Tajikistan Chemical Packaging Market Revenues & Volume By FIBC for the Period 2022-2032F
- Historical Data and Forecast of Tajikistan Chemical Packaging Market Revenues & Volume By Other for the Period 2022-2032F
- Historical Data and Forecast of Tajikistan Chemical Packaging Market Revenues & Volume By Applications for the Period 2022-2032F
- Historical Data and Forecast of Tajikistan Chemical Packaging Market Revenues & Volume By Pharmaceutical Factory? for the Period 2022-2032F
- Historical Data and Forecast of Tajikistan Chemical Packaging Market Revenues & Volume By Laboratory for the Period 2022-2032F
- Historical Data and Forecast of Tajikistan Chemical Packaging Market Revenues & Volume By Chemical Plant? for the Period 2022-2032F
- Historical Data and Forecast of Tajikistan Chemical Packaging Market Revenues & Volume By Others for the Period 2022-2032F
- Tajikistan Chemical Packaging Import Export Trade Statistics
- Market Opportunity Assessment By Product Types
- Market Opportunity Assessment By Applications
- Tajikistan Chemical Packaging Top Companies Market Share
- Tajikistan Chemical Packaging Competitive Benchmarking By Technical and Operational Parameters
- Tajikistan Chemical Packaging Company Profiles
- Tajikistan Chemical Packaging Key Strategic Recommendations
Frequently Asked Questions About the Market Study (FAQs):
The growth is primarily driven by increased industrial activities and a rising demand for chemicals, particularly in agriculture and pharmaceuticals, alongside a shift towards more sustainable packaging solutions.
Trends include the adoption of sustainable materials, the integration of smart packaging technologies, and a focus on enhancing product safety during transport.
Challenges encompass limited access to modern technologies, inconsistent quality standards, and a shortage of skilled labor which affects the market's competitiveness.
The government is enhancing safety regulations, investing in infrastructure, and promoting sustainable practices to foster growth and compliance in the chemical packaging sector.
6Wresearch actively monitors the Tajikistan Chemical Packaging Market and publishes its comprehensive annual report, highlighting emerging trends, growth drivers, revenue analysis, and forecast outlook. Our insights help businesses to make data-backed strategic decisions with ongoing market dynamics. Our analysts track relevent industries related to the Tajikistan Chemical Packaging Market, allowing our clients with actionable intelligence and reliable forecasts tailored to emerging regional needs.
Yes, we provide customisation as per your requirements. To learn more, feel free to contact us on sales@6wresearch.com
1 Executive Summary |
2 Introduction |
2.1 Key Highlights of the Report |
2.2 Report Description |
2.3 Market Scope & Segmentation |
2.4 Research Methodology |
2.5 Assumptions |
3 Tajikistan Chemical Packaging Market Overview |
3.1 Tajikistan Country Macro Economic Indicators |
3.2 Tajikistan Chemical Packaging Market Revenues & Volume, 2022 & 2032F |
3.3 Tajikistan Chemical Packaging Market - Industry Life Cycle |
3.4 Tajikistan Chemical Packaging Market - Porter's Five Forces |
3.5 Tajikistan Chemical Packaging Market Revenues & Volume Share, By Product Types, 2022 & 2032F |
3.6 Tajikistan Chemical Packaging Market Revenues & Volume Share, By Applications, 2022 & 2032F |
4 Tajikistan Chemical Packaging Market Dynamics |
4.1 Impact Analysis |
4.2 Market Drivers |
4.3 Market Restraints |
5 Tajikistan Chemical Packaging Market Trends |
6 Tajikistan Chemical Packaging Market, By Types |
6.1 Tajikistan Chemical Packaging Market, By Product Types |
6.1.1 Overview and Analysis |
6.1.2 Tajikistan Chemical Packaging Market Revenues & Volume, By Product Types, 2022-2032F |
6.1.3 Tajikistan Chemical Packaging Market Revenues & Volume, By Sacks, 2022-2032F |
6.1.4 Tajikistan Chemical Packaging Market Revenues & Volume, By Drums, 2022-2032F |
6.1.5 Tajikistan Chemical Packaging Market Revenues & Volume, By FIBC, 2022-2032F |
6.1.6 Tajikistan Chemical Packaging Market Revenues & Volume, By Other, 2022-2032F |
6.2 Tajikistan Chemical Packaging Market, By Applications |
6.2.1 Overview and Analysis |
6.2.2 Tajikistan Chemical Packaging Market Revenues & Volume, By Pharmaceutical Factory , 2022-2032F |
6.2.3 Tajikistan Chemical Packaging Market Revenues & Volume, By Laboratory, 2022-2032F |
6.2.4 Tajikistan Chemical Packaging Market Revenues & Volume, By Chemical Plant , 2022-2032F |
6.2.5 Tajikistan Chemical Packaging Market Revenues & Volume, By Others, 2022-2032F |
7 Tajikistan Chemical Packaging Market Import-Export Trade Statistics |
7.1 Tajikistan Chemical Packaging Market Export to Major Countries |
7.2 Tajikistan Chemical Packaging Market Imports from Major Countries |
8 Tajikistan Chemical Packaging Market Key Performance Indicators |
9 Tajikistan Chemical Packaging Market - Opportunity Assessment |
9.1 Tajikistan Chemical Packaging Market Opportunity Assessment, By Product Types, 2022 & 2032F |
9.2 Tajikistan Chemical Packaging Market Opportunity Assessment, By Applications, 2022 & 2032F |
10 Tajikistan Chemical Packaging Market - Competitive Landscape |
10.1 Tajikistan Chemical Packaging Market Revenue Share, By Companies, 2025 |
10.2 Tajikistan Chemical Packaging Market Competitive Benchmarking, By Operating and Technical Parameters |
11 Company Profiles |
12 Recommendations |
13 Disclaimer |
Global Go To Market Strategy - 2030
Export potential enables firms to identify high-growth global markets with greater confidence by combining advanced trade intelligence with a structured quantitative methodology. The framework analyzes emerging demand trends and country-level import patterns while integrating macroeconomic and trade datasets such as GDP and population forecasts, bilateral import–export flows, tariff structures, elasticity differentials between developed and developing economies, geographic distance, and import demand projections. Using weighted trade values from 2020–2024 as the base period to project country-to-country export potential for 2030, these inputs are operationalized through calculated drivers such as gravity model parameters, tariff impact factors, and projected GDP per-capita growth. Through an analysis of hidden potentials, demand hotspots, and market conditions that are most favorable to success, this method enables firms to focus on target countries, maximize returns, and global expansion with data, backed by accuracy.
By factoring in the projected importer demand gap that is currently unmet and could be potential opportunity, it identifies the potential for the Exporter (Country) among 190 countries, against the general trade analysis, which identifies the biggest importer or exporter.
To discover high-growth global markets and optimize your business strategy:
Click Here
Pricing
- Single User License$ 1,995
- Department License$ 2,400
- Site License$ 3,120
- Global License$ 3,795

Leadership Perspectives from Industry Events
Search
Thought Leadership and Analyst Meet


Our Clients
6WResearch In News
- India Air Conditioner Market Set for Strong Rebound in 2026 After Weather-Led Correction and GST-Driven Recovery: 6Wresearch
- ADAS in India: How Automatic Emergency Braking, Blind Spot Detection & Driver Monitoring are Transforming Road Safety
- Doha a strategic location for EV manufacturing hub: IPA Qatar
- Demand for luxury TVs surging in the GCC, says Samsung
- Empowering Growth: The Thriving Journey of Bangladesh’s Cable Industry
- Demand for luxury TVs surging in the GCC, says Samsung
Latest Reports
- Nicaragua RPG Gaming Market (2026-2032)
- New Zealand RPG Gaming Market (2026-2032)
- Netherlands RPG Gaming Market (2026-2032)
- Nauru RPG Gaming Market (2026-2032)
- Namibia RPG Gaming Market (2026-2032)
- Mozambique RPG Gaming Market (2026-2032)
- Montenegro RPG Gaming Market (2026-2032)
- Mongolia RPG Gaming Market (2026-2032)
- Monaco RPG Gaming Market (2026-2032)
- Micronesia RPG Gaming Market (2026-2032)
Industry Events and Analyst Meet

EV India Expo 2026

HIMTEX 2026

India Refining Summit 2026

India EV Show 2026

EV tech India Expo 2026
Whitepaper
- Middle East & Africa Commercial Security Market Click here to view more.
- Middle East & Africa Fire Safety Systems & Equipment Market Click here to view more.
- GCC Drone Market Click here to view more.
- Middle East Lighting Fixture Market Click here to view more.
- GCC Physical & Perimeter Security Market Click here to view more.