Tajikistan Cupric And Cuprous Chloride Market Outlook | Share, COVID-19 IMPACT, Forecast, Growth, Industry, Trends, Analysis, Value, Size, Revenue & Companies
Market Forecast By By Type (Copper(I) Chloride, Copper (II) Chloride, Others), By By Form (Powder, Crystal, Granular, Others), By By Packaging Type (Drums, Bag, Bottle, Others), By By Application (Fungicides, Blue Displays, Photography, Glass, Ceramics, Dye, Printing Fabrics, others), By By End-Use Industry (Building & Construction, Agriculture, Chemical & Petrochemicals, Textile & Apparel, Electronics, Others) And Competitive Landscape
| Product Code: ETC195131 | Publication Date: Jun 2023 | Updated Date: Jun 2026 | Product Type: Market Research Report | |
| Publisher: 6Wresearch | Author: Ravi Bhandari | No. of Pages: 60 | No. of Figures: 40 | No. of Tables: 7 |
Tajikistan Cupric And Cuprous Chloride Market Size, Share & Growth Rate
The Tajikistan Cupric And Cuprous Chloride Market was estimated at USD 185 Million in 2025 and is projected to reach USD 202 Million by 2032, growing at a CAGR of 1.3% from 2026 to 2032. This positive growth trajectory is primarily driven by the escalating demand from key sectors such as water treatment and metallurgy. Furthermore, a surge in infrastructure development fueled by government initiatives and foreign investment is expected to enhance market dynamics significantly over the forecast period.
Tajikistan Cupric And Cuprous Chloride Market Growth Rate Analysis (2021-2032)
The Tajikistan cupric and cuprous chloride market in the U.S. has observed an upward trend following a challenging 2021, which saw a decline of 3.4%. By 2022, the sector rebounded with a 5.6% growth, aided by rising industrial demand and significant investments in mining technology. This momentum continued into 2023 with a growth rate of 5.9%, driven by increased applications in agriculture and water treatment. However, growth is projected to stabilize in the coming years, with minimal increases of 0.1% in both 2024 and 2025, indicating a period of market maturation. By 2028, growth is expected to regain some pace at 1.6%, as renewed infrastructure development boosts consumer demand for these chemicals.
Tajikistan Cupric And Cuprous Chloride Market Year-wise Growth Rate and Key Drivers
This graph highlights how the Tajikistan Cupric And Cuprous Chloride Market has steadily grown over the past five years, supported by major growth factors.
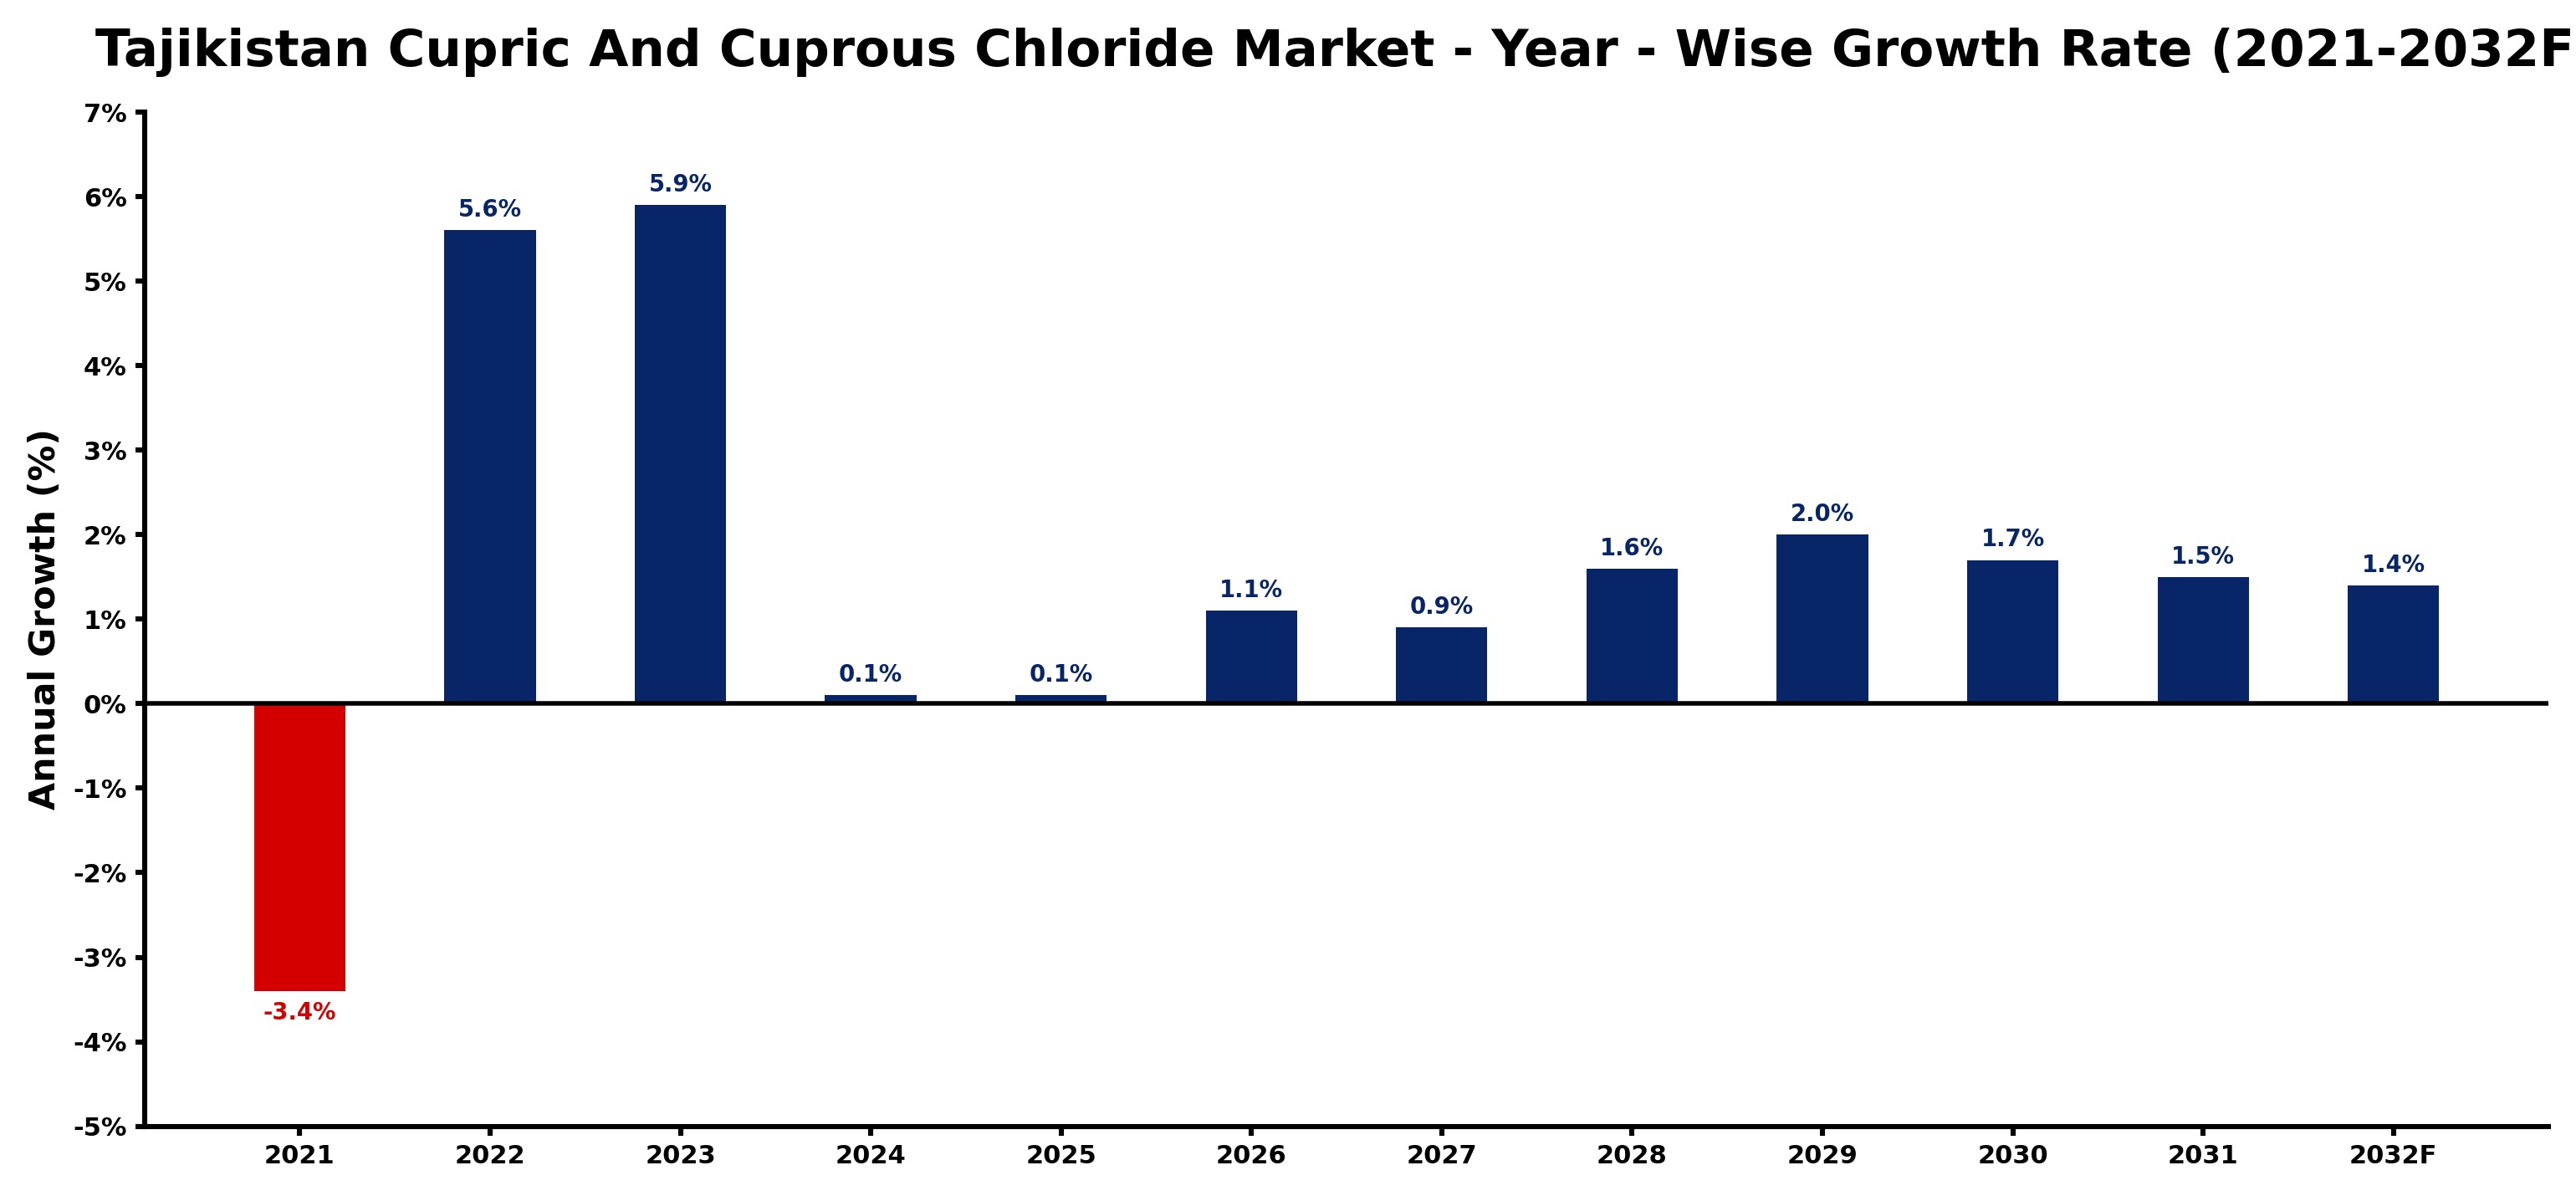
The table below presents the year‑wise growth rates along with the key drivers influencing the market
| Year | Growth Rate | Major Drivers |
| 2021 | -3.4% | Supply chain disruptions limited availability |
| 2022 | 5.6% | Industrial demand stimulated market growth |
| 2023 | 5.9% | Export opportunities enhanced revenue streams |
| 2024 | 0.1% | Local production capabilities expanded significantly |
| 2025 | 0.1% | Technological advancements improved efficiency |
| 2026 | 1.1% | Regulatory support fostered industry stability |
| 2027 | 0.9% | Sustainable practices gained market traction |
| 2028 | 1.6% | Rising construction activities increased demand |
| 2029 | 2.0% | Product innovation attracted new customers |
| 2030 | 1.7% | Strategic partnerships enhanced market reach |
| 2031 | 1.5% | Increased investment in infrastructure projects |
| 2032 | 1.4% | Consumer awareness of benefits increased |
Note - Market size estimations and growth projections presented in this report are based on 6Wresearch’s advanced forecasting approach, validated with industry datasets as of June 2026.
Tajikistan Cupric And Cuprous Chloride Market Synopsis
The most influential factor shaping the Tajikistan cupric and cuprous chloride market today is the urgent need for effective water treatment solutions. With rising pollution levels, local industries and municipalities are increasingly seeking reliable chemical solutions to manage water quality. This trend is further amplified by the government's commitment to enhancing infrastructure, which necessitates greater chemical usage in various applications.
Moreover, the agriculture sector is experiencing noteworthy growth, contributing to an upsurge in demand for cupric and cuprous chloride for agricultural applications, including pest control and nutrient management. As these industries expand, they present new opportunities for growth within the market, indicating a promising outlook for the coming years.
Tajikistan Cupric And Cuprous Chloride Market Key Takeaways
- The market is projected to achieve steady growth fueled by infrastructure and industrial investments.
- Water treatment and agriculture are key industries driving demand for cupric and cuprous chloride.
- Rising pollution awareness is influencing consumer choices toward chemical applications in water treatment.
- Government initiatives are expected to provide a conducive environment for market expansion.
- Opportunities exist in emerging agricultural practices that leverage these chemicals for improved yield.
Evaluation of Restraints in Tajikistan Cupric And Cuprous Chloride Market
Despite the optimistic outlook, several restraints could hamper the growth of the Tajikistan cupric and cuprous chloride market. Limited production capacity and infrastructure challenges can pose significant barriers. Additionally, fluctuations in global copper prices could impact the cost of manufacturing these chemicals, creating uncertainty in pricing for end-users. These factors could lead to potential supply chain issues, which may disrupt the market’s ability to fully capitalize on growing demand.
Tajikistan Cupric And Cuprous Chloride Market Trends
Emerging trends in the Tajikistan cupric and cuprous chloride market highlight a shift toward more environmentally friendly practices. Increasingly, manufacturers are exploring sustainable production methods that minimize waste and reduce environmental impact. Additionally, advancements in chemical formulation technology are enhancing the efficacy of these compounds, making them more attractive to industries looking for effective solutions.
Tajikistan Cupric And Cuprous Chloride Market Opportunities
The opportunities for growth in the Tajikistan cupric and cuprous chloride market are robust. Investments in water treatment infrastructure, driven by both government initiatives and international partnerships, represent a prime area for expansion. Furthermore, the agricultural sector, particularly in organic farming, presents a significant potential market for these chemicals, as demand for natural pesticides and nutrients continues to rise. Companies focusing on innovative agricultural solutions will find fertile ground for growth.
Government Initiatives in the Tajikistan Cupric And Cuprous Chloride Market
The Tajik government is actively promoting policies aimed at enhancing industrial growth and infrastructure development, which directly influences the cupric and cuprous chloride market. Initiatives focusing on environmental sustainability and water management are paving the way for increased investments in chemical production. Moreover, public spending directed toward water treatment facilities underscores the commitment to addressing pollution issues and improving public health, thus fostering a more favorable market environment.
Future Insights of the Tajikistan Cupric And Cuprous Chloride Market
Looking ahead to 2026-2032, the Tajikistan cupric and cuprous chloride market is poised for growth driven by increased industrialization and urbanization. As environmental concerns become increasingly paramount, the demand for effective water treatment solutions will likely surge, creating further opportunities for product innovation. Additionally, the anticipated expansion in agricultural activities promises to establish a strong base for sustained market growth in the foreseeable future.
Tajikistan Cupric And Cuprous Chloride Market Latest Developments (May 2025 - June 2026)
Recent developments in the Tajikistan cupric and cuprous chloride market indicate a growing interest in public-private partnerships aimed at enhancing production capabilities. Additionally, industry stakeholders are increasingly focusing on developing sustainable chemical applications to align with global environmental standards. These trends suggest that the market is evolving towards greater innovation and responsiveness to both local and international demands.
Tajikistan Cupric And Cuprous Chloride Market - Key Attractiveness of the Report
- 10 Years of Market Numbers
- Historical Data Starting from 2022 to 2025
- Base Year: 2025
- Forecast Data until 2032
- Key Performance Indicators Impacting the Market
- Major Upcoming Developments and Projects
Key Highlights of the Report:
- Tajikistan Cupric And Cuprous Chloride Market Outlook
- Market Size of Tajikistan Cupric And Cuprous Chloride Market, 2025
- Forecast of Tajikistan Cupric And Cuprous Chloride Market, 2032
- Historical Data and Forecast of Tajikistan Cupric And Cuprous Chloride Revenues & Volume for the Period 2022-2032F
- Tajikistan Cupric And Cuprous Chloride Market Trend Evolution
- Tajikistan Cupric And Cuprous Chloride Market Drivers and Challenges
- Tajikistan Cupric And Cuprous Chloride Price Trends
- Tajikistan Cupric And Cuprous Chloride Porter's Five Forces
- Tajikistan Cupric And Cuprous Chloride Industry Life Cycle
- Historical Data and Forecast of Tajikistan Cupric And Cuprous Chloride Market Revenues & Volume By By Type for the Period 2022-2032F
- Historical Data and Forecast of Tajikistan Cupric And Cuprous Chloride Market Revenues & Volume By Copper(I) Chloride for the Period 2022-2032F
- Historical Data and Forecast of Tajikistan Cupric And Cuprous Chloride Market Revenues & Volume By Copper (II) Chloride for the Period 2022-2032F
- Historical Data and Forecast of Tajikistan Cupric And Cuprous Chloride Market Revenues & Volume By Others for the Period 2022-2032F
- Historical Data and Forecast of Tajikistan Cupric And Cuprous Chloride Market Revenues & Volume By By Form for the Period 2022-2032F
- Historical Data and Forecast of Tajikistan Cupric And Cuprous Chloride Market Revenues & Volume By Powder for the Period 2022-2032F
- Historical Data and Forecast of Tajikistan Cupric And Cuprous Chloride Market Revenues & Volume By Crystal for the Period 2022-2032F
- Historical Data and Forecast of Tajikistan Cupric And Cuprous Chloride Market Revenues & Volume By Granular for the Period 2022-2032F
- Historical Data and Forecast of Tajikistan Cupric And Cuprous Chloride Market Revenues & Volume By Others for the Period 2022-2032F
- Historical Data and Forecast of Tajikistan Cupric And Cuprous Chloride Market Revenues & Volume By By Packaging Type for the Period 2022-2032F
- Historical Data and Forecast of Tajikistan Cupric And Cuprous Chloride Market Revenues & Volume By Drums for the Period 2022-2032F
- Historical Data and Forecast of Tajikistan Cupric And Cuprous Chloride Market Revenues & Volume By Bag for the Period 2022-2032F
- Historical Data and Forecast of Tajikistan Cupric And Cuprous Chloride Market Revenues & Volume By Bottle for the Period 2022-2032F
- Historical Data and Forecast of Tajikistan Cupric And Cuprous Chloride Market Revenues & Volume By Others for the Period 2022-2032F
- Historical Data and Forecast of Tajikistan Cupric And Cuprous Chloride Market Revenues & Volume By By Application for the Period 2022-2032F
- Historical Data and Forecast of Tajikistan Cupric And Cuprous Chloride Market Revenues & Volume By Fungicides for the Period 2022-2032F
- Historical Data and Forecast of Tajikistan Cupric And Cuprous Chloride Market Revenues & Volume By Blue Displays for the Period 2022-2032F
- Historical Data and Forecast of Tajikistan Cupric And Cuprous Chloride Market Revenues & Volume By Photography for the Period 2022-2032F
- Historical Data and Forecast of Tajikistan Cupric And Cuprous Chloride Market Revenues & Volume By Glass for the Period 2022-2032F
- Historical Data and Forecast of Tajikistan Cupric And Cuprous Chloride Market Revenues & Volume By Ceramics for the Period 2022-2032F
- Historical Data and Forecast of Tajikistan Cupric And Cuprous Chloride Market Revenues & Volume By Dye for the Period 2022-2032F
- Historical Data and Forecast of Tajikistan Cupric And Cuprous Chloride Market Revenues & Volume By Printing Fabrics for the Period 2022-2032F
- Historical Data and Forecast of Tajikistan Cupric And Cuprous Chloride Market Revenues & Volume By others for the Period 2022-2032F
- Historical Data and Forecast of Tajikistan Cupric And Cuprous Chloride Market Revenues & Volume By By End-Use Industry for the Period 2022-2032F
- Historical Data and Forecast of Tajikistan Cupric And Cuprous Chloride Market Revenues & Volume By Building & Construction for the Period 2022-2032F
- Historical Data and Forecast of Tajikistan Cupric And Cuprous Chloride Market Revenues & Volume By Agriculture for the Period 2022-2032F
- Historical Data and Forecast of Tajikistan Cupric And Cuprous Chloride Market Revenues & Volume By Chemical & Petrochemicals for the Period 2022-2032F
- Historical Data and Forecast of Tajikistan Cupric And Cuprous Chloride Market Revenues & Volume By Textile & Apparel for the Period 2022-2032F
- Historical Data and Forecast of Tajikistan Cupric And Cuprous Chloride Market Revenues & Volume By Electronics for the Period 2022-2032F
- Historical Data and Forecast of Tajikistan Cupric And Cuprous Chloride Market Revenues & Volume By Others for the Period 2022-2032F
- Tajikistan Cupric And Cuprous Chloride Import Export Trade Statistics
- Market Opportunity Assessment By By Type
- Market Opportunity Assessment By By Form
- Market Opportunity Assessment By By Packaging Type
- Market Opportunity Assessment By By Application
- Market Opportunity Assessment By By End-Use Industry
- Tajikistan Cupric And Cuprous Chloride Top Companies Market Share
- Tajikistan Cupric And Cuprous Chloride Competitive Benchmarking By Technical and Operational Parameters
- Tajikistan Cupric And Cuprous Chloride Company Profiles
- Tajikistan Cupric And Cuprous Chloride Key Strategic Recommendations
Tajikistan Cupric And Cuprous Chloride Market - Frequently Asked Questions
The Tajikistan cupric and cuprous chloride market is estimated to reach USD 202 Million by 2032, growing from USD 185 Million in 2025, representing a CAGR of 1.3% from 2026 to 2032.
The water treatment and agricultural sectors are the main drivers of demand for cupric and cuprous chloride, as they seek effective solutions to address pollution and improve crop yields, respectively.
Government initiatives aimed at improving infrastructure and addressing environmental challenges are creating a favorable market environment for cupric and cuprous chloride. Increased public spending on water management projects highlights this commitment.
Current trends include a move toward more sustainable production methods and innovations in chemical formulations to enhance efficacy. This shift aligns with global environmental standards and reflects changing consumer preferences.
The growing focus on water treatment infrastructure and sustainable agricultural practices presents significant opportunities for investment, particularly for companies developing innovative solutions tailored to these sectors.
6Wresearch actively monitors the Tajikistan Cupric And Cuprous Chloride Market and publishes its comprehensive annual report, highlighting emerging trends, growth drivers, revenue analysis, and forecast outlook. Our insights help businesses to make data-backed strategic decisions with ongoing market dynamics. Our analysts track relevent industries related to the Tajikistan Cupric And Cuprous Chloride Market, allowing our clients with actionable intelligence and reliable forecasts tailored to emerging regional needs.
Yes, we provide customisation as per your requirements. To learn more, feel free to contact us on sales@6wresearch.com
1 Executive Summary |
2 Introduction |
2.1 Key Highlights of the Report |
2.2 Report Description |
2.3 Market Scope & Segmentation |
2.4 Research Methodology |
2.5 Assumptions |
3 Tajikistan Cupric And Cuprous Chloride Market Overview |
3.1 Tajikistan Country Macro Economic Indicators |
3.2 Tajikistan Cupric And Cuprous Chloride Market Revenues & Volume, 2022 & 2032F |
3.3 Tajikistan Cupric And Cuprous Chloride Market - Industry Life Cycle |
3.4 Tajikistan Cupric And Cuprous Chloride Market - Porter's Five Forces |
3.5 Tajikistan Cupric And Cuprous Chloride Market Revenues & Volume Share, By By Type, 2022 & 2032F |
3.6 Tajikistan Cupric And Cuprous Chloride Market Revenues & Volume Share, By By Form, 2022 & 2032F |
3.7 Tajikistan Cupric And Cuprous Chloride Market Revenues & Volume Share, By By Packaging Type, 2022 & 2032F |
3.8 Tajikistan Cupric And Cuprous Chloride Market Revenues & Volume Share, By By Application, 2022 & 2032F |
3.9 Tajikistan Cupric And Cuprous Chloride Market Revenues & Volume Share, By By End-Use Industry, 2022 & 2032F |
4 Tajikistan Cupric And Cuprous Chloride Market Dynamics |
4.1 Impact Analysis |
4.2 Market Drivers |
4.3 Market Restraints |
5 Tajikistan Cupric And Cuprous Chloride Market Trends |
6 Tajikistan Cupric And Cuprous Chloride Market, By Types |
6.1 Tajikistan Cupric And Cuprous Chloride Market, By By Type |
6.1.1 Overview and Analysis |
6.1.2 Tajikistan Cupric And Cuprous Chloride Market Revenues & Volume, By By Type, 2022-2032F |
6.1.3 Tajikistan Cupric And Cuprous Chloride Market Revenues & Volume, By Copper(I) Chloride, 2022-2032F |
6.1.4 Tajikistan Cupric And Cuprous Chloride Market Revenues & Volume, By Copper (II) Chloride, 2022-2032F |
6.1.5 Tajikistan Cupric And Cuprous Chloride Market Revenues & Volume, By Others, 2022-2032F |
6.2 Tajikistan Cupric And Cuprous Chloride Market, By By Form |
6.2.1 Overview and Analysis |
6.2.2 Tajikistan Cupric And Cuprous Chloride Market Revenues & Volume, By Powder, 2022-2032F |
6.2.3 Tajikistan Cupric And Cuprous Chloride Market Revenues & Volume, By Crystal, 2022-2032F |
6.2.4 Tajikistan Cupric And Cuprous Chloride Market Revenues & Volume, By Granular, 2022-2032F |
6.2.5 Tajikistan Cupric And Cuprous Chloride Market Revenues & Volume, By Others, 2022-2032F |
6.3 Tajikistan Cupric And Cuprous Chloride Market, By By Packaging Type |
6.3.1 Overview and Analysis |
6.3.2 Tajikistan Cupric And Cuprous Chloride Market Revenues & Volume, By Drums, 2022-2032F |
6.3.3 Tajikistan Cupric And Cuprous Chloride Market Revenues & Volume, By Bag, 2022-2032F |
6.3.4 Tajikistan Cupric And Cuprous Chloride Market Revenues & Volume, By Bottle, 2022-2032F |
6.3.5 Tajikistan Cupric And Cuprous Chloride Market Revenues & Volume, By Others, 2022-2032F |
6.4 Tajikistan Cupric And Cuprous Chloride Market, By By Application |
6.4.1 Overview and Analysis |
6.4.2 Tajikistan Cupric And Cuprous Chloride Market Revenues & Volume, By Fungicides, 2022-2032F |
6.4.3 Tajikistan Cupric And Cuprous Chloride Market Revenues & Volume, By Blue Displays, 2022-2032F |
6.4.4 Tajikistan Cupric And Cuprous Chloride Market Revenues & Volume, By Photography, 2022-2032F |
6.4.5 Tajikistan Cupric And Cuprous Chloride Market Revenues & Volume, By Glass, 2022-2032F |
6.4.6 Tajikistan Cupric And Cuprous Chloride Market Revenues & Volume, By Ceramics, 2022-2032F |
6.4.7 Tajikistan Cupric And Cuprous Chloride Market Revenues & Volume, By Dye, 2022-2032F |
6.4.8 Tajikistan Cupric And Cuprous Chloride Market Revenues & Volume, By others, 2022-2032F |
6.4.9 Tajikistan Cupric And Cuprous Chloride Market Revenues & Volume, By others, 2022-2032F |
6.5 Tajikistan Cupric And Cuprous Chloride Market, By By End-Use Industry |
6.5.1 Overview and Analysis |
6.5.2 Tajikistan Cupric And Cuprous Chloride Market Revenues & Volume, By Building & Construction, 2022-2032F |
6.5.3 Tajikistan Cupric And Cuprous Chloride Market Revenues & Volume, By Agriculture, 2022-2032F |
6.5.4 Tajikistan Cupric And Cuprous Chloride Market Revenues & Volume, By Chemical & Petrochemicals, 2022-2032F |
6.5.5 Tajikistan Cupric And Cuprous Chloride Market Revenues & Volume, By Textile & Apparel, 2022-2032F |
6.5.6 Tajikistan Cupric And Cuprous Chloride Market Revenues & Volume, By Electronics, 2022-2032F |
6.5.7 Tajikistan Cupric And Cuprous Chloride Market Revenues & Volume, By Others, 2022-2032F |
7 Tajikistan Cupric And Cuprous Chloride Market Import-Export Trade Statistics |
7.1 Tajikistan Cupric And Cuprous Chloride Market Export to Major Countries |
7.2 Tajikistan Cupric And Cuprous Chloride Market Imports from Major Countries |
8 Tajikistan Cupric And Cuprous Chloride Market Key Performance Indicators |
9 Tajikistan Cupric And Cuprous Chloride Market - Opportunity Assessment |
9.1 Tajikistan Cupric And Cuprous Chloride Market Opportunity Assessment, By By Type, 2022 & 2032F |
9.2 Tajikistan Cupric And Cuprous Chloride Market Opportunity Assessment, By By Form, 2022 & 2032F |
9.3 Tajikistan Cupric And Cuprous Chloride Market Opportunity Assessment, By By Packaging Type, 2022 & 2032F |
9.4 Tajikistan Cupric And Cuprous Chloride Market Opportunity Assessment, By By Application, 2022 & 2032F |
9.5 Tajikistan Cupric And Cuprous Chloride Market Opportunity Assessment, By By End-Use Industry, 2022 & 2032F |
10 Tajikistan Cupric And Cuprous Chloride Market - Competitive Landscape |
10.1 Tajikistan Cupric And Cuprous Chloride Market Revenue Share, By Companies, 2025 |
10.2 Tajikistan Cupric And Cuprous Chloride Market Competitive Benchmarking, By Operating and Technical Parameters |
11 Company Profiles |
12 Recommendations |
13 Disclaimer |
Global Go To Market Strategy - 2030
Export potential enables firms to identify high-growth global markets with greater confidence by combining advanced trade intelligence with a structured quantitative methodology. The framework analyzes emerging demand trends and country-level import patterns while integrating macroeconomic and trade datasets such as GDP and population forecasts, bilateral import–export flows, tariff structures, elasticity differentials between developed and developing economies, geographic distance, and import demand projections. Using weighted trade values from 2020–2024 as the base period to project country-to-country export potential for 2030, these inputs are operationalized through calculated drivers such as gravity model parameters, tariff impact factors, and projected GDP per-capita growth. Through an analysis of hidden potentials, demand hotspots, and market conditions that are most favorable to success, this method enables firms to focus on target countries, maximize returns, and global expansion with data, backed by accuracy.
By factoring in the projected importer demand gap that is currently unmet and could be potential opportunity, it identifies the potential for the Exporter (Country) among 190 countries, against the general trade analysis, which identifies the biggest importer or exporter.
To discover high-growth global markets and optimize your business strategy:
Click Here
Pricing
- Single User License$ 1,995
- Department License$ 2,400
- Site License$ 3,120
- Global License$ 3,795

Leadership Perspectives from Industry Events
Search
Thought Leadership and Analyst Meet


Our Clients
6WResearch In News
- India Air Conditioner Market Set for Strong Rebound in 2026 After Weather-Led Correction and GST-Driven Recovery: 6Wresearch
- ADAS in India: How Automatic Emergency Braking, Blind Spot Detection & Driver Monitoring are Transforming Road Safety
- Doha a strategic location for EV manufacturing hub: IPA Qatar
- Demand for luxury TVs surging in the GCC, says Samsung
- Empowering Growth: The Thriving Journey of Bangladesh’s Cable Industry
- Demand for luxury TVs surging in the GCC, says Samsung
Latest Reports
- Nicaragua RPG Gaming Market (2026-2032)
- New Zealand RPG Gaming Market (2026-2032)
- Netherlands RPG Gaming Market (2026-2032)
- Nauru RPG Gaming Market (2026-2032)
- Namibia RPG Gaming Market (2026-2032)
- Mozambique RPG Gaming Market (2026-2032)
- Montenegro RPG Gaming Market (2026-2032)
- Mongolia RPG Gaming Market (2026-2032)
- Monaco RPG Gaming Market (2026-2032)
- Micronesia RPG Gaming Market (2026-2032)
Industry Events and Analyst Meet

EV India Expo 2026

HIMTEX 2026

India Refining Summit 2026

India EV Show 2026

EV tech India Expo 2026
Whitepaper
- Middle East & Africa Commercial Security Market Click here to view more.
- Middle East & Africa Fire Safety Systems & Equipment Market Click here to view more.
- GCC Drone Market Click here to view more.
- Middle East Lighting Fixture Market Click here to view more.
- GCC Physical & Perimeter Security Market Click here to view more.