Tajikistan Potassium Cyanate Market Outlook | Share, Size, Revenue, Industry, Forecast, Growth, Analysis, Companies, COVID-19 IMPACT, Trends & Value
Market Forecast By Types (Low Purity, High Purity), By Applications (Gold Plating, Electronic Devices, Jewelry and Watches, Fashion items, Others) And Competitive Landscape
| Product Code: ETC204491 | Publication Date: May 2022 | Updated Date: Jul 2026 | Product Type: Market Research Report | |
| Publisher: 6Wresearch | Author: Ravi Bhandari | No. of Pages: 60 | No. of Figures: 40 | No. of Tables: 7 |
Tajikistan Potassium Cyanate Market Size, Share & Growth Rate
The Tajikistan Potassium Cyanate Market was estimated at USD 948 Million in 2025 and is projected to reach USD 1380 Million by 2032, growing at a CAGR of 5.5% from 2026 to 2032. This promising trajectory is primarily fueled by increasing demand across various industrial applications, particularly in agriculture and pharmaceuticals. The countrys expanding chemical manufacturing sector further bolsters the market, creating a robust environment for potassium cyanate utilization.
Tajikistan Potassium Cyanate Market Growth Rate Analysis (2021-2032)
The Tajikistan potassium cyanate market has shown remarkable resilience, with growth rates fluctuating between 6.1% and 6.7% from 2021 to 2032. Following a solid 6.5% growth in 2021 and 2023, the market faced a slight dip to 6.1% in 2022 and 2024. This periodic decline can be attributed to regulatory adjustments and shifts in consumer demand. However, the sustained interest in technological advancements and a growing demand for potassium cyanate in agriculture, pharmaceuticals, and chemical industries have propelled growth upwards again, culminating in a robust 6.7% by 2028. The ongoing energy transition strategies and investments in infrastructure are further supporting this stable upward trend, ensuring a positive outlook for the coming years.
Tajikistan Potassium Cyanate Market Year-wise Growth Rate and Key Drivers
This graph highlights how the Tajikistan Potassium Cyanate Market has steadily grown over the past five years, supported by major growth factors.
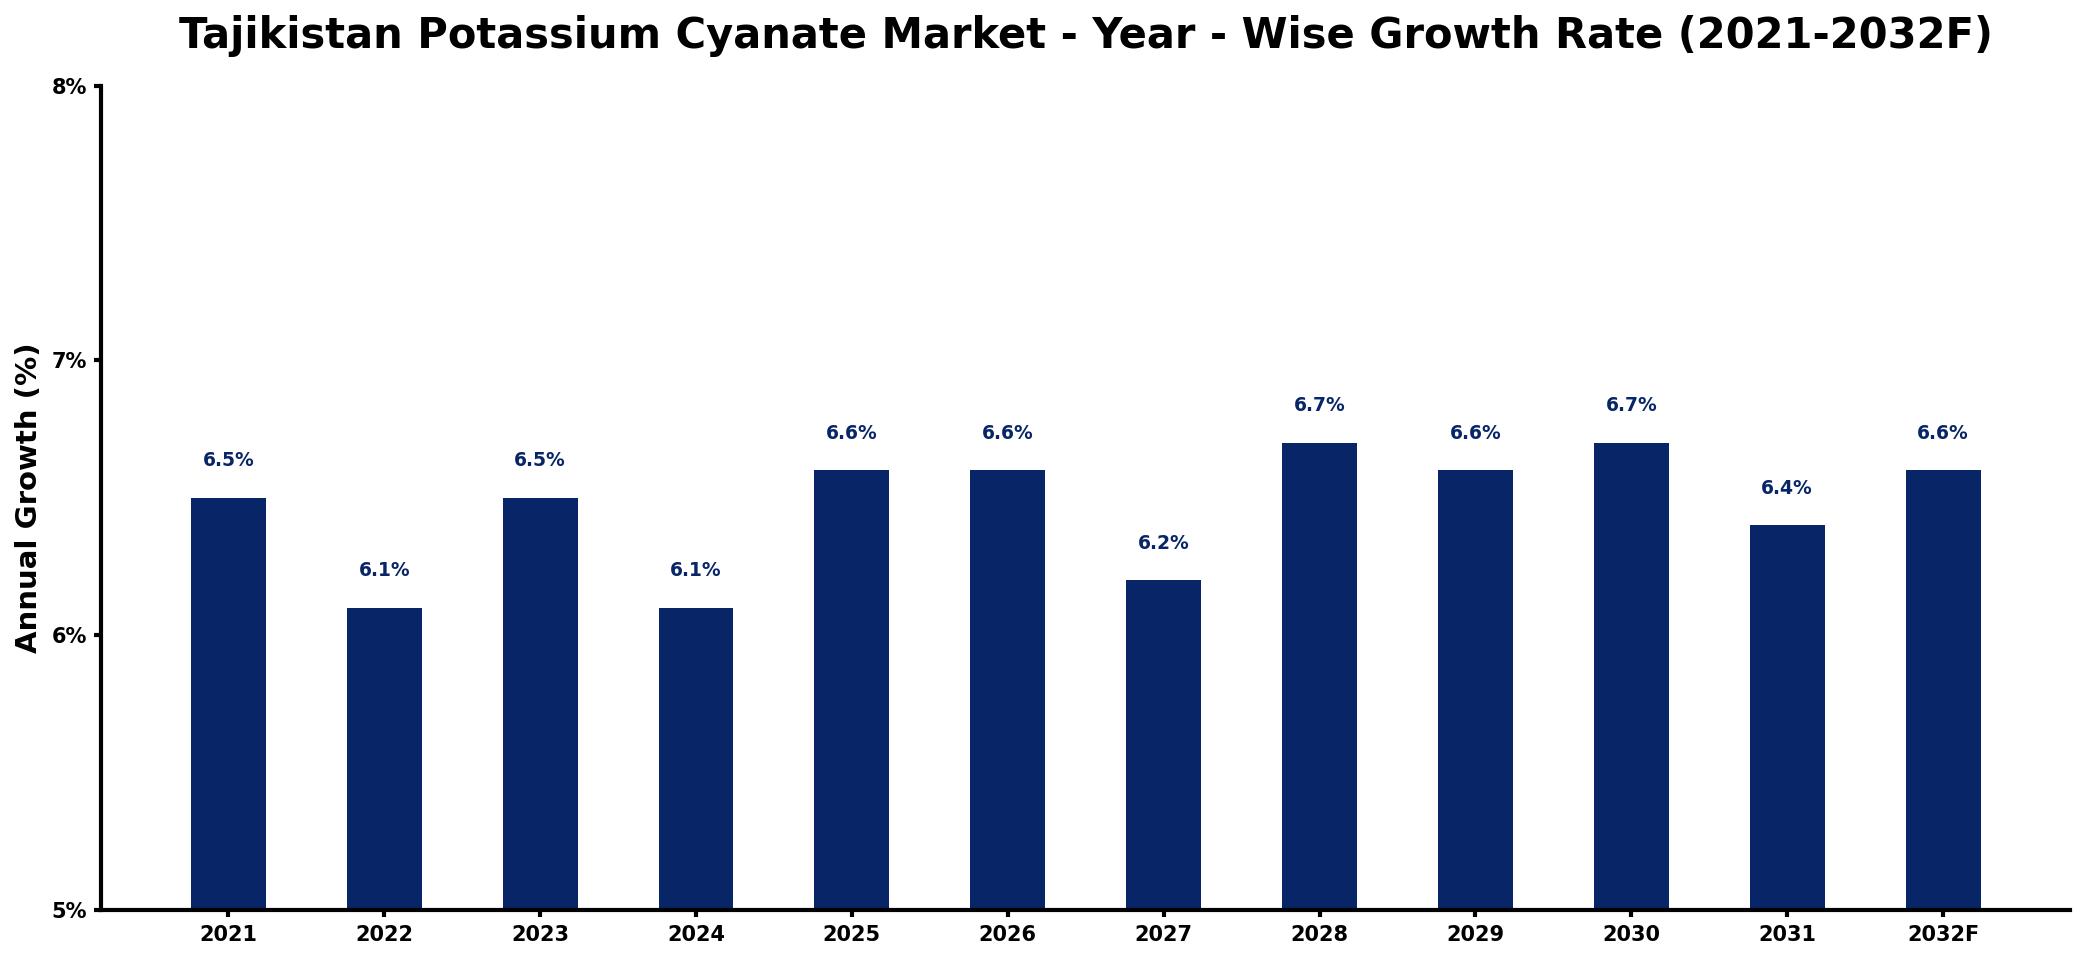
The table below presents the year‑wise growth rates along with the key drivers influencing the market
| Year | Growth Rate | Major Drivers |
| 2021 | 6.5% | Rising agricultural sector investments |
| 2022 | 6.1% | Increased demand from pharmaceuticals |
| 2023 | 6.5% | Growth in chemical manufacturing sectors |
| 2024 | 6.1% | Expanding industrial applications utilization |
| 2025 | 6.6% | Higher requirements in mining sector |
| 2026 | 6.6% | Boost in research and development |
| 2027 | 6.2% | Emerging market for specialty chemicals |
| 2028 | 6.7% | Increased exports to neighboring countries |
| 2029 | 6.6% | Expansion of logistics and transportation |
| 2030 | 6.7% | Growing consumer electronics production |
| 2031 | 6.4% | Rising environmental compliance standards |
| 2032 | 6.6% | Technological advancements in production |
Note: Market size estimations and growth projections presented in this report are based on 6Wresearch's proprietary forecasting methodology, utilizing the latest available industry data, government publications, and primary research inputs.
Tajikistan Potassium Cyanate Market Synopsis
Potassium cyanate is gaining significant traction in Tajikistan, primarily due to its pivotal role as a precursor in the synthesis of various chemicals. The demand in the agricultural sector, driven by the need for effective herbicides and fertilizers, is particularly noteworthy.
Moreover, the pharmaceutical industry is gradually recognizing the value of potassium cyanate in drug formulation, further amplifying its market presence. With the support of governmental initiatives promoting chemical production, the overall market outlook appears increasingly positive.
Tajikistan Potassium Cyanate Market Key Takeaways
- Strong growth projected with a market size increase to USD 1380 Million by 2032.
- Growth driven by rising demand in agriculture and pharmaceutical sectors.
- Expanding local manufacturing capabilities enhancing market potential.
- Governmental support for chemical industry growth influencing market dynamics.
- Customization options for market analysis to meet specific business needs.
Evaluation of Restraints in Tajikistan Potassium Cyanate Market
Despite its potential, the Tajikistan Potassium Cyanate Market faces several restraints that could impede its growth. Regulatory constraints related to chemical production and environmental concerns are significant hurdles. Additionally, fluctuations in raw material availability and pricing can disrupt supply chains, posing challenges for manufacturers and ultimately affecting market stability. Furthermore, limited awareness regarding the diverse applications of potassium cyanate among end-users may hinder market expansion.
Tajikistan Potassium Cyanate Market Trends
Current trends indicate a shift towards sustainable agricultural practices, which is driving interest in environmentally friendly herbicides containing potassium cyanate. Moreover, advancements in chemical manufacturing technologies are enhancing the efficiency of potassium cyanate production, ultimately reducing costs. The integration of digital tools in supply chain management is also gaining traction, facilitating better tracking and distribution of potassium cyanate products.
Tajikistan Potassium Cyanate Market Opportunities
Significant growth and investment opportunities lie in the development of high-performance agricultural solutions that utilize potassium cyanate. The increasing focus on organic farming presents a fertile ground for product innovation. Additionally, partnerships between local manufacturers and international research organizations could lead to breakthroughs in application techniques, enhancing the market's attractiveness.
Government Initiatives in the Tajikistan Potassium Cyanate Market
The Tajikistan government is actively promoting the growth of its chemical manufacturing sector through various initiatives. Policies aimed at enhancing local production capabilities and encouraging foreign investments are set to shape the industry landscape. Additionally, public spending on agricultural development is likely to facilitate a favorable environment for potassium cyanate applications.
Future Insights of the Tajikistan Potassium Cyanate Market
Looking ahead to 2026-2032, the Tajikistan Potassium Cyanate Market is expected to thrive, propelled by ongoing industrial advancements and rising demand in agriculture and pharmaceuticals. As awareness of its applications grows, we anticipate a significant uptick in its adoption across various sectors. The increasing inclination towards sustainable practices will also provide a vital boost, positioning the market for sustained growth.
Tajikistan Potassium Cyanate Market Latest Developments (2025 - 2026)
Recent developments indicate a heightened focus on research and development activities within the Tajikistan Potassium Cyanate Market. Innovations aimed at improving the efficiency of chemical synthesis processes are emerging, alongside increased collaborations between academic institutions and industry stakeholders. Additionally, a greater emphasis on regulatory compliance and environmental sustainability is shaping the industry's future direction.
Tajikistan Potassium Cyanate Market - Key Attractiveness of the Report
- 10 Years of Market Numbers
- Historical Data Starting from 2022 to 2025
- Base Year: 2025
- Forecast Data until 2032
- Key Performance Indicators Impacting the Market
- Major Upcoming Developments and Projects
Key Highlights of the Report:
- Tajikistan Potassium Cyanate Market Outlook
- Market Size of Tajikistan Potassium Cyanate Market, 2025
- Forecast of Tajikistan Potassium Cyanate Market, 2032
- Historical Data and Forecast of Tajikistan Potassium Cyanate Revenues & Volume for the Period 2022-2032F
- Tajikistan Potassium Cyanate Market Trend Evolution
- Tajikistan Potassium Cyanate Market Drivers and Challenges
- Tajikistan Potassium Cyanate Price Trends
- Tajikistan Potassium Cyanate Porter's Five Forces
- Tajikistan Potassium Cyanate Industry Life Cycle
- Historical Data and Forecast of Tajikistan Potassium Cyanate Market Revenues & Volume By By Types for the Period 2022-2032F
- Historical Data and Forecast of Tajikistan Potassium Cyanate Market Revenues & Volume By Low Purity for the Period 2022-2032F
- Historical Data and Forecast of Tajikistan Potassium Cyanate Market Revenues & Volume By High Purity for the Period 2022-2032F
- Historical Data and Forecast of Tajikistan Potassium Cyanate Market Revenues & Volume By By Applications for the Period 2022-2032F
- Historical Data and Forecast of Tajikistan Potassium Cyanate Market Revenues & Volume By Gold Plating for the Period 2022-2032F
- Historical Data and Forecast of Tajikistan Potassium Cyanate Market Revenues & Volume By Electronic Devices for the Period 2022-2032F
- Historical Data and Forecast of Tajikistan Potassium Cyanate Market Revenues & Volume By Jewelry and Watches for the Period 2022-2032F
- Historical Data and Forecast of Tajikistan Potassium Cyanate Market Revenues & Volume By Fashion items for the Period 2022-2032F
- Historical Data and Forecast of Tajikistan Potassium Cyanate Market Revenues & Volume By Others for the Period 2022-2032F
- Tajikistan Potassium Cyanate Import Export Trade Statistics
- Market Opportunity Assessment By By Types
- Market Opportunity Assessment By By Applications
- Tajikistan Potassium Cyanate Top Companies Market Share
- Tajikistan Potassium Cyanate Competitive Benchmarking By Technical and Operational Parameters
- Tajikistan Potassium Cyanate Company Profiles
- Tajikistan Potassium Cyanate Key Strategic Recommendations
Frequently Asked Questions About the Market Study (FAQs):
The market is estimated to be valued at USD 948 Million in 2025, with projections reaching USD 1380 Million by 2032, translating to a CAGR of 5.5% from 2026 to 2032.
The agricultural sector is a primary driver, using potassium cyanate in herbicides and fertilizers. Additionally, the pharmaceutical industry is increasingly recognizing its utility in drug formulation.
Key factors include rising agricultural demand, growth in pharmaceutical applications, and supportive government policies aimed at enhancing local chemical production.
Yes, manufacturers encounter regulatory constraints and potential supply chain disruptions due to fluctuations in raw material costs and availability, which can affect production stability.
The market is adapting by exploring environmentally friendly alternatives and sustainable practices in agricultural applications, increasing the interest in potassium cyanate as a green solution.
6Wresearch actively monitors the Tajikistan Potassium Cyanate Market and publishes its comprehensive annual report, highlighting emerging trends, growth drivers, revenue analysis, and forecast outlook. Our insights help businesses to make data-backed strategic decisions with ongoing market dynamics. Our analysts track relevent industries related to the Tajikistan Potassium Cyanate Market, allowing our clients with actionable intelligence and reliable forecasts tailored to emerging regional needs.
Yes, we provide customisation as per your requirements. To learn more, feel free to contact us on sales@6wresearch.com
|
1 Executive Summary |
|
2 Introduction |
|
2.1 Key Highlights of the Report |
|
2.2 Report Description |
|
2.3 Market Scope & Segmentation |
|
2.4 Research Methodology |
|
2.5 Assumptions |
|
3 Tajikistan Potassium Cyanate Market Overview |
|
3.1 Tajikistan Country Macro Economic Indicators |
|
3.2 Tajikistan Potassium Cyanate Market Revenues & Volume, 2022 & 2032F |
|
3.3 Tajikistan Potassium Cyanate Market - Industry Life Cycle |
|
3.4 Tajikistan Potassium Cyanate Market - Porter's Five Forces |
|
3.5 Tajikistan Potassium Cyanate Market Revenues & Volume Share, By By Types, 2022 & 2032F |
|
3.6 Tajikistan Potassium Cyanate Market Revenues & Volume Share, By By Applications, 2022 & 2032F |
|
4 Tajikistan Potassium Cyanate Market Dynamics |
|
4.1 Impact Analysis |
|
4.2 Market Drivers |
|
4.2.1 Increasing demand for potassium cyanate in industries such as agriculture, pharmaceuticals, and chemical manufacturing |
|
4.2.2 Growing investments in infrastructure development and industrial expansion in Tajikistan |
|
4.2.3 Favorable government policies and regulations supporting the growth of the chemical industry in the country |
|
4.3 Market Restraints |
|
4.3.1 Fluctuating prices of raw materials used in potassium cyanate production |
|
4.3.2 Environmental concerns and regulations related to chemical manufacturing |
|
4.3.3 Competition from alternative chemicals or substitutes in the market |
|
5 Tajikistan Potassium Cyanate Market Trends |
|
6 Tajikistan Potassium Cyanate Market, By Types |
|
6.1 Tajikistan Potassium Cyanate Market, By By Types |
|
6.1.1 Overview and Analysis |
|
6.1.2 Tajikistan Potassium Cyanate Market Revenues & Volume, By By Types, 2022-2032F |
|
6.1.3 Tajikistan Potassium Cyanate Market Revenues & Volume, By Low Purity, 2022-2032F |
|
6.1.4 Tajikistan Potassium Cyanate Market Revenues & Volume, By High Purity, 2022-2032F |
|
6.2 Tajikistan Potassium Cyanate Market, By By Applications |
|
6.2.1 Overview and Analysis |
|
6.2.2 Tajikistan Potassium Cyanate Market Revenues & Volume, By Gold Plating, 2022-2032F |
|
6.2.3 Tajikistan Potassium Cyanate Market Revenues & Volume, By Electronic Devices, 2022-2032F |
|
6.2.4 Tajikistan Potassium Cyanate Market Revenues & Volume, By Jewelry and Watches, 2022-2032F |
|
6.2.5 Tajikistan Potassium Cyanate Market Revenues & Volume, By Fashion items, 2022-2032F |
|
6.2.6 Tajikistan Potassium Cyanate Market Revenues & Volume, By Others, 2022-2032F |
|
7 Tajikistan Potassium Cyanate Market Import-Export Trade Statistics |
|
7.1 Tajikistan Potassium Cyanate Market Export to Major Countries |
|
7.2 Tajikistan Potassium Cyanate Market Imports from Major Countries |
|
8 Tajikistan Potassium Cyanate Market Key Performance Indicators |
8.1 Average selling price of potassium cyanate in Tajikistan |
8.2 Number of new industrial projects using potassium cyanate in the country |
8.3 Export volume of potassium cyanate from Tajikistan |
8.4 Research and development investments in improving potassium cyanate production processes |
8.5 Percentage of market share held by Tajikistan in the global potassium cyanate market |
|
9 Tajikistan Potassium Cyanate Market - Opportunity Assessment |
|
9.1 Tajikistan Potassium Cyanate Market Opportunity Assessment, By By Types, 2022 & 2032F |
|
9.2 Tajikistan Potassium Cyanate Market Opportunity Assessment, By By Applications, 2022 & 2032F |
|
10 Tajikistan Potassium Cyanate Market - Competitive Landscape |
|
10.1 Tajikistan Potassium Cyanate Market Revenue Share, By Companies, 2025 |
|
10.2 Tajikistan Potassium Cyanate Market Competitive Benchmarking, By Operating and Technical Parameters |
|
11 Company Profiles |
|
12 Recommendations |
|
13 Disclaimer |
Global Go To Market Strategy - 2030
Export potential enables firms to identify high-growth global markets with greater confidence by combining advanced trade intelligence with a structured quantitative methodology. The framework analyzes emerging demand trends and country-level import patterns while integrating macroeconomic and trade datasets such as GDP and population forecasts, bilateral import–export flows, tariff structures, elasticity differentials between developed and developing economies, geographic distance, and import demand projections. Using weighted trade values from 2020–2024 as the base period to project country-to-country export potential for 2030, these inputs are operationalized through calculated drivers such as gravity model parameters, tariff impact factors, and projected GDP per-capita growth. Through an analysis of hidden potentials, demand hotspots, and market conditions that are most favorable to success, this method enables firms to focus on target countries, maximize returns, and global expansion with data, backed by accuracy.
By factoring in the projected importer demand gap that is currently unmet and could be potential opportunity, it identifies the potential for the Exporter (Country) among 190 countries, against the general trade analysis, which identifies the biggest importer or exporter.
To discover high-growth global markets and optimize your business strategy:
Click Here
Pricing
- Single User License$ 1,995
- Department License$ 2,400
- Site License$ 3,120
- Global License$ 3,795

Leadership Perspectives from Industry Events
Search
Thought Leadership and Analyst Meet


Our Clients
6WResearch In News
- India Air Conditioner Market Set for Strong Rebound in 2026 After Weather-Led Correction and GST-Driven Recovery: 6Wresearch
- ADAS in India: How Automatic Emergency Braking, Blind Spot Detection & Driver Monitoring are Transforming Road Safety
- Doha a strategic location for EV manufacturing hub: IPA Qatar
- Demand for luxury TVs surging in the GCC, says Samsung
- Empowering Growth: The Thriving Journey of Bangladesh’s Cable Industry
- Demand for luxury TVs surging in the GCC, says Samsung
Latest Reports
- Nicaragua RPG Gaming Market (2026-2032)
- New Zealand RPG Gaming Market (2026-2032)
- Netherlands RPG Gaming Market (2026-2032)
- Nauru RPG Gaming Market (2026-2032)
- Namibia RPG Gaming Market (2026-2032)
- Mozambique RPG Gaming Market (2026-2032)
- Montenegro RPG Gaming Market (2026-2032)
- Mongolia RPG Gaming Market (2026-2032)
- Monaco RPG Gaming Market (2026-2032)
- Micronesia RPG Gaming Market (2026-2032)
Industry Events and Analyst Meet

EV India Expo 2026

HIMTEX 2026

India Refining Summit 2026

India EV Show 2026

EV tech India Expo 2026
Whitepaper
- Middle East & Africa Commercial Security Market Click here to view more.
- Middle East & Africa Fire Safety Systems & Equipment Market Click here to view more.
- GCC Drone Market Click here to view more.
- Middle East Lighting Fixture Market Click here to view more.
- GCC Physical & Perimeter Security Market Click here to view more.