Tanzania Aluminium Sulphate Market (2026-2032) Outlook | Share, Growth, Industry, Analysis, Revenue, Size, Value, Forecast, Trends & Companies
Market Forecast By Applications (Food and beverages industry, Health care industry, Water purification and water treatment plants, Pepper industry, Others), By Functionality (As an additive, As BOD and COD removal, Colour removal, Cell separation), By Product Form (Liquid, Solid) And Competitive Landscape
| Product Code: ETC194887 | Publication Date: May 2022 | Updated Date: Jun 2026 | Product Type: Market Research Report | |
| Publisher: 6Wresearch | Author: Ravi Bhandari | No. of Pages: 60 | No. of Figures: 40 | No. of Tables: 7 |
Tanzania Aluminium Sulphate Market Size, Share & Growth Rate
The Tanzania Aluminium Sulphate Market was estimated at USD 473 Million in 2025 and is projected to reach USD 661 Million by 2032, growing at a CAGR of 4.9% from 2026 to 2032. This growth trajectory is largely fueled by escalating demand from the water treatment sector, where aluminium sulphate is essential for purifying drinking water and treating wastewater. Furthermore, the expanding paper and pulp industry in Tanzania is increasingly adopting this compound, which adds to the overall market momentum.
Tanzania Aluminium Sulphate Market Year-wise Growth Rate and Key Drivers
This graph highlights how the Tanzania Aluminium Sulphate Market has steadily grown over the years, supported by major growth factors.
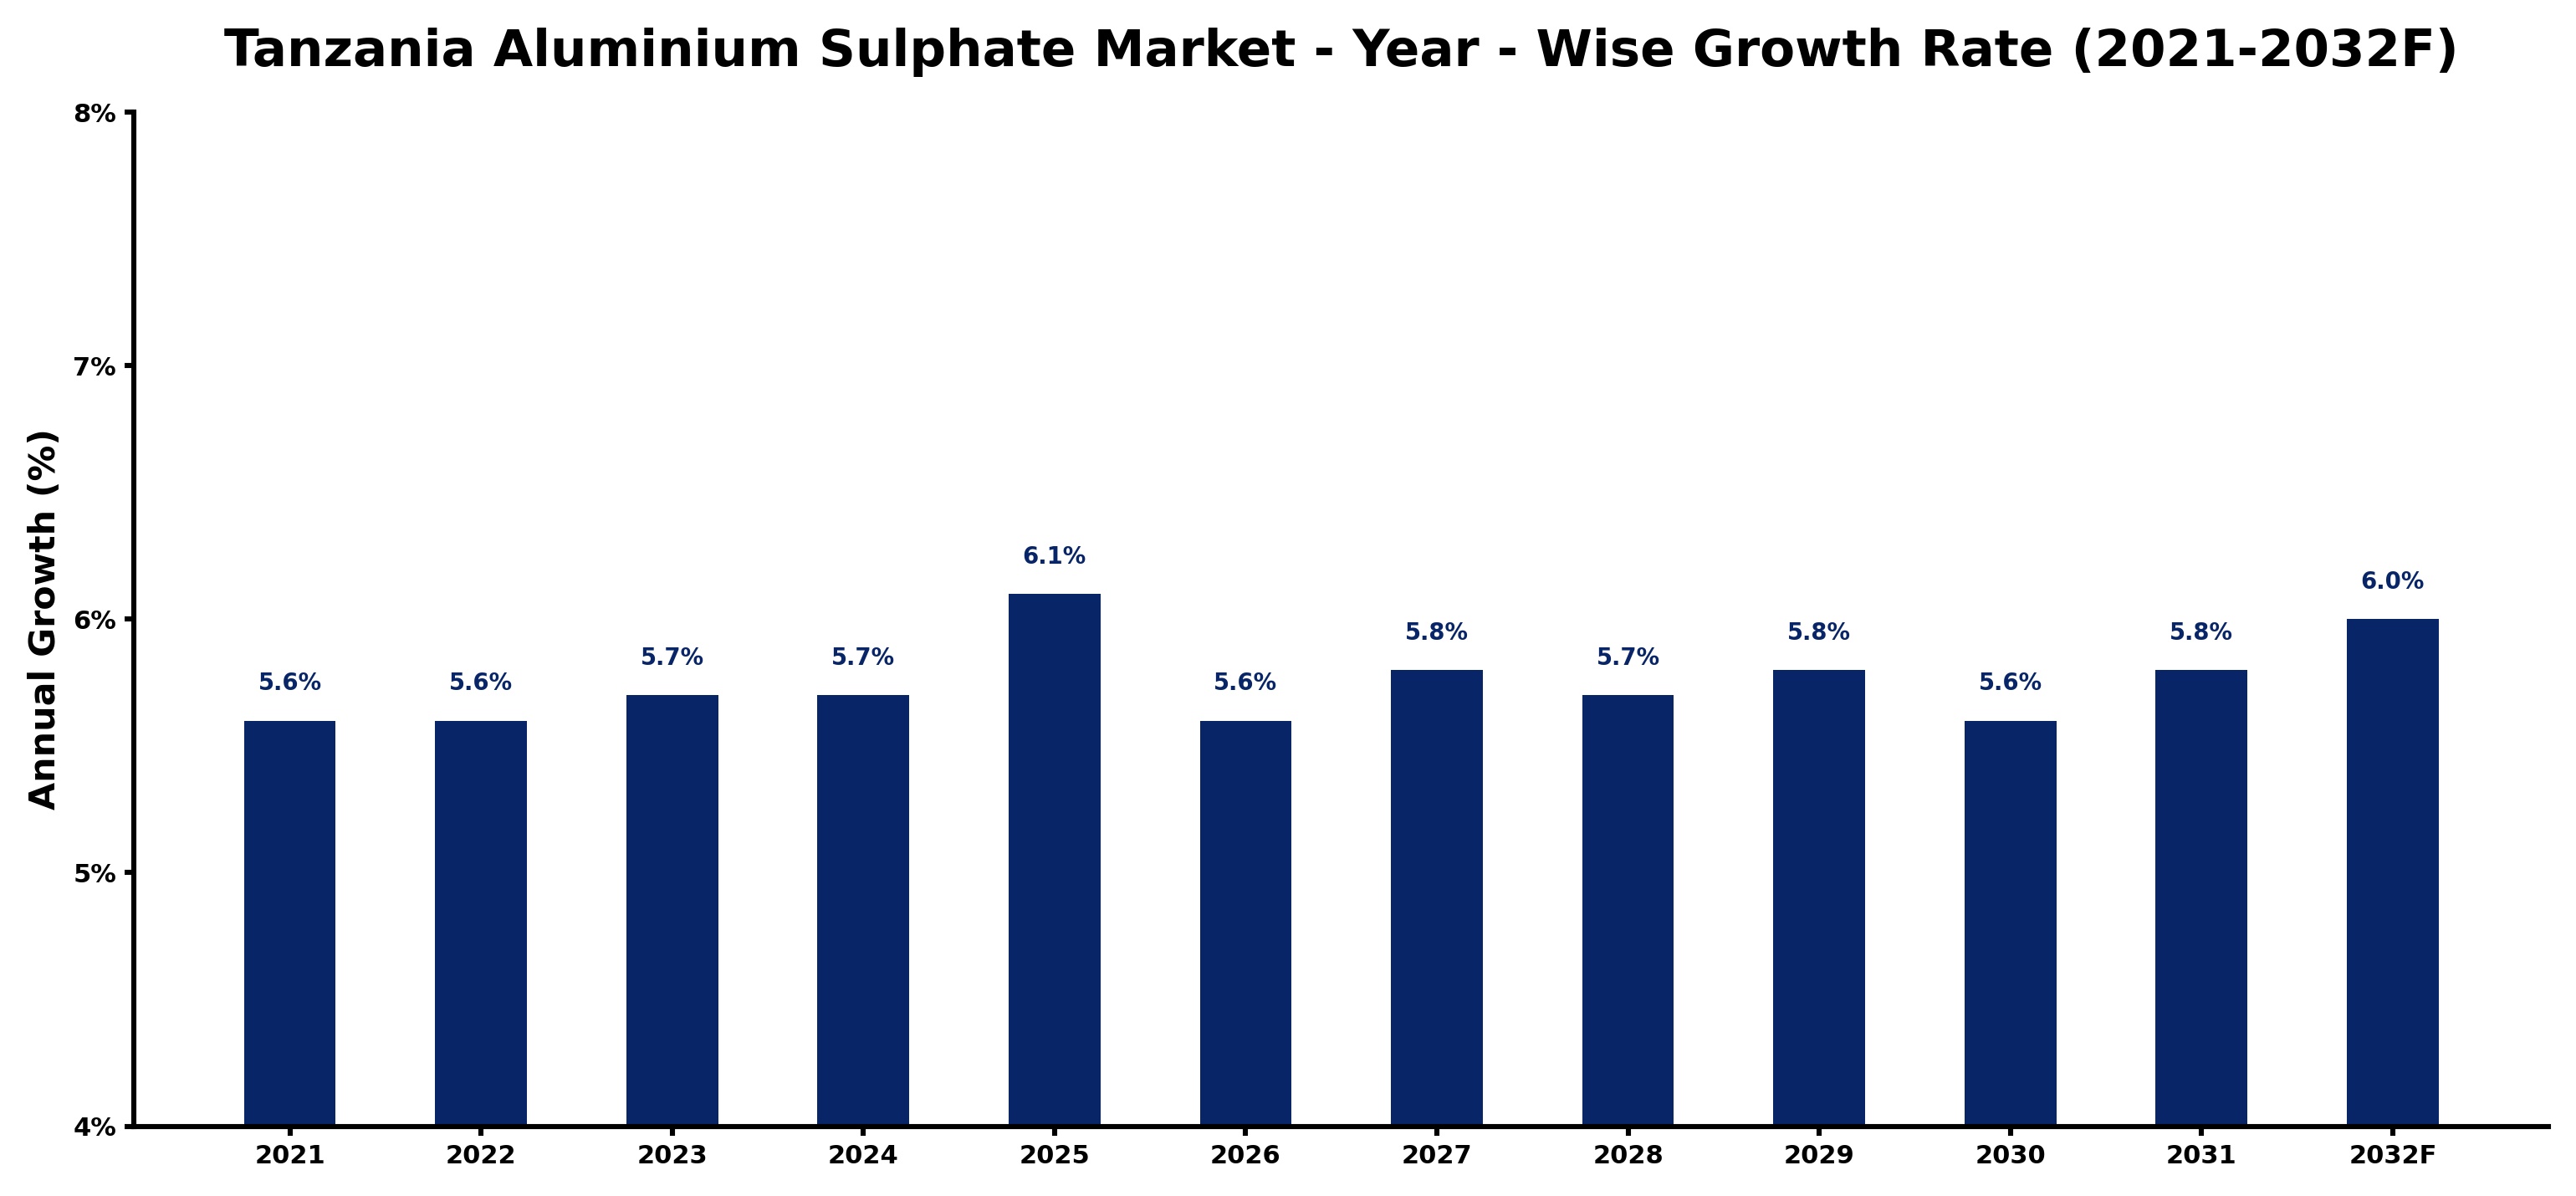
The table below presents the year‑wise growth rates along with the key drivers influencing the market
| Year | Growth Rate | Major Drivers |
| 2021 | 5.6% | Water treatment demand increased significantly |
| 2022 | 5.6% | Construction sector growth drove demand |
| 2023 | 5.7% | Agricultural applications expanded usage |
| 2024 | 5.7% | Environmental regulations enhanced adoption |
| 2025 | 6.1% | Industrial applications broadened market reach |
| 2026 | 5.6% | Food processing sector expanded usage |
| 2027 | 5.8% | Urbanization increased water treatment needs |
| 2028 | 5.7% | Chemical manufacturing growth stimulated demand |
| 2029 | 5.8% | Infrastructure projects boosted consumption |
| 2030 | 5.6% | Export opportunities enhanced market growth |
| 2031 | 5.8% | Research and development fostered innovation |
| 2032 | 6.0% | Sustainability initiatives promoted product usage |
Note - Market size estimations and growth projections presented in this report are based on 6Wresearch’s advanced forecasting approach, validated with industry datasets as of June 2026.
Tanzania Aluminium Sulphate Market Synopsis
In Tanzania, the aluminium sulphate market is gaining traction as various industries recognize its indispensable role in water treatment and industrial applications. The government's initiatives aimed at improving water quality and sanitation are pivotal in driving market demand, establishing a robust foundation for future growth.
A competitive landscape has emerged, characterized by local manufacturers and international suppliers striving to enhance product quality and distribution. As industries expand, the focus on sustainable practices and innovative solutions in aluminium sulphate production is becoming increasingly crucial.
Tanzania Aluminium Sulphate Market Key Takeaways
- The market is projected to grow from USD 473 Million in 2025 to USD 661 Million by 2032.
- Key growth drivers include demand from water treatment, paper and pulp, and construction sectors.
- Government policies promoting local production and strict regulations are shaping market dynamics.
- Challenges such as fluctuating raw material prices could affect market growth in the short term.
- Investment opportunities exist, particularly in manufacturing and distribution networks.
Evaluation of Restraints in Tanzania Aluminium Sulphate Market
Despite the promising outlook, the Tanzania Aluminium Sulphate market faces several restraints that could limit its growth potential. Fluctuating raw material prices pose a significant risk, as they can directly affect production costs. Additionally, inadequate infrastructure for manufacturing and distribution can hinder efficiency and accessibility. Regulatory constraints also play a role, as companies must navigate complex compliance requirements that can add to operational costs. Furthermore, a lack of skilled labor and limited technology adoption are barriers that need to be addressed to fully harness market potential.
Tanzania Aluminium Sulphate Market Trends
Emerging trends in the Tanzania Aluminium Sulphate market indicate a growing emphasis on product innovation, particularly in the water treatment sector. Companies are actively pursuing advancements in formulation and application techniques to enhance efficiency and effectiveness. Sustainability has also become a key focal point, with players exploring eco-friendly production methods. The demand for high-quality, cost-effective solutions continues to escalate, compelling manufacturers to reevaluate their strategies and develop robust distribution networks.
Tanzania Aluminium Sulphate Market Opportunities
Opportunities in the Tanzania Aluminium Sulphate market are plentiful, particularly due to the increasing need for water treatment solutions amid urbanization and population growth. The government's commitment to improving access to clean water underscores the necessity for reliable water treatment chemicals. Potential investors can capitalize on this by establishing local production facilities and collaborating with existing water treatment companies to enhance market penetration. Moreover, as the market remains relatively untapped, there is significant scope for growth in manufacturing and distribution.
Government Initiatives in the Tanzania Aluminium Sulphate Market
The Tanzanian government is actively involved in shaping the aluminium sulphate market through stringent regulations and quality standards. The Tanzania Bureau of Standards (TBS) oversees product specifications to ensure safety and environmental protection. Additionally, importers are required to comply with regulations set forth by the Tanzania Food and Drugs Authority (TFDA). The government also incentivizes local production, promoting the establishment of manufacturing units to meet domestic needs, thereby supporting industry growth and job creation.
Future Insights of the Tanzania Aluminium Sulphate Market
Looking ahead, the Tanzania Aluminium Sulphate market is expected to expand steadily through 2026-2032. The increasing demand driven by urbanization and industrialization will play a crucial role in this growth. Enhanced government initiatives focused on improving water quality and sanitation infrastructure will further stimulate market development. However, stakeholders must remain vigilant regarding raw material price volatility and environmental regulations that may affect production processes. Overall, a proactive approach involving innovation and sustainable practices will be key to navigating the challenges ahead.
Tanzania Aluminium Sulphate Market Latest Developments (May 2025 - June 2026)
Recent developments in the Tanzania Aluminium Sulphate market indicate a shift towards greater sustainability and product efficiency. Industry players are increasingly investing in research and development to innovate new formulations that cater to both domestic and international markets. Collaborative efforts between local and international companies are emerging as a strategy to enhance manufacturing capabilities and distribution networks. Moreover, regulatory changes aimed at environmental sustainability are prompting companies to adapt their production processes.
Tanzania Aluminium Sulphate Market - Key Attractiveness of the Report
- 10 Years of Market Numbers
- Historical Data Starting from 2022 to 2025
- Base Year: 2025
- Forecast Data until 2032
- Key Performance Indicators Impacting the Market
- Major Upcoming Developments and Projects
Key Highlights of the Report:
- Tanzania Aluminium Sulphate Market Outlook
- Market Size of Tanzania Aluminium Sulphate Market, 2025
- Forecast of Tanzania Aluminium Sulphate Market, 2032
- Historical Data and Forecast of Tanzania Aluminium Sulphate Revenues & Volume for the Period 2022-2032F
- Tanzania Aluminium Sulphate Market Trend Evolution
- Tanzania Aluminium Sulphate Market Drivers and Challenges
- Tanzania Aluminium Sulphate Price Trends
- Tanzania Aluminium Sulphate Porter's Five Forces
- Tanzania Aluminium Sulphate Industry Life Cycle
- Historical Data and Forecast of Tanzania Aluminium Sulphate Market Revenues & Volume By Applications for the Period 2022-2032F
- Historical Data and Forecast of Tanzania Aluminium Sulphate Market Revenues & Volume By Food and beverages industry for the Period 2022-2032F
- Historical Data and Forecast of Tanzania Aluminium Sulphate Market Revenues & Volume By Health care industry for the Period 2022-2032F
- Historical Data and Forecast of Tanzania Aluminium Sulphate Market Revenues & Volume By Water purification and water treatment plants for the Period 2022-2032F
- Historical Data and Forecast of Tanzania Aluminium Sulphate Market Revenues & Volume By Pepper industry for the Period 2022-2032F
- Historical Data and Forecast of Tanzania Aluminium Sulphate Market Revenues & Volume By Others for the Period 2022-2032F
- Historical Data and Forecast of Tanzania Aluminium Sulphate Market Revenues & Volume By Functionality for the Period 2022-2032F
- Historical Data and Forecast of Tanzania Aluminium Sulphate Market Revenues & Volume By As an additive for the Period 2022-2032F
- Historical Data and Forecast of Tanzania Aluminium Sulphate Market Revenues & Volume By As BOD and COD removal for the Period 2022-2032F
- Historical Data and Forecast of Tanzania Aluminium Sulphate Market Revenues & Volume By Colour removal for the Period 2022-2032F
- Historical Data and Forecast of Tanzania Aluminium Sulphate Market Revenues & Volume By Cell separation for the Period 2022-2032F
- Historical Data and Forecast of Tanzania Aluminium Sulphate Market Revenues & Volume By Product Form for the Period 2022-2032F
- Historical Data and Forecast of Tanzania Aluminium Sulphate Market Revenues & Volume By Liquid for the Period 2022-2032F
- Historical Data and Forecast of Tanzania Aluminium Sulphate Market Revenues & Volume By Solid for the Period 2022-2032F
- Tanzania Aluminium Sulphate Import Export Trade Statistics
- Market Opportunity Assessment By Applications
- Market Opportunity Assessment By Functionality
- Market Opportunity Assessment By Product Form
- Tanzania Aluminium Sulphate Top Companies Market Share
- Tanzania Aluminium Sulphate Competitive Benchmarking By Technical and Operational Parameters
- Tanzania Aluminium Sulphate Company Profiles
- Tanzania Aluminium Sulphate Key Strategic Recommendations
Tanzania Aluminium Sulphate Market - Frequently Asked Questions
The aluminium sulphate market in Tanzania is primarily driven by demand in water treatment, paper and pulp manufacturing, and construction. These sectors utilize aluminium sulphate for its effectiveness in purifying water and treating wastewater.
The market is estimated to grow from USD 473 Million in 2025 to USD 661 Million by 2032, reflecting a CAGR of 4.9% from 2026 to 2032, indicating a robust growth trajectory fueled by increased industrial activity.
Government policies in Tanzania aim to regulate production and maintain quality standards, while also providing incentives for local production. These efforts are designed to promote consumer safety and enhance domestic industry capabilities.
Local manufacturers are increasingly positioned to meet the growing demand, with a focus on enhancing production quality and expanding distribution channels to serve diverse industrial needs.
Fluctuating raw material prices and inadequate infrastructure are notable challenges that could impede market growth. Additionally, regulatory compliance presents an ongoing hurdle for companies looking to maintain competitiveness.
Yes, the market offers substantial investment opportunities, particularly in production and distribution. As the demand for water treatment chemicals increases, establishing local manufacturing facilities can prove lucrative for investors.
6Wresearch actively monitors the Tanzania Aluminium Sulphate Market and publishes its comprehensive annual report, highlighting emerging trends, growth drivers, revenue analysis, and forecast outlook. Our insights help businesses to make data-backed strategic decisions with ongoing market dynamics. Our analysts track relevent industries related to the Tanzania Aluminium Sulphate Market, allowing our clients with actionable intelligence and reliable forecasts tailored to emerging regional needs.
Yes, we provide customisation as per your requirements. To learn more, feel free to contact us on sales@6wresearch.com
1 Executive Summary |
2 Introduction |
2.1 Key Highlights of the Report |
2.2 Report Description |
2.3 Market Scope & Segmentation |
2.4 Research Methodology |
2.5 Assumptions |
3 Tanzania Aluminium Sulphate Market Overview |
3.1 Tanzania Country Macro Economic Indicators |
3.2 Tanzania Aluminium Sulphate Market Revenues & Volume, 2022 & 2032F |
3.3 Tanzania Aluminium Sulphate Market - Industry Life Cycle |
3.4 Tanzania Aluminium Sulphate Market - Porter's Five Forces |
3.5 Tanzania Aluminium Sulphate Market Revenues & Volume Share, By Applications, 2022 & 2032F |
3.6 Tanzania Aluminium Sulphate Market Revenues & Volume Share, By Functionality, 2022 & 2032F |
3.7 Tanzania Aluminium Sulphate Market Revenues & Volume Share, By Product Form, 2022 & 2032F |
4 Tanzania Aluminium Sulphate Market Dynamics |
4.1 Impact Analysis |
4.2 Market Drivers |
4.2.1 Increasing demand for water treatment chemicals in Tanzania |
4.2.2 Growing industrial activities leading to higher use of aluminium sulphate |
4.2.3 Government initiatives promoting water treatment and sanitation in the country |
4.3 Market Restraints |
4.3.1 Fluctuating prices of raw materials impacting production costs |
4.3.2 Environmental regulations and concerns regarding the use of aluminium sulphate |
4.3.3 Competition from alternative water treatment chemicals |
5 Tanzania Aluminium Sulphate Market Trends |
6 Tanzania Aluminium Sulphate Market, By Types |
6.1 Tanzania Aluminium Sulphate Market, By Applications |
6.1.1 Overview and Analysis |
6.1.2 Tanzania Aluminium Sulphate Market Revenues & Volume, By Applications, 2022-2032F |
6.1.3 Tanzania Aluminium Sulphate Market Revenues & Volume, By Food and beverages industry, 2022-2032F |
6.1.4 Tanzania Aluminium Sulphate Market Revenues & Volume, By Health care industry, 2022-2032F |
6.1.5 Tanzania Aluminium Sulphate Market Revenues & Volume, By Water purification and water treatment plants, 2022-2032F |
6.1.6 Tanzania Aluminium Sulphate Market Revenues & Volume, By Pepper industry, 2022-2032F |
6.1.7 Tanzania Aluminium Sulphate Market Revenues & Volume, By Others, 2022-2032F |
6.2 Tanzania Aluminium Sulphate Market, By Functionality |
6.2.1 Overview and Analysis |
6.2.2 Tanzania Aluminium Sulphate Market Revenues & Volume, By As an additive, 2022-2032F |
6.2.3 Tanzania Aluminium Sulphate Market Revenues & Volume, By As BOD and COD removal, 2022-2032F |
6.2.4 Tanzania Aluminium Sulphate Market Revenues & Volume, By Colour removal, 2022-2032F |
6.2.5 Tanzania Aluminium Sulphate Market Revenues & Volume, By Cell separation, 2022-2032F |
6.3 Tanzania Aluminium Sulphate Market, By Product Form |
6.3.1 Overview and Analysis |
6.3.2 Tanzania Aluminium Sulphate Market Revenues & Volume, By Liquid, 2022-2032F |
6.3.3 Tanzania Aluminium Sulphate Market Revenues & Volume, By Solid, 2022-2032F |
7 Tanzania Aluminium Sulphate Market Import-Export Trade Statistics |
7.1 Tanzania Aluminium Sulphate Market Export to Major Countries |
7.2 Tanzania Aluminium Sulphate Market Imports from Major Countries |
8 Tanzania Aluminium Sulphate Market Key Performance Indicators |
8.1 Percentage increase in water treatment projects in Tanzania |
8.2 Adoption rate of aluminium sulphate in different industries |
8.3 Number of government projects focusing on water treatment and sanitation |
9 Tanzania Aluminium Sulphate Market - Opportunity Assessment |
9.1 Tanzania Aluminium Sulphate Market Opportunity Assessment, By Applications, 2022 & 2032F |
9.2 Tanzania Aluminium Sulphate Market Opportunity Assessment, By Functionality, 2022 & 2032F |
9.3 Tanzania Aluminium Sulphate Market Opportunity Assessment, By Product Form, 2022 & 2032F |
10 Tanzania Aluminium Sulphate Market - Competitive Landscape |
10.1 Tanzania Aluminium Sulphate Market Revenue Share, By Companies, 2025 |
10.2 Tanzania Aluminium Sulphate Market Competitive Benchmarking, By Operating and Technical Parameters |
11 Company Profiles |
12 Recommendations |
13 Disclaimer |
Global Go To Market Strategy - 2030
Export potential enables firms to identify high-growth global markets with greater confidence by combining advanced trade intelligence with a structured quantitative methodology. The framework analyzes emerging demand trends and country-level import patterns while integrating macroeconomic and trade datasets such as GDP and population forecasts, bilateral import–export flows, tariff structures, elasticity differentials between developed and developing economies, geographic distance, and import demand projections. Using weighted trade values from 2020–2024 as the base period to project country-to-country export potential for 2030, these inputs are operationalized through calculated drivers such as gravity model parameters, tariff impact factors, and projected GDP per-capita growth. Through an analysis of hidden potentials, demand hotspots, and market conditions that are most favorable to success, this method enables firms to focus on target countries, maximize returns, and global expansion with data, backed by accuracy.
By factoring in the projected importer demand gap that is currently unmet and could be potential opportunity, it identifies the potential for the Exporter (Country) among 190 countries, against the general trade analysis, which identifies the biggest importer or exporter.
To discover high-growth global markets and optimize your business strategy:
Click Here
Pricing
- Single User License$ 1,995
- Department License$ 2,400
- Site License$ 3,120
- Global License$ 3,795

Leadership Perspectives from Industry Events
Search
Thought Leadership and Analyst Meet


Our Clients
6WResearch In News
- India Air Conditioner Market Set for Strong Rebound in 2026 After Weather-Led Correction and GST-Driven Recovery: 6Wresearch
- ADAS in India: How Automatic Emergency Braking, Blind Spot Detection & Driver Monitoring are Transforming Road Safety
- Doha a strategic location for EV manufacturing hub: IPA Qatar
- Demand for luxury TVs surging in the GCC, says Samsung
- Empowering Growth: The Thriving Journey of Bangladesh’s Cable Industry
- Demand for luxury TVs surging in the GCC, says Samsung
Latest Reports
- Nicaragua RPG Gaming Market (2026-2032)
- New Zealand RPG Gaming Market (2026-2032)
- Netherlands RPG Gaming Market (2026-2032)
- Nauru RPG Gaming Market (2026-2032)
- Namibia RPG Gaming Market (2026-2032)
- Mozambique RPG Gaming Market (2026-2032)
- Montenegro RPG Gaming Market (2026-2032)
- Mongolia RPG Gaming Market (2026-2032)
- Monaco RPG Gaming Market (2026-2032)
- Micronesia RPG Gaming Market (2026-2032)
Industry Events and Analyst Meet

EV India Expo 2026

HIMTEX 2026

India Refining Summit 2026

India EV Show 2026

EV tech India Expo 2026
Whitepaper
- Middle East & Africa Commercial Security Market Click here to view more.
- Middle East & Africa Fire Safety Systems & Equipment Market Click here to view more.
- GCC Drone Market Click here to view more.
- Middle East Lighting Fixture Market Click here to view more.
- GCC Physical & Perimeter Security Market Click here to view more.