Tanzania Armored Vehicle Market (2026-2032) Outlook | Companies, Revenue, Share, Industry, Value, Forecast, Analysis, Trends, Growth & Size
Market Forecast By Platform (Combat Vehicles, Combat Support Vehicles, Unmanned Armored Ground Vehicles), By Mobility (Wheeled, Tracked), By System (Engine, Drive System, Ballistic Armor, Turret Drives, Ammunition Handling System, Fire Control Systems (FCS), Armaments, Countermeasure System) And Competitive Landscape
| Product Code: ETC228715 | Publication Date: Aug 2022 | Updated Date: Jul 2026 | Product Type: Market Research Report | |
| Publisher: 6Wresearch | Author: Shubham Deep | No. of Pages: 75 | No. of Figures: 35 | No. of Tables: 20 |
Tanzania Armored Vehicle Market Size, Share & Growth Rate
The Tanzania Armored Vehicle Market was estimated at USD 207 Million in 2025 and is projected to reach USD 289 Million by 2032, growing at a CAGR of 4.9% from 2026 to 2032. This growth trajectory is largely propelled by escalating security threats in the region, compelling government and private entities to invest in enhanced protection solutions. As crime rates and political instability persist, the demand for armored vehicles—ranging from personnel carriers to customized security solutions—will likely continue to rise.
Tanzania Armored Vehicle Market Year-wise Growth Rate and Key Drivers
This graph highlights how the Tanzania Armored Vehicle Market has steadily grown over the years, supported by major growth factors.
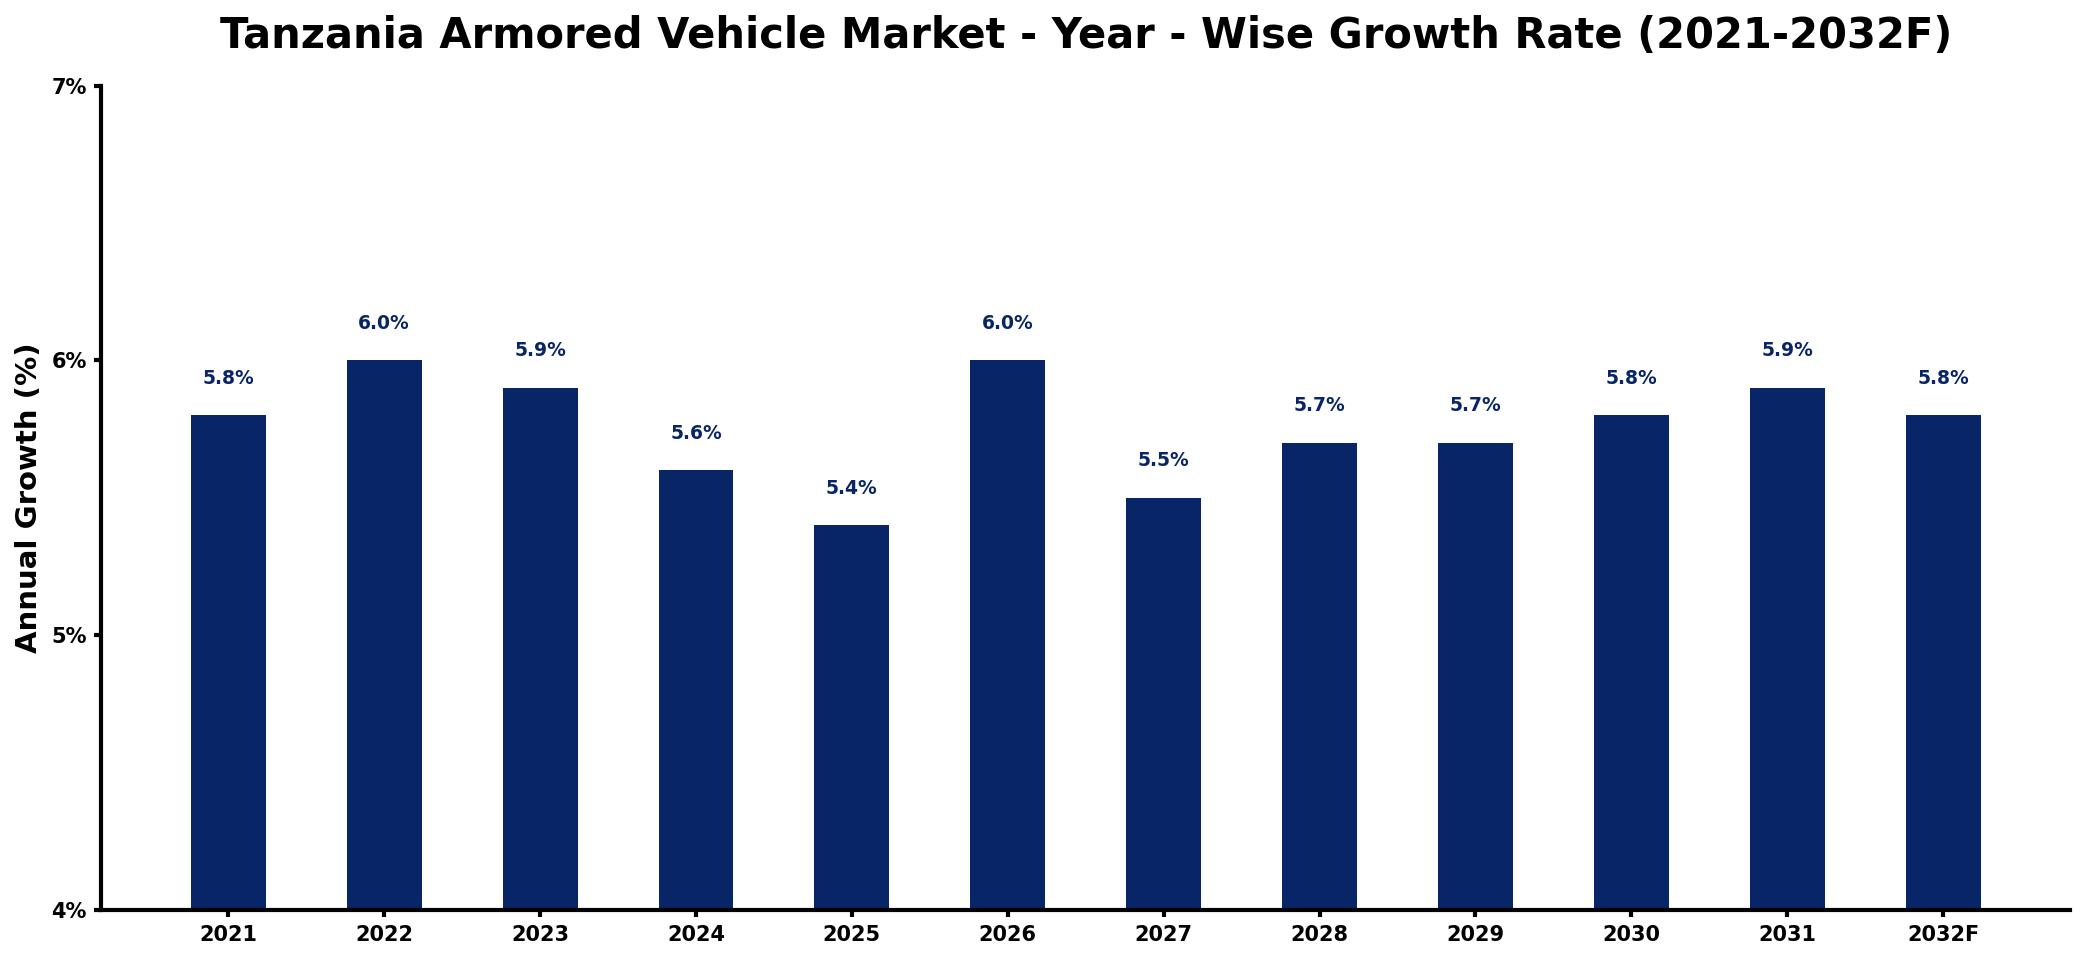
The table below presents the year‑wise growth rates along with the key drivers influencing the market
| Year | Growth Rate | Major Drivers |
| 2021 | 5.8% | Increased government defense spending |
| 2022 | 6.0% | Rising regional security concerns |
| 2023 | 5.9% | Growing demand for protection |
| 2024 | 5.6% | Expansion of military modernization programs |
| 2025 | 5.4% | Investment in infrastructure development |
| 2026 | 6.0% | Surge in private security firms |
| 2027 | 5.5% | Enhanced international defense collaborations |
| 2028 | 5.7% | Growing interest in peacekeeping operations |
| 2029 | 5.7% | Increased focus on border security |
| 2030 | 5.8% | Rising urban crime rates |
| 2031 | 5.9% | Growing need for emergency response |
| 2032 | 5.8% | growing automotive sector requirements |
Note: Market size estimations and growth projections presented in this report are based on 6Wresearch's proprietary forecasting methodology, utilizing the latest available industry data, government publications, and primary research inputs.
Tanzania Armored Vehicle Market Synopsis
A notable surge in demand for armored vehicles in Tanzania can be attributed to the country's heightened focus on security measures amid various socio-political challenges. Government agencies, private security firms, and affluent individuals are increasingly seeking advanced protection against potential threats, reinforcing the market's growth.
Furthermore, the introduction of innovative armored vehicle designs, characterized by lighter weights and enhanced mobility, aligns with the growing trend of modernization within the defense sector. The increasing interest in tailored vehicles addressing unique security requirements underscores the market's potential for diversification.
Tanzania Armored Vehicle Market Key Takeaways
- The Tanzanian government is expected to invest in modern defense capabilities, contributing to market growth.
- There is a rising demand for customized armored vehicles, reflecting specific security needs.
- Economic constraints pose challenges for potential buyers, impacting procurement decisions.
- Technological advancements are driving the development of lighter and more maneuverable armored vehicles.
- Public interest in electric and hybrid armored vehicles indicates a shift towards sustainable options in the market.
Evaluation of Restraints in Tanzania Armored Vehicle Market
Despite the positive outlook, the Tanzania Armored Vehicle Market faces several constraints. Limited government spending on defense, primarily due to competing budget priorities, can hinder growth. Additionally, bureaucratic delays in procurement processes and reliance on imported vehicles may affect market dynamics. Economic limitations further complicate the situation, as high costs associated with armored vehicles deter potential buyers from making significant investments. Together, these factors create a complex landscape that impacts market development.
Tanzania Armored Vehicle Market Trends
The market is currently witnessing a shift towards advanced technology solutions, with a focus on lighter armored vehicles that offer superior protection and mobility. Customization is becoming increasingly popular, as clients seek vehicles that meet specific operational needs, including features such as blast resistance and advanced surveillance systems. Additionally, the growing environmental consciousness is driving interest in electric and hybrid armored vehicles, marking a significant trend in the sector.
Tanzania Armored Vehicle Market Opportunities
Opportunities abound in the Tanzania Armored Vehicle Market, particularly for investors looking to tap into the rising demand for enhanced security solutions. Collaborations with international manufacturers could lead to the introduction of high-quality, customized vehicles tailored to local needs. There is also potential for establishing maintenance and upgrade services for existing vehicle fleets, providing ongoing support to end-users and fostering long-term client relationships.
Government Initiatives in the Tanzania Armored Vehicle Market
Government policies governing the Tanzania Armored Vehicle Market primarily focus on regulating the importation, sale, and operational use of armored vehicles. Initiatives by the Tanzania Revenue Authority ensure compliance with international trade regulations while generating revenue through taxes and duties. Additionally, strict permit requirements for ownership and operation aim to maintain security standards and prevent misuse, creating a structured environment for the market.
Future Insights of the Tanzania Armored Vehicle Market
Looking ahead to 2026-2032, the Tanzania Armored Vehicle Market is poised for continuous expansion, driven by the pressing need for advanced defense solutions. Investments by the government to modernize its military capabilities are expected to further fuel market growth. Additionally, private sectors and high-net-worth individuals will likely continue to seek improved security measures amidst ongoing threats. With technological advancements paving the way for innovative vehicle designs, the market is set to adapt and thrive in the face of evolving security demands.
Tanzania Armored Vehicle Market Latest Developments (2025 - 2026)
Recent developments within the Tanzania Armored Vehicle Market have highlighted an increased focus on integrating advanced technologies into vehicle designs. Companies are exploring partnerships to leverage innovations that enhance protection and mobility. Additionally, there has been a noticeable uptick in demand for electric and hybrid armored vehicles, reflecting a growing emphasis on sustainability. Public and private investments in security infrastructure are also gaining momentum, underscoring the market's positive direction.
Tanzania Armored Vehicle Market - Key Attractiveness of the Report
- 10 Years of Market Numbers
- Historical Data Starting from 2022 to 2025
- Base Year: 2025
- Forecast Data until 2032
- Key Performance Indicators Impacting the Market
- Major Upcoming Developments and Projects
Key Highlights of the Report:
- Tanzania Armored Vehicle Market Outlook
- Market Size of Tanzania Armored Vehicle Market, 2025
- Forecast of Tanzania Armored Vehicle Market, 2032
- Historical Data and Forecast of Tanzania Armored Vehicle Revenues & Volume for the Period 2022-2032F
- Tanzania Armored Vehicle Market Trend Evolution
- Tanzania Armored Vehicle Market Drivers and Challenges
- Tanzania Armored Vehicle Price Trends
- Tanzania Armored Vehicle Porter's Five Forces
- Tanzania Armored Vehicle Industry Life Cycle
- Historical Data and Forecast of Tanzania Armored Vehicle Market Revenues & Volume By Platform for the Period 2022-2032F
- Historical Data and Forecast of Tanzania Armored Vehicle Market Revenues & Volume By Combat Vehicles for the Period 2022-2032F
- Historical Data and Forecast of Tanzania Armored Vehicle Market Revenues & Volume By Combat Support Vehicles for the Period 2022-2032F
- Historical Data and Forecast of Tanzania Armored Vehicle Market Revenues & Volume By Unmanned Armored Ground Vehicles for the Period 2022-2032F
- Historical Data and Forecast of Tanzania Armored Vehicle Market Revenues & Volume By Mobility for the Period 2022-2032F
- Historical Data and Forecast of Tanzania Armored Vehicle Market Revenues & Volume By Wheeled for the Period 2022-2032F
- Historical Data and Forecast of Tanzania Armored Vehicle Market Revenues & Volume By Tracked for the Period 2022-2032F
- Historical Data and Forecast of Tanzania Armored Vehicle Market Revenues & Volume By System for the Period 2022-2032F
- Historical Data and Forecast of Tanzania Armored Vehicle Market Revenues & Volume By Engine for the Period 2022-2032F
- Historical Data and Forecast of Tanzania Armored Vehicle Market Revenues & Volume By Drive System for the Period 2022-2032F
- Historical Data and Forecast of Tanzania Armored Vehicle Market Revenues & Volume By Ballistic Armor for the Period 2022-2032F
- Historical Data and Forecast of Tanzania Armored Vehicle Market Revenues & Volume By Turret Drives for the Period 2022-2032F
- Historical Data and Forecast of Tanzania Armored Vehicle Market Revenues & Volume By Ammunition Handling System for the Period 2022-2032F
- Historical Data and Forecast of Tanzania Armored Vehicle Market Revenues & Volume By Fire Control Systems (FCS) for the Period 2022-2032F
- Historical Data and Forecast of Tanzania Armored Vehicle Market Revenues & Volume By Armaments for the Period 2022-2032F
- Historical Data and Forecast of Tanzania Armored Vehicle Market Revenues & Volume By Countermeasure System for the Period 2022-2032F
- Tanzania Armored Vehicle Import Export Trade Statistics
- Market Opportunity Assessment By Platform
- Market Opportunity Assessment By Mobility
- Market Opportunity Assessment By System
- Tanzania Armored Vehicle Top Companies Market Share
- Tanzania Armored Vehicle Competitive Benchmarking By Technical and Operational Parameters
- Tanzania Armored Vehicle Company Profiles
- Tanzania Armored Vehicle Key Strategic Recommendations
Frequently Asked Questions About the Market Study (FAQs):
The growth in the Tanzania Armored Vehicle Market is largely driven by increasing security threats such as crime and terrorism. Government investments in defense and private sector demand for protection solutions are also pivotal.
The Tanzania Armored Vehicle Market was estimated at USD 207 Million in 2025 and is projected to reach USD 289 Million by 2032, growing at a CAGR of 4.9% from 2026 to 2032.
Current trends include a shift towards lighter armored vehicles, customization options to meet specific security needs, and a rising interest in electric and hybrid models to reduce environmental impact.
Yes, individuals and businesses must adhere to strict regulations regarding permits and licenses for owning and operating armored vehicles, which are enforced to maintain security and prevent misuse.
Investors can find opportunities through partnerships with international manufacturers for customized solutions, as well as establishing maintenance and upgrade services for existing fleets.
6Wresearch actively monitors the Tanzania Armored Vehicle Market and publishes its comprehensive annual report, highlighting emerging trends, growth drivers, revenue analysis, and forecast outlook. Our insights help businesses to make data-backed strategic decisions with ongoing market dynamics. Our analysts track relevent industries related to the Tanzania Armored Vehicle Market, allowing our clients with actionable intelligence and reliable forecasts tailored to emerging regional needs.
Yes, we provide customisation as per your requirements. To learn more, feel free to contact us on sales@6wresearch.com
1 Executive Summary |
2 Introduction |
2.1 Key Highlights of the Report |
2.2 Report Description |
2.3 Market Scope & Segmentation |
2.4 Research Methodology |
2.5 Assumptions |
3 Tanzania Armored Vehicle Market Overview |
3.1 Tanzania Country Macro Economic Indicators |
3.2 Tanzania Armored Vehicle Market Revenues & Volume, 2022 & 2032F |
3.3 Tanzania Armored Vehicle Market - Industry Life Cycle |
3.4 Tanzania Armored Vehicle Market - Porter's Five Forces |
3.5 Tanzania Armored Vehicle Market Revenues & Volume Share, By Platform, 2022 & 2032F |
3.6 Tanzania Armored Vehicle Market Revenues & Volume Share, By Mobility, 2022 & 2032F |
3.7 Tanzania Armored Vehicle Market Revenues & Volume Share, By System, 2022 & 2032F |
4 Tanzania Armored Vehicle Market Dynamics |
4.1 Impact Analysis |
4.2 Market Drivers |
4.2.1 Increasing security concerns and threats in Tanzania |
4.2.2 Rising defense budget and focus on modernizing military equipment |
4.2.3 Growing demand for armored vehicles in law enforcement agencies |
4.3 Market Restraints |
4.3.1 High initial investment and maintenance costs of armored vehicles |
4.3.2 Limited technological capabilities in the local defense industry |
4.3.3 Political instability and regulatory challenges affecting procurement processes |
5 Tanzania Armored Vehicle Market Trends |
6 Tanzania Armored Vehicle Market, By Types |
6.1 Tanzania Armored Vehicle Market, By Platform |
6.1.1 Overview and Analysis |
6.1.2 Tanzania Armored Vehicle Market Revenues & Volume, By Platform, 2022-2032F |
6.1.3 Tanzania Armored Vehicle Market Revenues & Volume, By Combat Vehicles, 2022-2032F |
6.1.4 Tanzania Armored Vehicle Market Revenues & Volume, By Combat Support Vehicles, 2022-2032F |
6.1.5 Tanzania Armored Vehicle Market Revenues & Volume, By Unmanned Armored Ground Vehicles, 2022-2032F |
6.2 Tanzania Armored Vehicle Market, By Mobility |
6.2.1 Overview and Analysis |
6.2.2 Tanzania Armored Vehicle Market Revenues & Volume, By Wheeled, 2022-2032F |
6.2.3 Tanzania Armored Vehicle Market Revenues & Volume, By Tracked, 2022-2032F |
6.3 Tanzania Armored Vehicle Market, By System |
6.3.1 Overview and Analysis |
6.3.2 Tanzania Armored Vehicle Market Revenues & Volume, By Engine, 2022-2032F |
6.3.3 Tanzania Armored Vehicle Market Revenues & Volume, By Drive System, 2022-2032F |
6.3.4 Tanzania Armored Vehicle Market Revenues & Volume, By Ballistic Armor, 2022-2032F |
6.3.5 Tanzania Armored Vehicle Market Revenues & Volume, By Turret Drives, 2022-2032F |
6.3.6 Tanzania Armored Vehicle Market Revenues & Volume, By Ammunition Handling System, 2022-2032F |
6.3.7 Tanzania Armored Vehicle Market Revenues & Volume, By Fire Control Systems (FCS), 2022-2032F |
6.3.8 Tanzania Armored Vehicle Market Revenues & Volume, By Countermeasure System, 2022-2032F |
6.3.9 Tanzania Armored Vehicle Market Revenues & Volume, By Countermeasure System, 2022-2032F |
7 Tanzania Armored Vehicle Market Import-Export Trade Statistics |
7.1 Tanzania Armored Vehicle Market Export to Major Countries |
7.2 Tanzania Armored Vehicle Market Imports from Major Countries |
8 Tanzania Armored Vehicle Market Key Performance Indicators |
8.1 Number of government contracts awarded for armored vehicle procurement |
8.2 Percentage of defense budget allocated to armored vehicle acquisitions |
8.3 Rate of adoption of advanced armored vehicle technologies |
8.4 Number of security incidents driving demand for armored vehicles |
8.5 Level of collaboration between international and local defense industry players in the armored vehicle market |
9 Tanzania Armored Vehicle Market - Opportunity Assessment |
9.1 Tanzania Armored Vehicle Market Opportunity Assessment, By Platform, 2022 & 2032F |
9.2 Tanzania Armored Vehicle Market Opportunity Assessment, By Mobility, 2022 & 2032F |
9.3 Tanzania Armored Vehicle Market Opportunity Assessment, By System, 2022 & 2032F |
10 Tanzania Armored Vehicle Market - Competitive Landscape |
10.1 Tanzania Armored Vehicle Market Revenue Share, By Companies, 2025 |
10.2 Tanzania Armored Vehicle Market Competitive Benchmarking, By Operating and Technical Parameters |
11 Company Profiles |
12 Recommendations |
13 Disclaimer |
Global Go To Market Strategy - 2030
Export potential enables firms to identify high-growth global markets with greater confidence by combining advanced trade intelligence with a structured quantitative methodology. The framework analyzes emerging demand trends and country-level import patterns while integrating macroeconomic and trade datasets such as GDP and population forecasts, bilateral import–export flows, tariff structures, elasticity differentials between developed and developing economies, geographic distance, and import demand projections. Using weighted trade values from 2020–2024 as the base period to project country-to-country export potential for 2030, these inputs are operationalized through calculated drivers such as gravity model parameters, tariff impact factors, and projected GDP per-capita growth. Through an analysis of hidden potentials, demand hotspots, and market conditions that are most favorable to success, this method enables firms to focus on target countries, maximize returns, and global expansion with data, backed by accuracy.
By factoring in the projected importer demand gap that is currently unmet and could be potential opportunity, it identifies the potential for the Exporter (Country) among 190 countries, against the general trade analysis, which identifies the biggest importer or exporter.
To discover high-growth global markets and optimize your business strategy:
Click Here
Pricing
- Single User License$ 1,995
- Department License$ 2,400
- Site License$ 3,120
- Global License$ 3,795

Leadership Perspectives from Industry Events
Search
Thought Leadership and Analyst Meet


Our Clients
6WResearch In News
- India Air Conditioner Market Set for Strong Rebound in 2026 After Weather-Led Correction and GST-Driven Recovery: 6Wresearch
- ADAS in India: How Automatic Emergency Braking, Blind Spot Detection & Driver Monitoring are Transforming Road Safety
- Doha a strategic location for EV manufacturing hub: IPA Qatar
- Demand for luxury TVs surging in the GCC, says Samsung
- Empowering Growth: The Thriving Journey of Bangladesh’s Cable Industry
- Demand for luxury TVs surging in the GCC, says Samsung
Latest Reports
- Nicaragua RPG Gaming Market (2026-2032)
- New Zealand RPG Gaming Market (2026-2032)
- Netherlands RPG Gaming Market (2026-2032)
- Nauru RPG Gaming Market (2026-2032)
- Namibia RPG Gaming Market (2026-2032)
- Mozambique RPG Gaming Market (2026-2032)
- Montenegro RPG Gaming Market (2026-2032)
- Mongolia RPG Gaming Market (2026-2032)
- Monaco RPG Gaming Market (2026-2032)
- Micronesia RPG Gaming Market (2026-2032)
Industry Events and Analyst Meet

EV India Expo 2026

HIMTEX 2026

India Refining Summit 2026

India EV Show 2026

EV tech India Expo 2026
Whitepaper
- Middle East & Africa Commercial Security Market Click here to view more.
- Middle East & Africa Fire Safety Systems & Equipment Market Click here to view more.
- GCC Drone Market Click here to view more.
- Middle East Lighting Fixture Market Click here to view more.
- GCC Physical & Perimeter Security Market Click here to view more.