Tanzania Cast & Forged Market (2026-2032) | Forecast, Trends, Share, Revenue, Industry, COVID-19 IMPACT, Size, Outlook, Growth, Analysis, Companies & Value
Market Forecast By Product Types (Light Alloys, Copper Alloys, Iron Casting, Steel Casting, Miscellaneous), By Activity Types (Closed Die Forging, Open Die Forging, Rolled Ring Forging, Cold Forging, Non-ferrous Closed Die Forging), By Applications (Automotive, Aerospace, Oil & Gas, Construction, Agriculture, Industrial, Others) And Competitive Landscape
| Product Code: ETC004219 | Publication Date: Sep 2020 | Product Type: Report | ||
| Publisher: 6Wresearch | Author: Ravi Bhandari | No. of Pages: 70 | No. of Figures: 35 | No. of Tables: 5 |
Tanzania Cast & Forged Market Summary
The tanzania cast & forged market was estimated at USD 1245 Million in 2025 and is projected to reach USD 1771 Million by 2032, growing at a CAGR of 5.8% from 2026 to 2032.
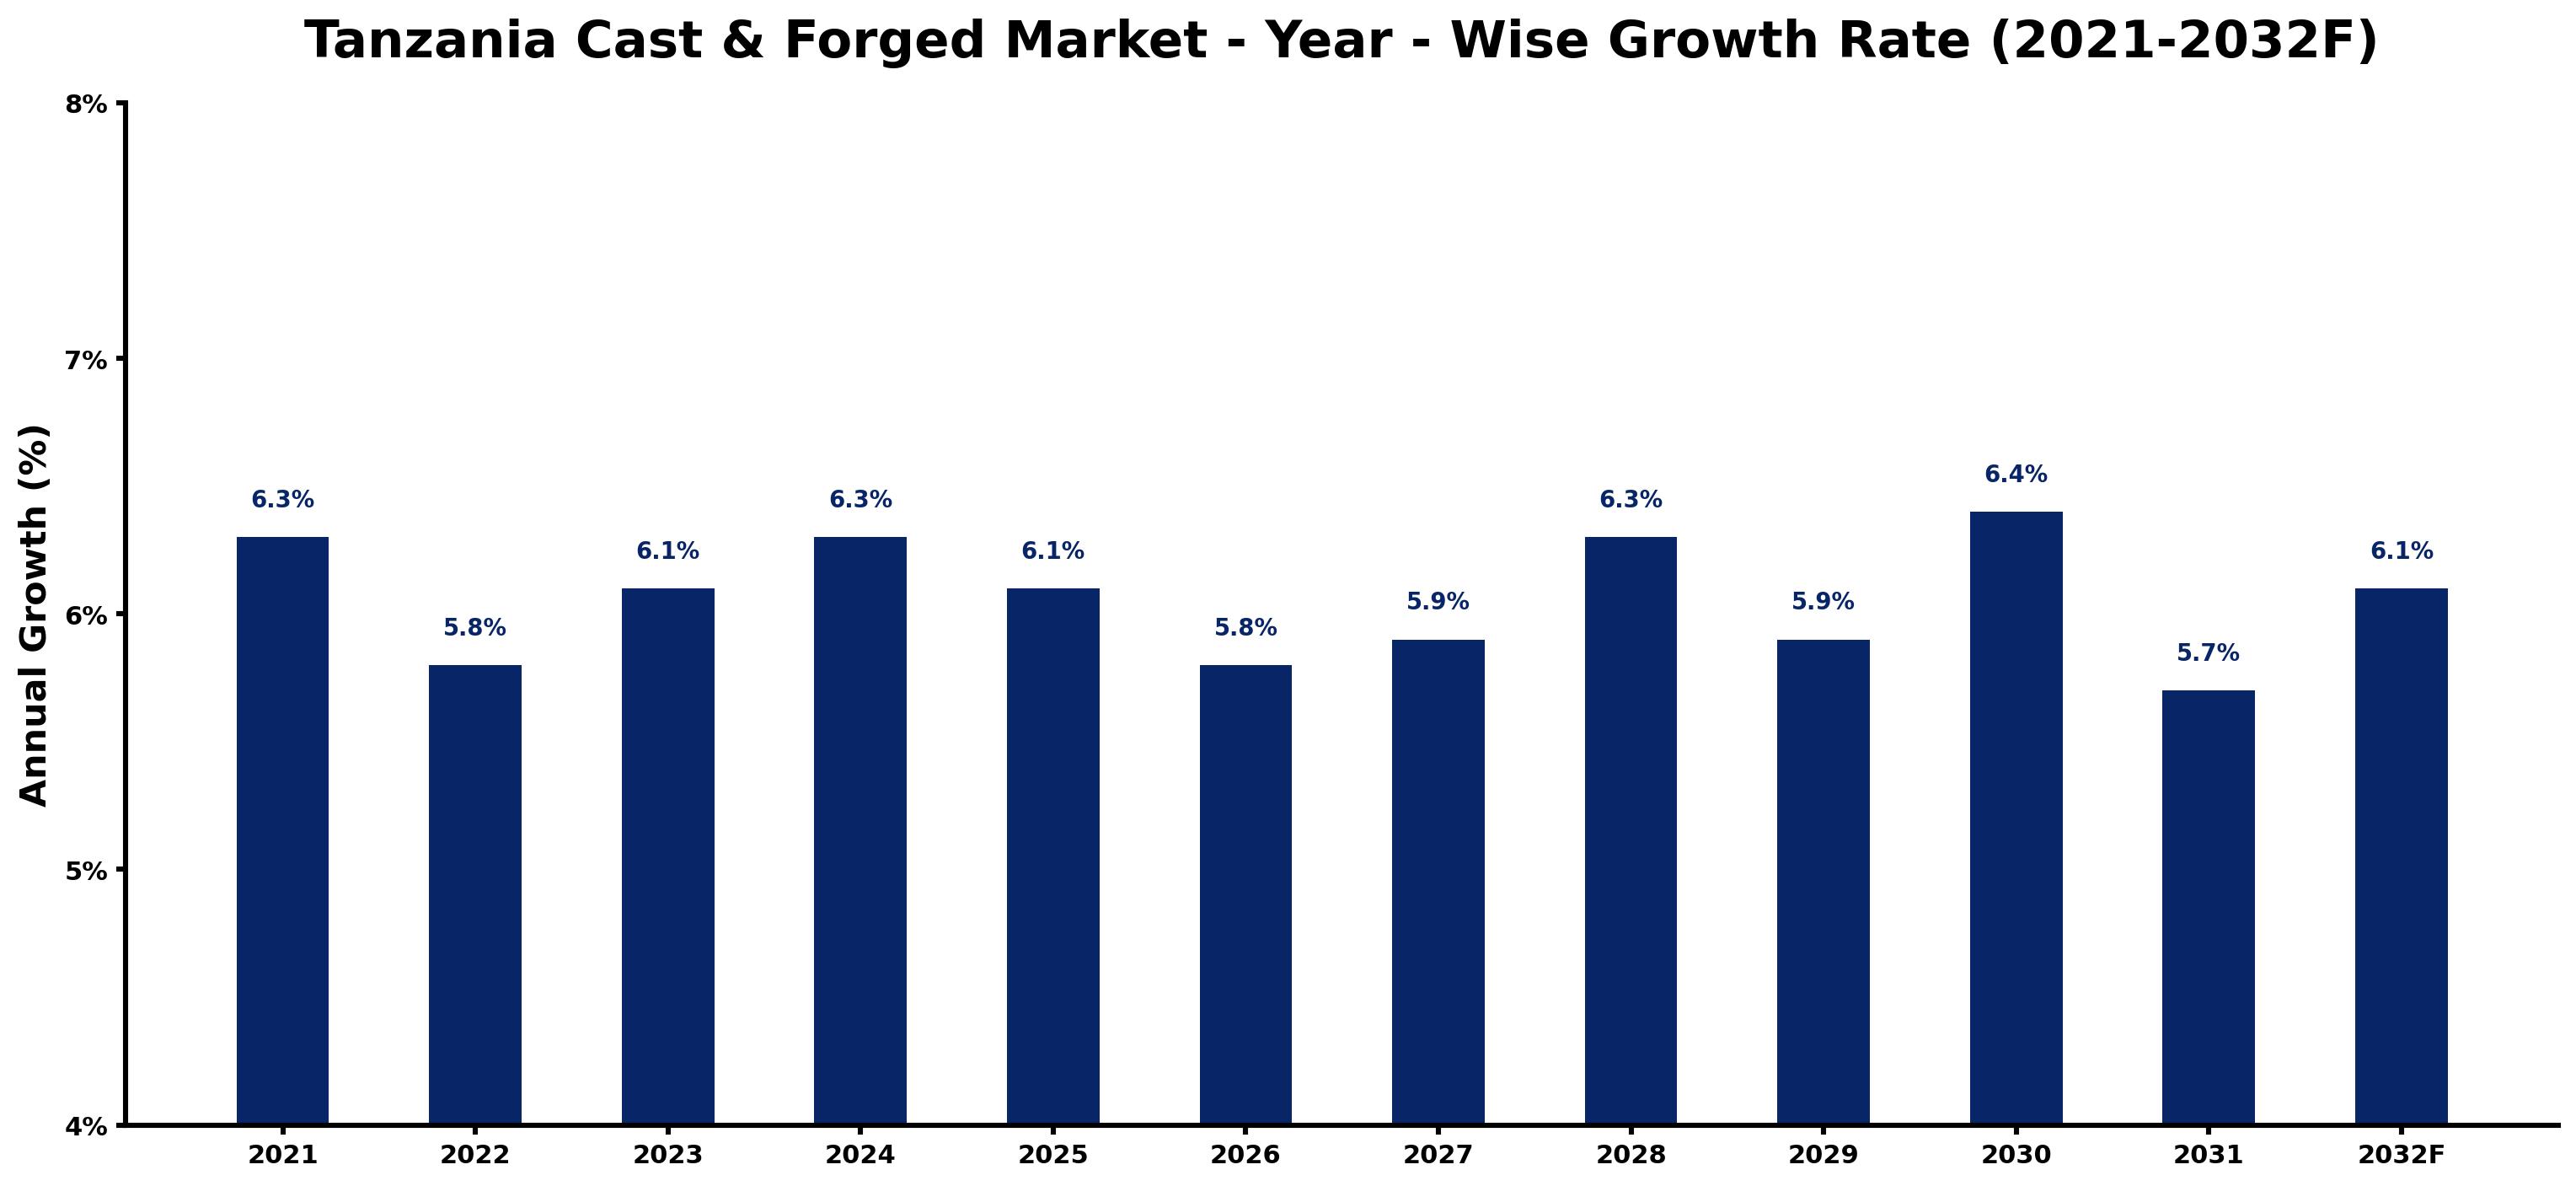
Tanzania Cast & Forged Market Growth Rate Analysis (2021-2032)
The Tanzanian cast and forged market has exhibited robust growth, registering a notable 6.3% in 2021, followed by a slight dip to 5.8% in 2022 due to global supply chain disruptions. However, recoveries were observed with growth rates of 6.1% in 2023 and returning to 6.3% in 2024, driven by increased demand in the construction and automotive sectors. The stability has been supported by government policies aimed at boosting local manufacturing and infrastructure development. Fluctuations, including a decline to 5.8% in 2026, can be attributed to fluctuating energy costs and a gradual transition towards more sustainable practices. As investments continue in technology and digitalization, a rebound to 6.4% is anticipated in 2030, reflecting the market's resilience and adaptation to evolving consumer demands.
Tanzania Cast & Forged Market Year-wise Growth Rate and Key Drivers
This graph highlights how the Tanzania Cast & Forged Market has steadily grown over the past five years, supported by major growth factors.
The table below presents the year wise growth rates along with the key drivers influencing the market
| Year | Growth Rate | Major Drivers |
| 2021 | 6.3% | Tanzania's mining sector experiences a rebound, signaling increased material requirements for cast and forged products. |
| 2022 | 5.8% | Infrastructure projects commence, enhancing local demand for durable cast and forged components. |
| 2023 | 6.1% | Local manufacturers focus on expanding capacity, reducing reliance on imported forgings and castings. |
| 2024 | 6.3% | Emerging construction standards drive demand for innovative, high-strength materials in various sectors. |
| 2025 | 6.1% | Technological partnerships with global firms introduce advanced manufacturing techniques into Tanzania's market. |
| 2026 | 5.8% | Investment in renewable energy expands, necessitating specialized cast and forged components for turbines. |
| 2027 | 5.9% | Government incentives for industrialization bolster local production capabilities in casting and forging. |
| 2028 | 6.3% | Automotive industry growth boosts demand for lightweight, high-performance forged materials in vehicle production. |
| 2029 | 5.9% | Regional supply chain enhancements improve logistics, facilitating quicker access to forged materials. |
| 2030 | 6.4% | Growing urbanization leads to increased construction projects, fostering demand for robust cast products. |
| 2031 | 5.7% | Local research institutions collaborate with industries, driving innovation in casting and forging techniques. |
| 2032 | 6.1% | Sustainability trends influence preferences for eco-friendly materials in the cast and forged market. |
Note - Market size estimations and growth projections presented in this report are based on 6Wresearch's advanced forecasting approach, validated with industry datasets as of June 2026.
Key Highlights of the Report:
- Tanzania Cast & Forged Market Overview
- Tanzania Cast & Forged Market Outlook
- Market Size of Tanzania Cast & Forged Market, 2025
- Forecast of Tanzania Cast & Forged Market, 2032F
- Historical Data and Forecast of Tanzania Cast & Forged Revenues & Volume for the Period 2022-2032F
- Tanzania Cast & Forged Market Trend Evolution
- Tanzania Cast & Forged Market Drivers and Challenges
- Tanzania Cast & Forged Price Trends
- Tanzania Cast & Forged Porter’s Five Forces
- Tanzania Cast & Forged Industry Life Cycle
- Historical Data and Forecast of Tanzania Cast & Forged Market Revenues & Volume By Product Types for the Period 2022-2032F
- Historical Data and Forecast of Tanzania Cast & Forged Market Revenues & Volume By Light Alloys for the Period 2022-2032F
- Historical Data and Forecast of Tanzania Cast & Forged Market Revenues & Volume By Copper Alloys for the Period 2022-2032F
- Historical Data and Forecast of Tanzania Cast & Forged Market Revenues & Volume By Iron Casting for the Period 2022-2032F
- Historical Data and Forecast of Tanzania Cast & Forged Market Revenues & Volume By Steel Casting for the Period 2022-2032F
- Historical Data and Forecast of Tanzania Cast & Forged Market Revenues & Volume By Miscellaneous for the Period 2022-2032F
- Historical Data and Forecast of Tanzania Cast & Forged Market Revenues & Volume By Activity Types for the Period 2022-2032F
- Historical Data and Forecast of Tanzania Cast & Forged Market Revenues & Volume By Closed Die Forging for the Period 2022-2032F
- Historical Data and Forecast of Tanzania Cast & Forged Market Revenues & Volume By Open Die Forging for the Period 2022-2032F
- Historical Data and Forecast of Tanzania Cast & Forged Market Revenues & Volume By Rolled Ring Forging for the Period 2022-2032F
- Historical Data and Forecast of Tanzania Cast & Forged Market Revenues & Volume By Cold Forging for the Period 2022-2032F
- Historical Data and Forecast of Tanzania Cast & Forged Market Revenues & Volume By Non-ferrous Closed Die Forging for the Period 2022-2032F
- Historical Data and Forecast of Tanzania Cast & Forged Market Revenues & Volume By Applications for the Period 2022-2032F
- Historical Data and Forecast of Tanzania Cast & Forged Market Revenues & Volume By Automotive for the Period 2022-2032F
- Historical Data and Forecast of Tanzania Cast & Forged Market Revenues & Volume By Aerospace for the Period 2022-2032F
- Historical Data and Forecast of Tanzania Cast & Forged Market Revenues & Volume By Oil & Gas for the Period 2022-2032F
- Historical Data and Forecast of Tanzania Cast & Forged Market Revenues & Volume By Construction for the Period 2022-2032F
- Historical Data and Forecast of Tanzania Cast & Forged Market Revenues & Volume By Agriculture for the Period 2022-2032F
- Historical Data and Forecast of Tanzania Cast & Forged Market Revenues & Volume By Industrial for the Period 2022-2032F
- Historical Data and Forecast of Tanzania Cast & Forged Market Revenues & Volume By Others for the Period 2022-2032F
- Tanzania Cast & Forged Import Export Trade Statistics
- Market Opportunity Assessment By Product Types
- Market Opportunity Assessment By Activity Types
- Market Opportunity Assessment By Applications
- Tanzania Cast & Forged Top Companies Market Share
- Tanzania Cast & Forged Competitive Benchmarking By Technical and Operational Parameters
- Tanzania Cast & Forged Company Profiles
- Tanzania Cast & Forged Key Strategic Recommendations
Frequently Asked Questions About the Market Study (FAQs):
6Wresearch actively monitors the Tanzania Cast & Forged Market and publishes its comprehensive annual report, highlighting emerging trends, growth drivers, revenue analysis, and forecast outlook. Our insights help businesses to make data-backed strategic decisions with ongoing market dynamics. Our analysts track relevent industries related to the Tanzania Cast & Forged Market, allowing our clients with actionable intelligence and reliable forecasts tailored to emerging regional needs.
Yes, we provide customisation as per your requirements. To learn more, feel free to contact us on sales@6wresearch.com
| Table of Contents |
| 1. Executive Summary |
| 2. Introduction |
| 2.1. Key Highlights of the Report |
| 2.2. Report Description |
| 2.3. Market Scope & Segmentation |
| 2.4. Research Methodology |
| 2.5. Assumptions |
| 3. Tanzania Cast & Forged Market Overview |
| 3.1. Tanzania Country Macro Economic Indicators |
| 3.2. Tanzania Cast & Forged Market Revenues & Volume, 2022 & 2032F |
| 3.3. Tanzania Cast & Forged Market - Industry Life Cycle |
| 3.4. Tanzania Cast & Forged Market - Porter's Five Forces |
| 3.5. Tanzania Cast & Forged Market Revenues & Volume Share, By Product Types, 2022 & 2032F |
| 3.6. Tanzania Cast & Forged Market Revenues & Volume Share, By Activity Types, 2022 & 2032F |
| 3.7. Tanzania Cast & Forged Market Revenues & Volume Share, By Applications, 2022 & 2032F |
| 4. Tanzania Cast & Forged Market Dynamics |
| 4.1. Impact Analysis |
| 4.2. Market Drivers |
| 4.3. Market Restraints |
| 5. Tanzania Cast & Forged Market Trends |
| 6. Tanzania Cast & Forged Market, By Types |
| 6.1. Tanzania Cast & Forged Market, By Product Types |
| 6.1.1 Overview and Analysis |
| 6.1.2. Tanzania Cast & Forged Market Revenues & Volume, By Product Types, 2022-2032F |
| 6.1.3. Tanzania Cast & Forged Market Revenues & Volume, By Light Alloys, 2022-2032F |
| 6.1.4. Tanzania Cast & Forged Market Revenues & Volume, By Copper Alloys, 2022-2032F |
| 6.1.5. Tanzania Cast & Forged Market Revenues & Volume, By Iron Casting, 2022-2032F |
| 6.1.6. Tanzania Cast & Forged Market Revenues & Volume, By Steel Casting, 2022-2032F |
| 6.1.7. Tanzania Cast & Forged Market Revenues & Volume, By Miscellaneous, 2022-2032F |
| 6.2. Tanzania Cast & Forged Market, By Activity Types |
| 6.2.1. Overview and Analysis |
| 6.2.2. Tanzania Cast & Forged Market Revenues & Volume, By Closed Die Forging, 2022-2032F |
| 6.2.3. Tanzania Cast & Forged Market Revenues & Volume, By Open Die Forging, 2022-2032F |
| 6.2.4. Tanzania Cast & Forged Market Revenues & Volume, By Rolled Ring Forging, 2022-2032F |
| 6.2.5. Tanzania Cast & Forged Market Revenues & Volume, By Cold Forging, 2022-2032F |
| 6.2.6. Tanzania Cast & Forged Market Revenues & Volume, By Non-ferrous Closed Die Forging, 2022-2032F |
| 6.3. Tanzania Cast & Forged Market, By Applications |
| 6.3.1. Overview and Analysis |
| 6.3.2. Tanzania Cast & Forged Market Revenues & Volume, By Automotive, 2022-2032F |
| 6.3.3 Tanzania Cast & Forged Market Revenues & Volume, By Aerospace, 2022-2032F |
| 6.3.4. Tanzania Cast & Forged Market Revenues & Volume, By Oil & Gas, 2022-2032F |
| 6.3.5. Tanzania Cast & Forged Market Revenues & Volume, By Construction, 2022-2032F |
| 6.3.6. Tanzania Cast & Forged Market Revenues & Volume, By Agriculture, 2022-2032F |
| 6.3.7. Tanzania Cast & Forged Market Revenues & Volume, By Industrial, 2022-2032F |
| 7. Tanzania Cast & Forged Market Import-Export Trade Statistics |
| 7.1. Tanzania Cast & Forged Market Export to Major Countries |
| 7.2. Tanzania Cast & Forged Market Imports from Major Countries |
| 8. Tanzania Cast & Forged Market Key Performance Indicators |
| 9. Tanzania Cast & Forged Market - Opportunity Assessment |
| 9.1. Tanzania Cast & Forged Market Opportunity Assessment, By Product Types, 2022 & 2032F |
| 9.2. Tanzania Cast & Forged Market Opportunity Assessment, By Activity Types, 2022 & 2032F |
| 9.3. Tanzania Cast & Forged Market Opportunity Assessment, By Applications, 2022 & 2032F |
| 10. Tanzania Cast & Forged Market - Competitive Landscape |
| 10.1. Tanzania Cast & Forged Market Revenue Share, By Companies, 2025 |
| 10.2. Tanzania Cast & Forged Market Competitive Benchmarking, By Operating and Technical Parameters |
| 11. Company Profiles |
| 12. Recommendations |
| 13. Disclaimer |
Global Go To Market Strategy - 2030
Export potential enables firms to identify high-growth global markets with greater confidence by combining advanced trade intelligence with a structured quantitative methodology. The framework analyzes emerging demand trends and country-level import patterns while integrating macroeconomic and trade datasets such as GDP and population forecasts, bilateral import–export flows, tariff structures, elasticity differentials between developed and developing economies, geographic distance, and import demand projections. Using weighted trade values from 2020–2024 as the base period to project country-to-country export potential for 2030, these inputs are operationalized through calculated drivers such as gravity model parameters, tariff impact factors, and projected GDP per-capita growth. Through an analysis of hidden potentials, demand hotspots, and market conditions that are most favorable to success, this method enables firms to focus on target countries, maximize returns, and global expansion with data, backed by accuracy.
By factoring in the projected importer demand gap that is currently unmet and could be potential opportunity, it identifies the potential for the Exporter (Country) among 190 countries, against the general trade analysis, which identifies the biggest importer or exporter.
To discover high-growth global markets and optimize your business strategy:
Click Here
Pricing
- Single User License$ 1,995
- Department License$ 2,400
- Site License$ 3,120
- Global License$ 3,795

Leadership Perspectives from Industry Events
Search
Thought Leadership and Analyst Meet


Our Clients
6WResearch In News
- India Air Conditioner Market Set for Strong Rebound in 2026 After Weather-Led Correction and GST-Driven Recovery: 6Wresearch
- ADAS in India: How Automatic Emergency Braking, Blind Spot Detection & Driver Monitoring are Transforming Road Safety
- Doha a strategic location for EV manufacturing hub: IPA Qatar
- Demand for luxury TVs surging in the GCC, says Samsung
- Empowering Growth: The Thriving Journey of Bangladesh’s Cable Industry
- Demand for luxury TVs surging in the GCC, says Samsung
Latest Reports
- Nicaragua RPG Gaming Market (2026-2032)
- New Zealand RPG Gaming Market (2026-2032)
- Netherlands RPG Gaming Market (2026-2032)
- Nauru RPG Gaming Market (2026-2032)
- Namibia RPG Gaming Market (2026-2032)
- Mozambique RPG Gaming Market (2026-2032)
- Montenegro RPG Gaming Market (2026-2032)
- Mongolia RPG Gaming Market (2026-2032)
- Monaco RPG Gaming Market (2026-2032)
- Micronesia RPG Gaming Market (2026-2032)
Industry Events and Analyst Meet

HIMTEX 2026

India Refining Summit 2026

India EV Show 2026

EV tech India Expo 2026

Auto Tech Asia 2026
Whitepaper
- Middle East & Africa Commercial Security Market Click here to view more.
- Middle East & Africa Fire Safety Systems & Equipment Market Click here to view more.
- GCC Drone Market Click here to view more.
- Middle East Lighting Fixture Market Click here to view more.
- GCC Physical & Perimeter Security Market Click here to view more.