Tanzania Electrical and electronics Market (2026-2032) | Outlook, Value, Companies, Analysis, Share, Industry, Growth, Size, Trends, Revenue & Forecast
Market Forecast By Type (Electric Motors, Primary And Storage Batteries, Generators, Semiconductors, Household Appliances), By Applications (Online, Offline) And Competitive Landscape
| Product Code: ETC039816 | Publication Date: Jan 2021 | Updated Date: Jun 2026 | Product Type: Report | |
| Publisher: 6Wresearch | Author: Dhaval Chaurasia | No. of Pages: 70 | No. of Figures: 35 | No. of Tables: 5 |
Tanzania Electrical and electronics Market Summary
The tanzania electrical and electronics market was estimated at USD 853 Million in 2025 and is projected to reach USD 1239 Million by 2032, growing at a CAGR of 6.3% from 2026 to 2032.
Tanzania Electrical and electronics Market Year-wise Growth Rate and Key Drivers
This graph highlights how the Tanzania Electrical and electronics Market has steadily grown over the past five years, supported by major growth factors.
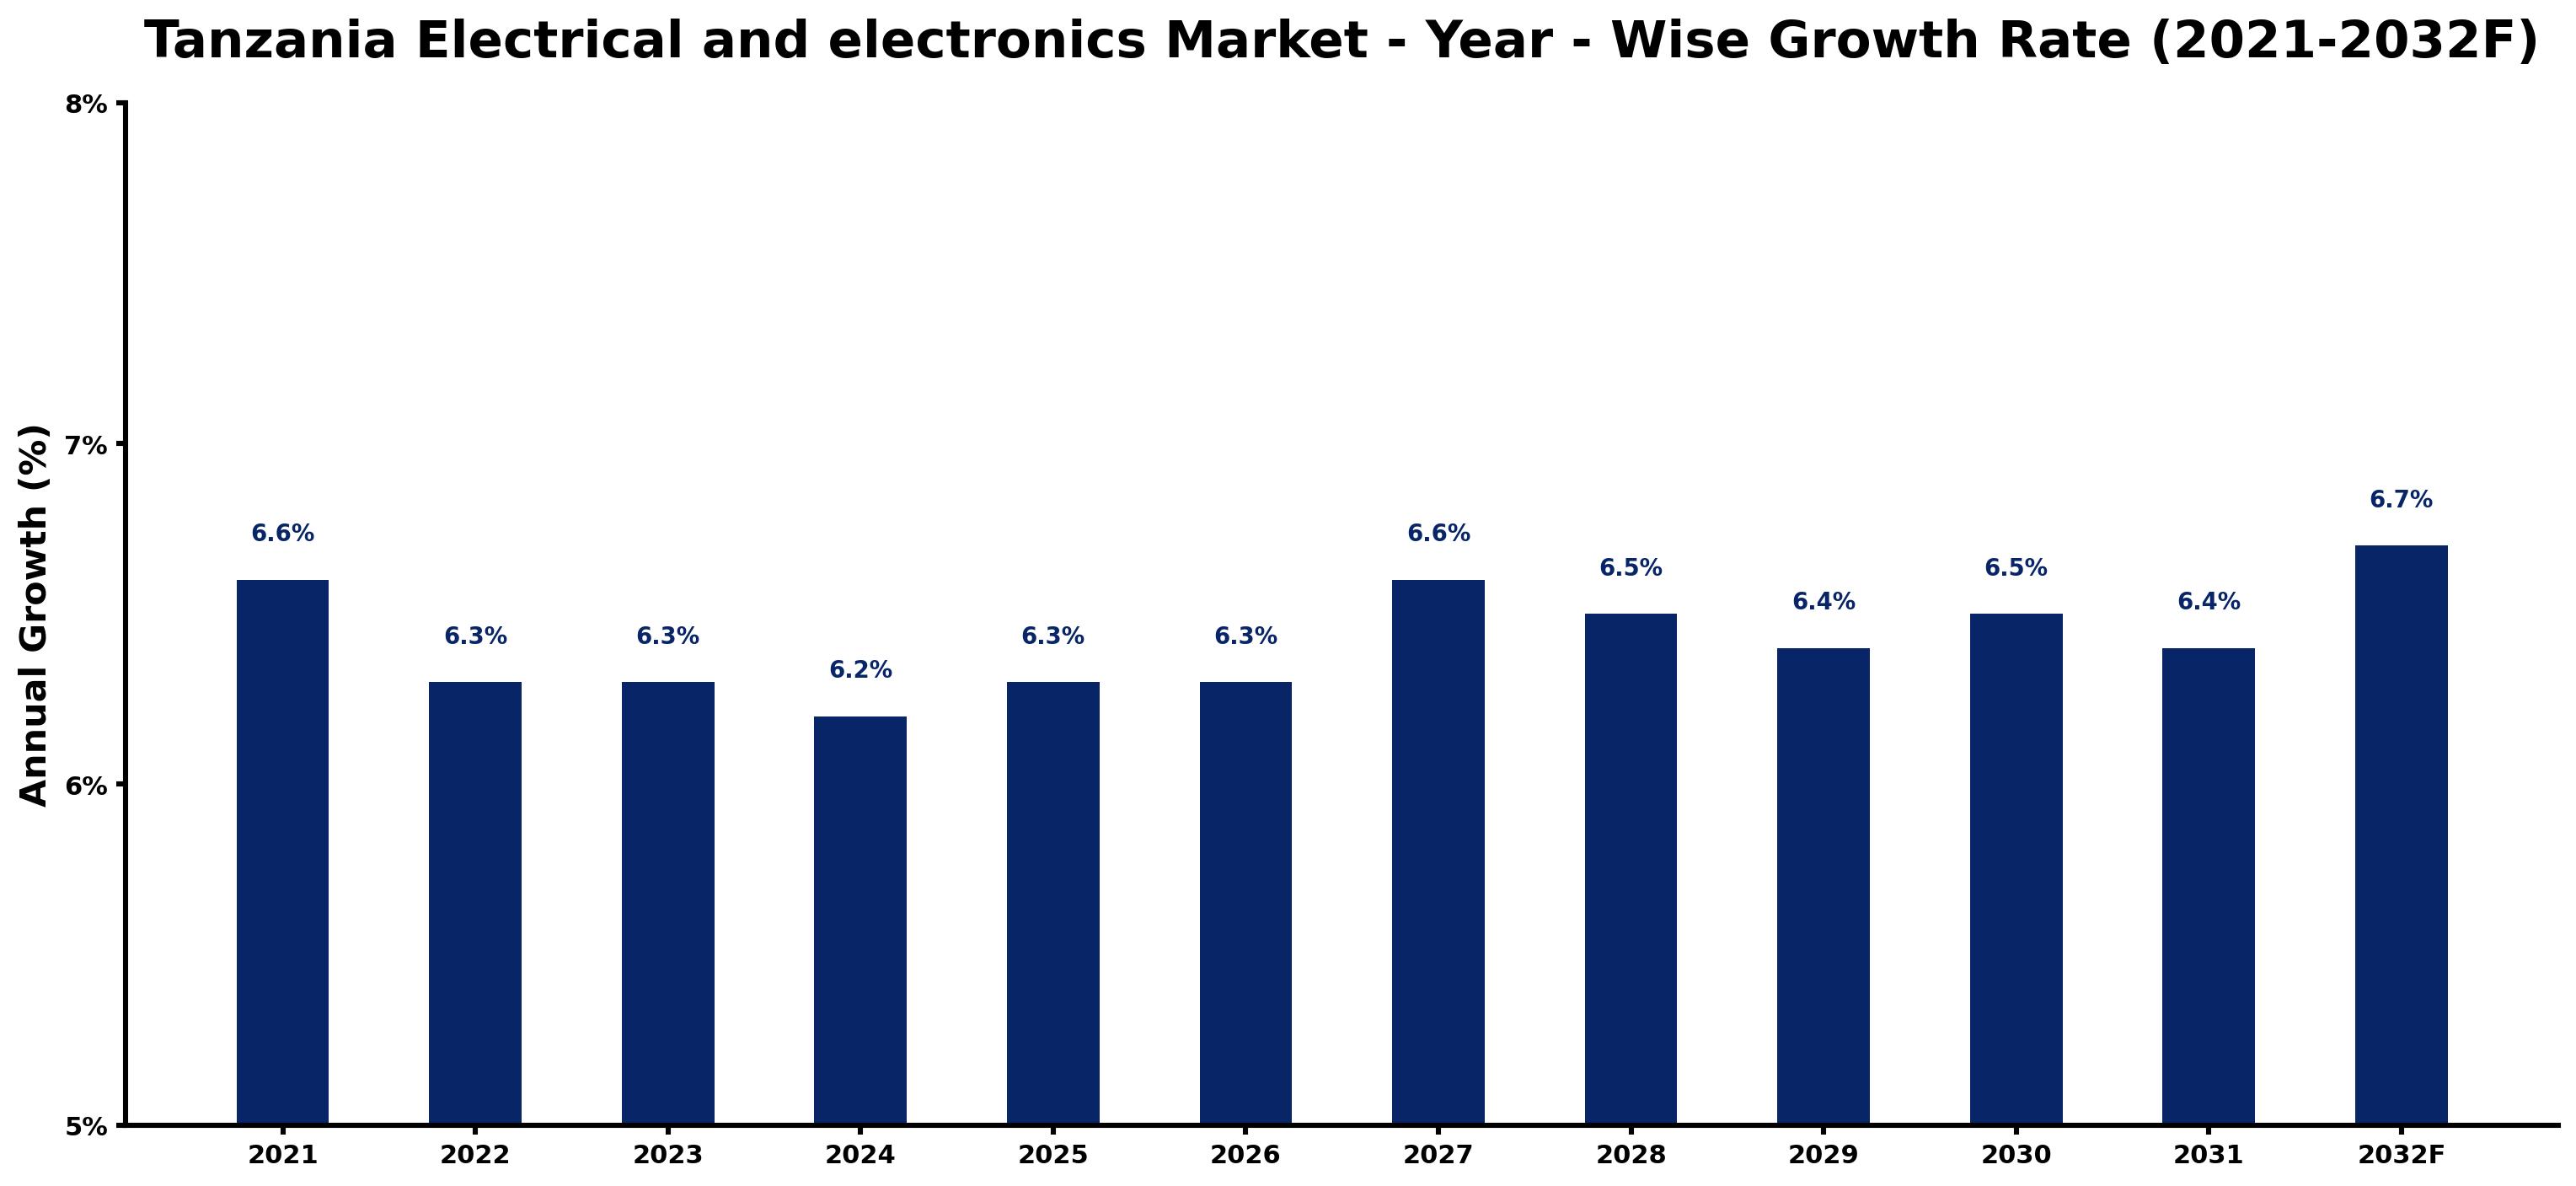
The table below presents the year wise growth rates along with the key drivers influencing the market
| Year | Growth Rate | Major Drivers |
| 2021 | 6.6% | Electrification efforts complemented investments in solar energy systems across rural areas. |
| 2022 | 6.3% | Shifts in consumer preferences towards affordable electronic devices expanded market opportunities. |
| 2023 | 6.3% | Partnerships with international firms introduced innovative technologies into local production sites. |
| 2024 | 6.2% | Rising urbanization created increased needs for reliable electrical infrastructure in cities. |
| 2025 | 6.3% | Local manufacturers began focusing on energy-efficient products to cater to environmental concerns. |
| 2026 | 6.3% | Access to microfinancing facilitated small business investments in electronics retail and distribution. |
| 2027 | 6.6% | Integration of mobile payment systems transformed consumer purchasing behavior in the electronics sector. |
| 2028 | 6.5% | Growth in the telecommunications sector spurred demand for smart devices and accessories. |
| 2029 | 6.4% | Education initiatives promoted technical skills, enhancing workforce capabilities for electronics assembly. |
| 2030 | 6.5% | Investment in renewable energy sources improved grid stability and attracted foreign investors. |
| 2031 | 6.4% | E-commerce growth allowed new brands to thrive, reshaping market dynamics and competition. |
| 2032 | 6.7% | Increased collaboration between government and private sectors enhanced research and development efforts. |
Note - Market size estimations and growth projections presented in this report are based on 6Wresearch's advanced forecasting approach, validated with industry datasets as of June 2026.
Tanzania Electrical and electronics Market Synopsis
The Tanzania Electrical and electronics Market is projected to reach 6.3% and witness significant growth during the forecast period (2026-2032). This evolving landscape is the result of several driving factors including urbanization, increasing disposable incomes, and governmental initiatives aimed at enhancing electricity accessibility across various demographics. With a robust focus on sectors such as consumer electronics, industrial electronics, home appliances, and renewable energy products, the market is becoming increasingly dynamic and responsive to both consumer needs and technological advancements.
Tanzania Electrical and electronics Market Growth Drivers
Several elements are contributing to the growth of the Tanzania Electrical and electronics Market, notably:
- Urbanization: The acceleration of urban development in Tanzania is driving demand for modern electrical and electronic products. Urban centers are experiencing an influx of residents seeking improved living standards, which often includes advanced home appliances and electronics.
- Rising Disposable Incomes: With an expanding middle class, more consumers have the financial capacity to invest in high-quality electrical and electronic products, further propelling market growth.
- Government Initiatives: The Tanzanian government is actively promoting initiatives to improve electricity infrastructure, which includes supporting renewable energy solutions, sparking an increase in demand for associated products.
- Emphasis on Energy Efficiency: There is a growing awareness regarding energy conservation among consumers. Many are now seeking energy-efficient products that minimize electricity costs and reduce environmental impact.
- Technological Advancements: Continuous innovations in smart home technologies and digital solutions are enhancing market appeal, encouraging consumers to adopt products with advanced functionalities.
Tanzania Electrical and electronics Market Challenges and Restraints
Despite the promising growth trajectory, the Tanzania Electrical and electronics Market faces several challenges:
- Inadequate Infrastructure: The existing electrical infrastructure is often insufficient to support a growing market for electrical products, particularly in rural areas, where access to reliable electricity is limited.
- High Import Tariffs: The imposition of high tariffs on imported electrical goods makes them prohibitively expensive for many consumers, limiting overall market demand.
- Counterfeit Products: The prevalence of counterfeit electronics can undermine consumer confidence and deter investment, as these products can damage the reputation of legitimate manufacturers.
- Limited Skilled Labor: A scarcity of skilled labor in technical and engineering fields can impede innovation and the development of high-quality products, which is essential for market growth.
- Affordability Issues: While demand for high-end products is rising, affordability remains a significant hurdle for many potential buyers, particularly in lower-income segments.
Tanzania Electrical and electronics Market Investment Opportunities
The increasing economic activities and consumer demand present a range of investment opportunities within the Tanzania Electrical and electronics Market:
- Renewable Energy Solutions: Given Tanzania's rich natural resources, there is substantial potential for investment in renewable energy technologies such as solar and wind, which can cater to growing energy needs.
- Manufacturing of Household Appliances: The rising middle-class population opens avenues for manufacturing and distributing affordable household electronics, responding to local demand.
- Electric Vehicle Infrastructure: With the government's push towards sustainable transportation, there is an opportunity for developing the infrastructure for electric vehicles, including charging stations.
- Smart Home Technology: Investments in smart home gadgets and IoT-enabled appliances are gaining traction, offering a lucrative market segment as consumer interest increases.
- Skill Development Programs: Investing in training initiatives to upskill local labor can significantly benefit the sector by enhancing innovation and local manufacturing capabilities.
Tanzania Electrical and electronics Market Government Investment and Initiatives
The Tanzanian government has introduced a series of policies designed to bolster the electrical and electronics market. Central to these initiatives is the Electronics and Postal Communications Act, which governs the sector with the aim of attracting foreign and local investment. Additionally, the Tanzania Engineering and Manufacturing Design Organization (TEMDO) has been established to stimulate local manufacturing and innovation in the electronics field. Various public spending initiatives focus on enhancing domestic production capacities and creating an environment conducive to business growth. The National Industrial Development Policy also outlines comprehensive strategies to elevate the sector, emphasizing technology advancement and competitive practices in the electrical and electronics market.
Tanzania Electrical and electronics Market Latest Developments (May 2025 - June 2026)
During the period from May 2025 to June 2026, the Tanzania Electrical and electronics Market has seen a number of notable developments. The government has intensified its efforts in promoting renewable energy sources, leading to more partnerships aimed at enhancing solar and wind energy projects within the country. Furthermore, advancements in smart technology have encouraged the introduction of a variety of innovative home electronics, aligning with global trends in automation and IoT. The focus on energy efficiency remains paramount, with more manufacturers beginning to offer eco-friendly products to meet consumer demand. Additionally, discussions around improving infrastructure to address energy supply inconsistencies have gained traction, promising a future where the electrical landscape in Tanzania could become more stable and reliable.
Tanzania Electrical and electronics Market - Key Attractiveness of the Report
- 10 Years of Market Numbers
- Historical Data Starting from 2022 to 2025
- Base Year: 2025
- Forecast Data until 2032
- Key Performance Indicators Impacting the Market
- Major Upcoming Developments and Projects
Key Highlights of the Report:
- Tanzania Electrical and electronics Market Outlook
- Market Size of Tanzania Electrical and electronics Market, 2025
- Forecast of Tanzania Electrical and electronics Market, 2032F
- Historical Data and Forecast of Tanzania Electrical and electronics Revenues & Volume for the Period 2022-2032F
- Tanzania Electrical and electronics Market Trend Evolution
- Tanzania Electrical and electronics Market Drivers and Challenges
- Tanzania Electrical and electronics Price Trends
- Tanzania Electrical and electronics Porter's Five Forces
- Tanzania Electrical and electronics Industry Life Cycle
- Historical Data and Forecast of Tanzania Electrical and electronics Market Revenues & Volume By Type for the Period 2022-2032F
- Historical Data and Forecast of Tanzania Electrical and electronics Market Revenues & Volume By Electric Motors for the Period 2022-2032F
- Historical Data and Forecast of Tanzania Electrical and electronics Market Revenues & Volume By Primary And Storage Batteries for the Period 2022-2032F
- Historical Data and Forecast of Tanzania Electrical and electronics Market Revenues & Volume By Generators for the Period 2022-2032F
- Historical Data and Forecast of Tanzania Electrical and electronics Market Revenues & Volume By Semiconductors for the Period 2022-2032F
- Historical Data and Forecast of Tanzania Electrical and electronics Market Revenues & Volume By Household Appliances for the Period 2022-2032F
- Historical Data and Forecast of Tanzania Electrical and electronics Market Revenues & Volume By Applications for the Period 2022-2032F
- Historical Data and Forecast of Tanzania Electrical and electronics Market Revenues & Volume By Online for the Period 2022-2032F
- Historical Data and Forecast of Tanzania Electrical and electronics Market Revenues & Volume By Offline for the Period 2022-2032F
- Tanzania Electrical and electronics Import Export Trade Statistics
- Market Opportunity Assessment By Type
- Market Opportunity Assessment By Applications
- Tanzania Electrical and electronics Top Companies Market Share
- Tanzania Electrical and electronics Competitive Benchmarking By Technical and Operational Parameters
- Tanzania Electrical and electronics Company Profiles
- Tanzania Electrical and electronics Key Strategic Recommendations
Frequently Asked Questions About the Market Study (FAQs):
The market is anticipated to witness significant growth during the 2026-2032 forecast period due to various economic and infrastructural drivers.
Key challenges include inadequate infrastructure, high import tariffs, counterfeit products, and limited access to skilled labor.
The government has established policies and organizations such as the Electronics and Postal Communications Act and TEMDO to attract investments and encourage local manufacturing.
Opportunities include renewable energy solutions, manufacturing of household appliances, electric vehicle infrastructure, and advancements in smart home technologies.
6Wresearch actively monitors the Tanzania Electrical and electronics Market and publishes its comprehensive annual report, highlighting emerging trends, growth drivers, revenue analysis, and forecast outlook. Our insights help businesses to make data-backed strategic decisions with ongoing market dynamics. Our analysts track relevent industries related to the Tanzania Electrical and electronics Market, allowing our clients with actionable intelligence and reliable forecasts tailored to emerging regional needs.
Yes, we provide customisation as per your requirements. To learn more, feel free to contact us on sales@6wresearch.com
1 Executive Summary |
2 Introduction |
2.1 Key Highlights of the Report |
2.2 Report Description |
2.3 Market Scope & Segmentation |
2.4 Research Methodology |
2.5 Assumptions |
3 Tanzania Electrical and electronics Market Overview |
3.1 Tanzania Country Macro Economic Indicators |
3.2 Tanzania Electrical and electronics Market Revenues & Volume, 2022 & 2032F |
3.3 Tanzania Electrical and electronics Market - Industry Life Cycle |
3.4 Tanzania Electrical and electronics Market - Porter's Five Forces |
3.5 Tanzania Electrical and electronics Market Revenues & Volume Share, By Type, 2022 & 2032F |
3.6 Tanzania Electrical and electronics Market Revenues & Volume Share, By Applications, 2022 & 2032F |
4 Tanzania Electrical and electronics Market Dynamics |
4.1 Impact Analysis |
4.2 Market Drivers |
4.3 Market Restraints |
5 Tanzania Electrical and electronics Market Trends |
6 Tanzania Electrical and electronics Market, By Types |
6.1 Tanzania Electrical and electronics Market, By Type |
6.1.1 Overview and Analysis |
6.1.2 Tanzania Electrical and electronics Market Revenues & Volume, By Type, 2022-2032F |
6.1.3 Tanzania Electrical and electronics Market Revenues & Volume, By Electric Motors, 2022-2032F |
6.1.4 Tanzania Electrical and electronics Market Revenues & Volume, By Primary And Storage Batteries, 2022-2032F |
6.1.5 Tanzania Electrical and electronics Market Revenues & Volume, By Generators, 2022-2032F |
6.1.6 Tanzania Electrical and electronics Market Revenues & Volume, By Semiconductors, 2022-2032F |
6.1.7 Tanzania Electrical and electronics Market Revenues & Volume, By Household Appliances, 2022-2032F |
6.2 Tanzania Electrical and electronics Market, By Applications |
6.2.1 Overview and Analysis |
6.2.2 Tanzania Electrical and electronics Market Revenues & Volume, By Online, 2022-2032F |
6.2.3 Tanzania Electrical and electronics Market Revenues & Volume, By Offline, 2022-2032F |
7 Tanzania Electrical and electronics Market Import-Export Trade Statistics |
7.1 Tanzania Electrical and electronics Market Export to Major Countries |
7.2 Tanzania Electrical and electronics Market Imports from Major Countries |
8 Tanzania Electrical and electronics Market Key Performance Indicators |
9 Tanzania Electrical and electronics Market - Opportunity Assessment |
9.1 Tanzania Electrical and electronics Market Opportunity Assessment, By Type, 2022 & 2032F |
9.2 Tanzania Electrical and electronics Market Opportunity Assessment, By Applications, 2022 & 2032F |
10 Tanzania Electrical and electronics Market - Competitive Landscape |
10.1 Tanzania Electrical and electronics Market Revenue Share, By Companies, 2025 |
10.2 Tanzania Electrical and electronics Market Competitive Benchmarking, By Operating and Technical Parameters |
11 Company Profiles |
12 Recommendations |
13 Disclaimer |
Global Go To Market Strategy - 2030
Export potential enables firms to identify high-growth global markets with greater confidence by combining advanced trade intelligence with a structured quantitative methodology. The framework analyzes emerging demand trends and country-level import patterns while integrating macroeconomic and trade datasets such as GDP and population forecasts, bilateral import–export flows, tariff structures, elasticity differentials between developed and developing economies, geographic distance, and import demand projections. Using weighted trade values from 2020–2024 as the base period to project country-to-country export potential for 2030, these inputs are operationalized through calculated drivers such as gravity model parameters, tariff impact factors, and projected GDP per-capita growth. Through an analysis of hidden potentials, demand hotspots, and market conditions that are most favorable to success, this method enables firms to focus on target countries, maximize returns, and global expansion with data, backed by accuracy.
By factoring in the projected importer demand gap that is currently unmet and could be potential opportunity, it identifies the potential for the Exporter (Country) among 190 countries, against the general trade analysis, which identifies the biggest importer or exporter.
To discover high-growth global markets and optimize your business strategy:
Click Here
Pricing
- Single User License$ 1,995
- Department License$ 2,400
- Site License$ 3,120
- Global License$ 3,795

Leadership Perspectives from Industry Events
Search
Thought Leadership and Analyst Meet


Our Clients
6WResearch In News
- India Air Conditioner Market Set for Strong Rebound in 2026 After Weather-Led Correction and GST-Driven Recovery: 6Wresearch
- ADAS in India: How Automatic Emergency Braking, Blind Spot Detection & Driver Monitoring are Transforming Road Safety
- Doha a strategic location for EV manufacturing hub: IPA Qatar
- Demand for luxury TVs surging in the GCC, says Samsung
- Empowering Growth: The Thriving Journey of Bangladesh’s Cable Industry
- Demand for luxury TVs surging in the GCC, says Samsung
Latest Reports
- Nicaragua RPG Gaming Market (2026-2032)
- New Zealand RPG Gaming Market (2026-2032)
- Netherlands RPG Gaming Market (2026-2032)
- Nauru RPG Gaming Market (2026-2032)
- Namibia RPG Gaming Market (2026-2032)
- Mozambique RPG Gaming Market (2026-2032)
- Montenegro RPG Gaming Market (2026-2032)
- Mongolia RPG Gaming Market (2026-2032)
- Monaco RPG Gaming Market (2026-2032)
- Micronesia RPG Gaming Market (2026-2032)
Industry Events and Analyst Meet

EV India Expo 2026

HIMTEX 2026

India Refining Summit 2026

India EV Show 2026

EV tech India Expo 2026
Whitepaper
- Middle East & Africa Commercial Security Market Click here to view more.
- Middle East & Africa Fire Safety Systems & Equipment Market Click here to view more.
- GCC Drone Market Click here to view more.
- Middle East Lighting Fixture Market Click here to view more.
- GCC Physical & Perimeter Security Market Click here to view more.