Tanzania Fish Market Size, Share & Growth Rate
The Tanzania Fish Market was estimated at USD 310 Million in 2025 and is projected to reach USD 407 Million by 2032, growing at a CAGR of 4.0% from 2026 to 2032. This upward trajectory is primarily driven by the increasing demand for value-added fish products, such as fillets and smoked fish, as consumers gravitate towards convenience. Additionally, the expanding global awareness of sustainable fishing practices is further bolstering the market, prompting local producers to focus on quality and responsible harvesting methods.
Tanzania Fish Market Year-wise Growth Rate and Key Drivers
This graph highlights how the Tanzania Fish Market has steadily grown over the years, supported by major growth factors.
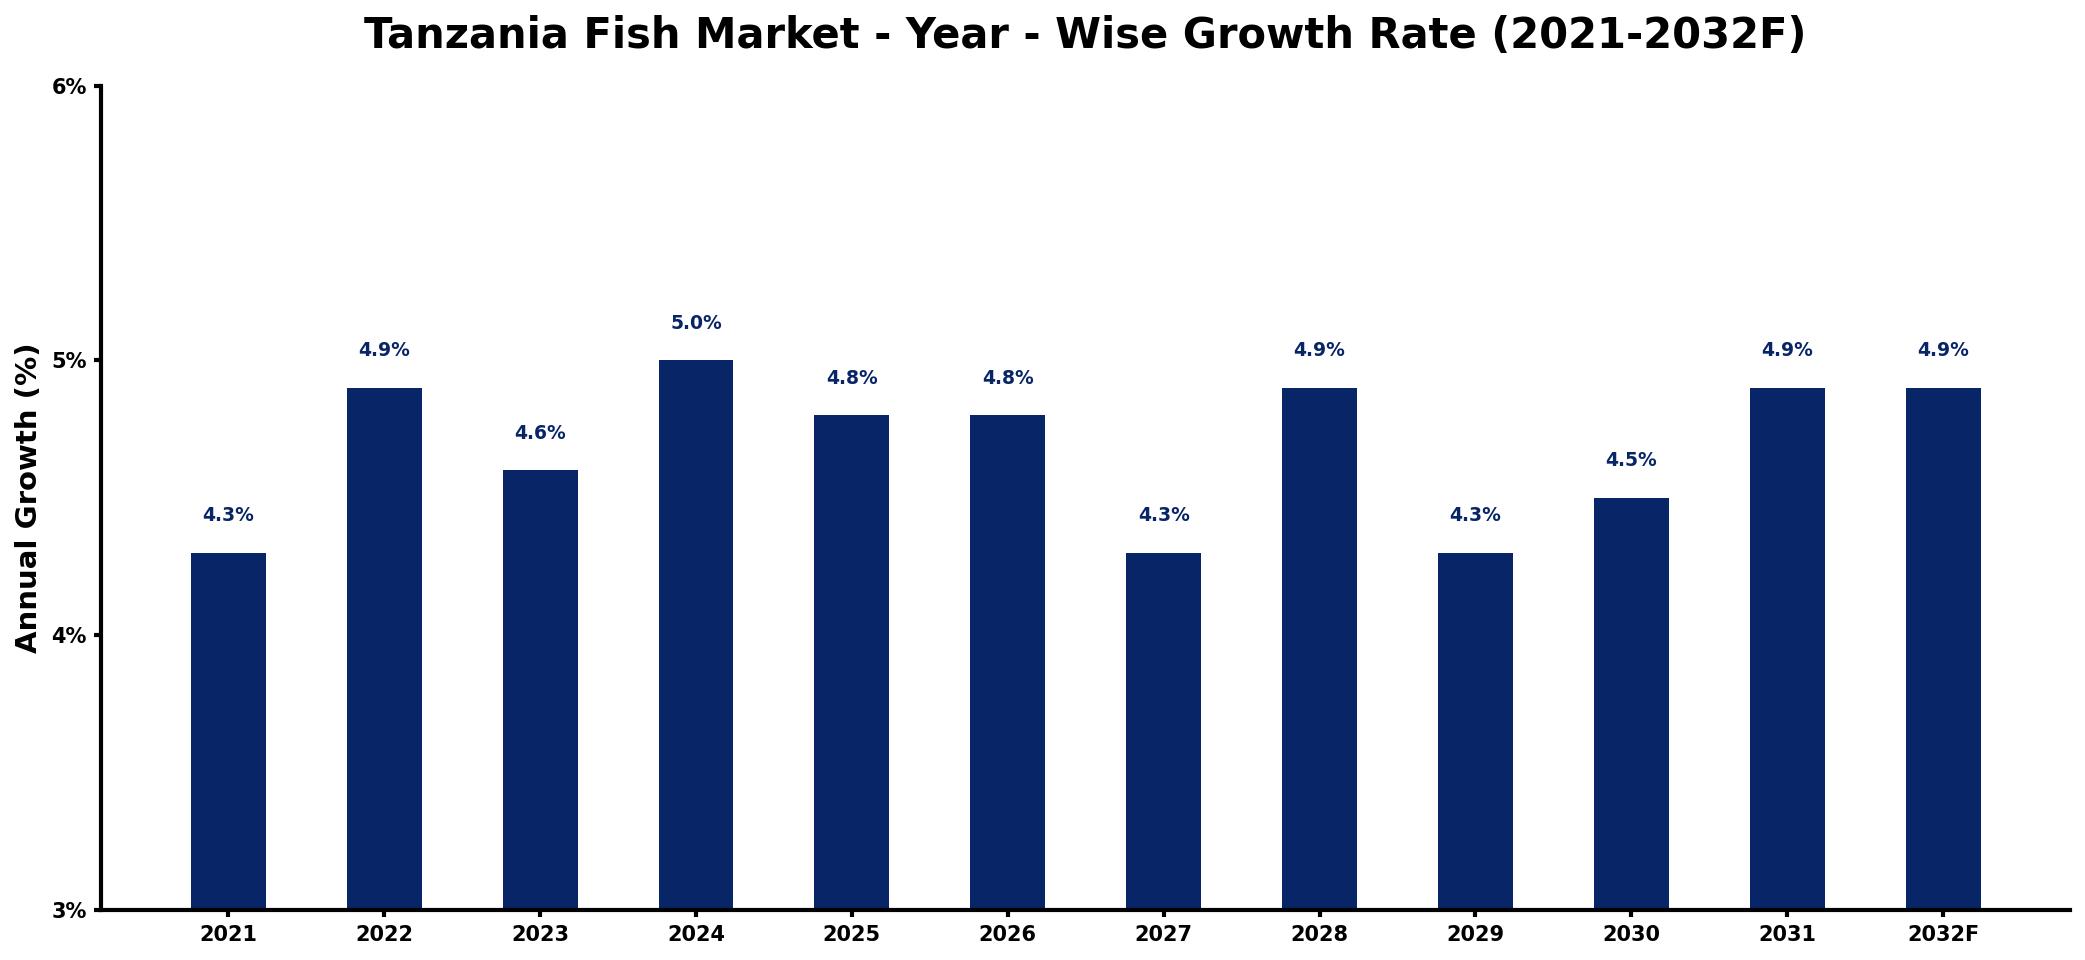
The table below presents the year‑wise growth rates along with the key drivers influencing the market
| Year | Growth Rate | Major Drivers |
| 2021 | 4.3% | Rising health consciousness among consumers |
| 2022 | 4.9% | Growing popularity of sustainable practices |
| 2023 | 4.6% | Increased investment in aquaculture technology |
| 2024 | 5.0% | Expansion of local processing facilities |
| 2025 | 4.8% | Surge in export market demand |
| 2026 | 4.8% | Improved transportation and logistics networks |
| 2027 | 4.3% | Enhanced regulatory support for industry |
| 2028 | 4.9% | Diversification of product offerings available |
| 2029 | 4.3% | Strengthened community support initiatives |
| 2030 | 4.5% | Growing tourism boosting local consumption |
| 2031 | 4.9% | Increased collaboration among stakeholders |
| 2032 | 4.9% | Adoption of innovative marketing strategies |
Note: Market size estimations and growth projections presented in this report are based on 6Wresearch's proprietary forecasting methodology, utilizing the latest available industry data, government publications, and primary research inputs.
Tanzania Fish Market Synopsis
The Tanzania Fish Market is uniquely characterized by a rich variety of local catches, particularly tuna, tilapia, and sardines, which cater to both local and international culinary preferences. The thriving market operates primarily out of bustling coastal towns, where the daily catch is quickly transformed into vibrant displays, enticing both local buyers and exporters.
In recent years, there has been a marked increase in the consumption of freshwater species, such as tilapia and catfish, which are seen as affordable and nutritious options. The emerging trend for ready-to-cook products is reshaping purchasing habits, as consumers seek convenience without compromising quality.
Tanzania Fish Market Key Takeaways
- The market is experiencing a significant shift towards value-added products, driven by changing consumer preferences.
- Sustainable fishing practices are becoming a focal point for both producers and consumers, influencing purchasing decisions.
- Infrastructure improvements are necessary to enhance the supply chain efficiency and reduce post-harvest losses.
- Government regulations aimed at protecting marine resources are reshaping market dynamics, promoting responsible practices.
- The rising interest in aquaculture presents new avenues for investment and growth within the market.
Evaluation of Restraints in Tanzania Fish Market
Despite its potential, the Tanzania Fish Market faces several restraints that could impede growth. Inconsistent fish supply due to overfishing and illegal fishing practices is a pressing concern, along with inadequate storage facilities that result in significant post-harvest losses. Furthermore, the lack of proper infrastructure and transportation options complicates logistics and slows down market access. Quality control and hygiene issues pose additional challenges, impacting the reputation of Tanzanian fish products both domestically and internationally. Addressing these issues will be critical for the long-term viability and sustainability of the market.
Tanzania Fish Market Trends
Current trends in the Tanzania Fish Market reveal a growing demand for ready-to-eat and value-added fish products, aligning with busy lifestyles. Consumers are increasingly drawn to options that require minimal preparation, such as fillets and snacks. Moreover, a greater focus on sustainability is driving preferences for locally sourced fish, as environmental consciousness shapes consumer choices. These trends indicate a market adapting to changing demands, highlighting the importance of innovation in product development.
Tanzania Fish Market Opportunities
The landscape of the Tanzania Fish Market offers numerous investment opportunities, particularly in aquaculture and fish processing. The rich marine resources present lucrative prospects for investors looking to establish commercial fishing operations and cold storage facilities. Additionally, as the demand for value-added fish products rises, businesses that focus on innovative processing methods stand to benefit significantly. The governments commitment to improving infrastructure further enhances the market's attractiveness for future investments.
Government Initiatives in the Tanzania Fish Market
The Tanzanian government has implemented a series of policies aimed at promoting sustainable fishing practices and safeguarding marine ecosystems. These initiatives include regulations surrounding fishing licenses, catch limits, and restrictions on fishing gear to prevent overfishing. Furthermore, the government is actively enforcing quality control measures to ensure safety and consumer satisfaction with fish products in the market. Efforts to combat illegal fishing through patrols and penalties also reflect a commitment to the long-term health of the fishing industry.
Future Insights of the Tanzania Fish Market
Looking ahead to 2026-2032, the Tanzania Fish Market is set for promising expansion. The burgeoning demand for seafood, both locally and internationally, will position Tanzania favorably within the global market. Continued advancements in processing and storage technologies will likely enhance product quality and supply chain efficiency. However, the industry must remain vigilant regarding environmental concerns and ensure that sustainable practices are prioritized to maintain growth and consumer trust.
Tanzania Fish Market Latest Developments (2025 - 2026)
Recent developments within the Tanzania Fish Market indicate a proactive approach to addressing industry challenges. Various stakeholders are collaborating on initiatives aimed at enhancing fish processing techniques, promoting sustainable fishing practices, and improving market access for local fishers. Additionally, there is a heightened focus on establishing eco-friendly aquaculture ventures, catering to the growing demand for responsibly sourced seafood. These efforts reflect a collective commitment to fortifying the markets position and ensuring its sustainability in the face of emerging challenges.
Tanzania Fish Market - Key Attractiveness of the Report
- 10 Years of Market Numbers
- Historical Data Starting from 2022 to 2025
- Base Year: 2025
- Forecast Data until 2032
- Key Performance Indicators Impacting the Market
- Major Upcoming Developments and Projects
Key Highlights of the Report:
- Tanzania Fish Market Outlook
- Market Size of Tanzania Fish Market, 2025
- Forecast of Tanzania Fish Market, 2032
- Historical Data and Forecast of Tanzania Fish Revenues & Volume for the Period 2022-2032F
- Tanzania Fish Market Trend Evolution
- Tanzania Fish Market Drivers and Challenges
- Tanzania Fish Price Trends
- Tanzania Fish Porter's Five Forces
- Tanzania Fish Industry Life Cycle
- Historical Data and Forecast of Tanzania Fish Market Revenues & Volume By Fish Type for the Period 2022-2032F
- Historical Data and Forecast of Tanzania Fish Market Revenues & Volume By Inland Fishes for the Period 2022-2032F
- Historical Data and Forecast of Tanzania Fish Market Revenues & Volume By Marine Fishes for the Period 2022-2032F
- Historical Data and Forecast of Tanzania Fish Market Revenues & Volume By Shrimps for the Period 2022-2032F
- Historical Data and Forecast of Tanzania Fish Market Revenues & Volume By Scampi for the Period 2022-2032F
- Historical Data and Forecast of Tanzania Fish Market Revenues & Volume By Product Type for the Period 2022-2032F
- Historical Data and Forecast of Tanzania Fish Market Revenues & Volume By Fresh for the Period 2022-2032F
- Historical Data and Forecast of Tanzania Fish Market Revenues & Volume By Frozen for the Period 2022-2032F
- Historical Data and Forecast of Tanzania Fish Market Revenues & Volume By Canned for the Period 2022-2032F
- Historical Data and Forecast of Tanzania Fish Market Revenues & Volume By Others for the Period 2022-2032F
- Historical Data and Forecast of Tanzania Fish Market Revenues & Volume By Distribution Channel for the Period 2022-2032F
- Historical Data and Forecast of Tanzania Fish Market Revenues & Volume By Retail for the Period 2022-2032F
- Historical Data and Forecast of Tanzania Fish Market Revenues & Volume By Institutional for the Period 2022-2032F
- Historical Data and Forecast of Tanzania Fish Market Revenues & Volume By Sector for the Period 2022-2032F
- Historical Data and Forecast of Tanzania Fish Market Revenues & Volume By Organised for the Period 2022-2032F
- Historical Data and Forecast of Tanzania Fish Market Revenues & Volume By Unorganised for the Period 2022-2032F
- Tanzania Fish Import Export Trade Statistics
- Market Opportunity Assessment By Fish Type
- Market Opportunity Assessment By Product Type
- Market Opportunity Assessment By Distribution Channel
- Market Opportunity Assessment By Sector
- Tanzania Fish Top Companies Market Share
- Tanzania Fish Competitive Benchmarking By Technical and Operational Parameters
- Tanzania Fish Company Profiles
- Tanzania Fish Key Strategic Recommendations






































