Tanzania Microbiological Testing Of Water Market (2026-2032) Outlook | Industry, Value, Companies, Trends, Share, Revenue, Size, Analysis, Forecast & Growth
Market Forecast By Pathogen Type (Legionella, Coliform, Salmonella, Vibrio, Clostridium, Others), By Water Type (Drinking & bottled water, Industrial water), By Type (Instruments, Test kits & reagents), By Industry Type (Pharmaceutical, Clinical, Food, Energy, Chemicals & material, Environmental) And Competitive Landscape
| Product Code: ETC333535 | Publication Date: Aug 2022 | Updated Date: Jul 2026 | Product Type: Market Research Report | |
| Publisher: 6Wresearch | Author: Shubham Padhi | No. of Pages: 75 | No. of Figures: 35 | No. of Tables: 20 |
Tanzania Microbiological Testing Of Water Market Size, Share & Growth Rate
The Tanzania Microbiological Testing Of Water Market was estimated at USD 351 Million in 2025 and is projected to reach USD 478 Million by 2032, growing at a CAGR of 4.5% from 2026 to 2032. This growth trajectory is primarily driven by a heightened awareness of public health concerns, regulatory compliance mandates, and increasing urbanization. The rising industrial activities and agricultural runoff further amplify the demand for reliable water testing services, critical for safeguarding community health.
Tanzania Microbiological Testing Of Water Market Year-wise Growth Rate and Key Drivers
This graph highlights how the Tanzania Microbiological Testing Of Water Market has steadily grown over the years, supported by major growth factors.
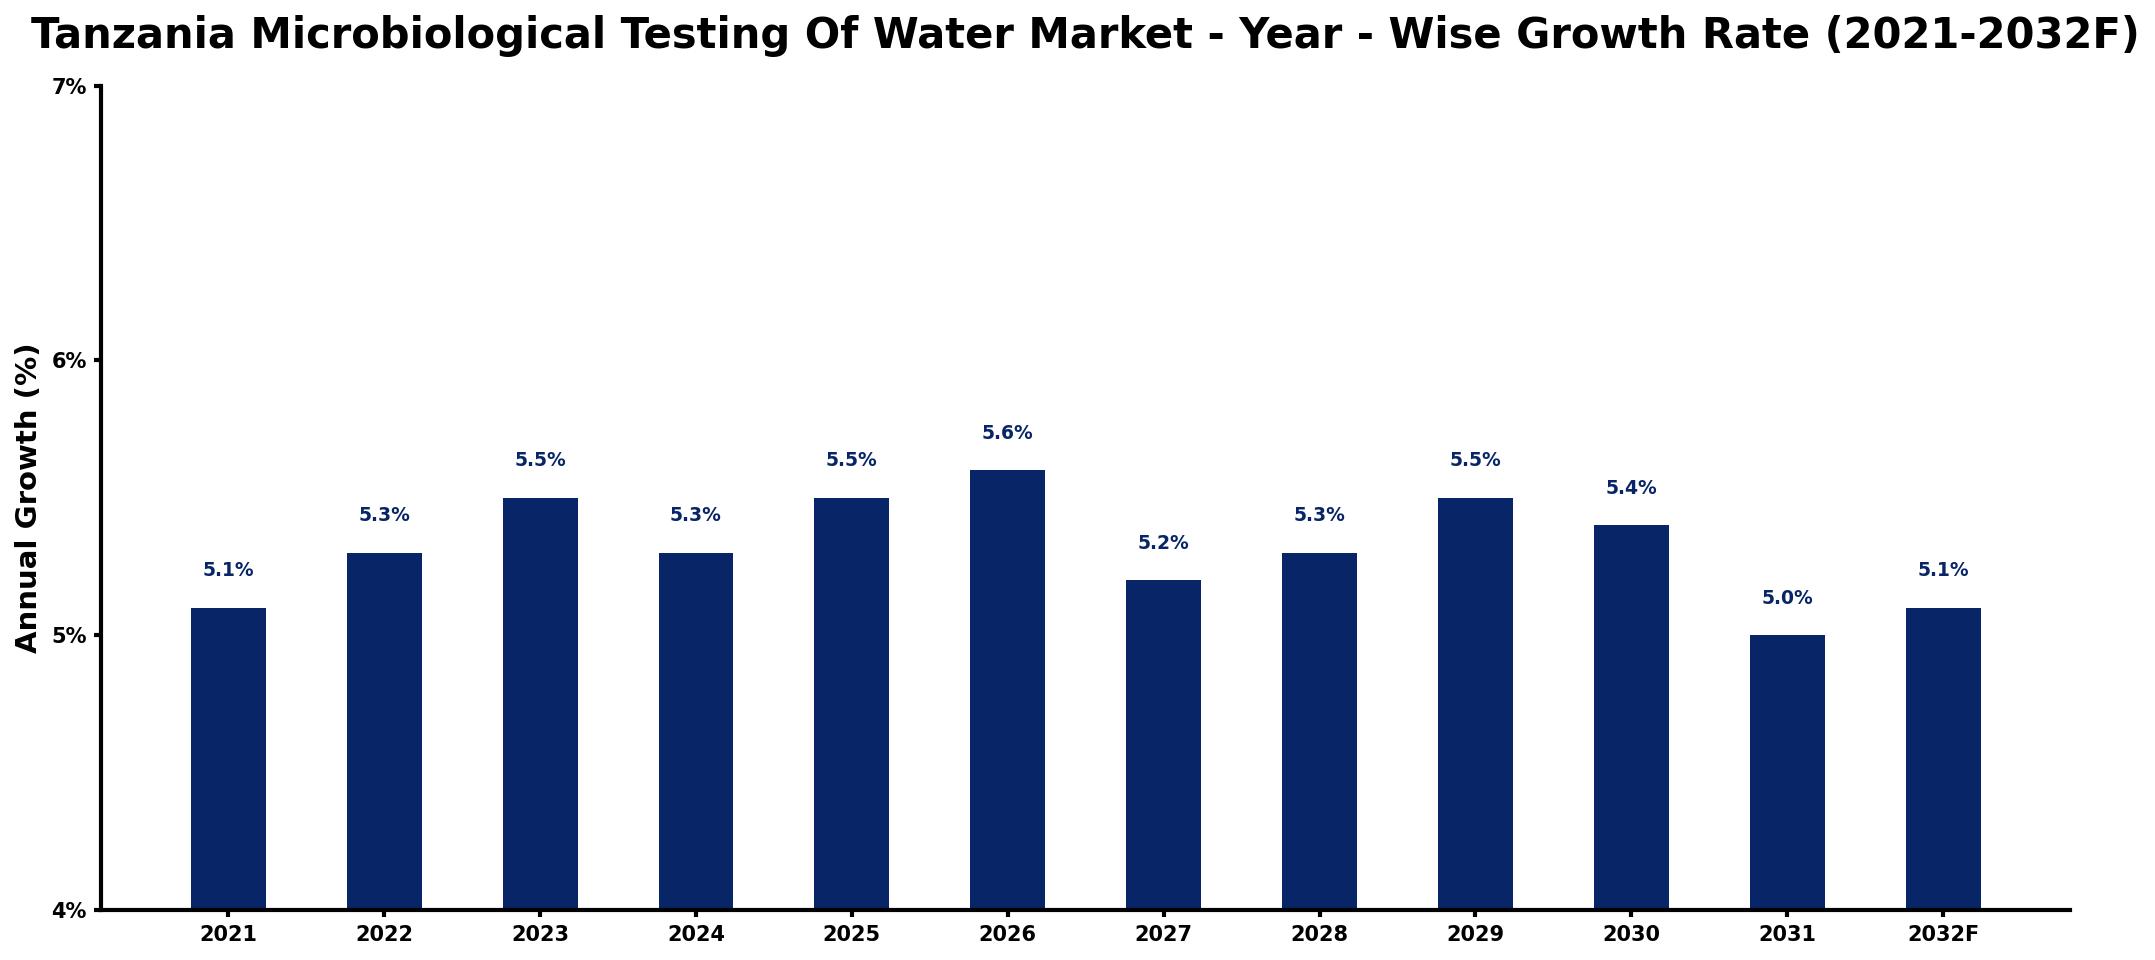
The table below presents the year‑wise growth rates along with the key drivers influencing the market
| Year | Growth Rate | Major Drivers |
| 2021 | 5.1% | Increase in public health awareness |
| 2022 | 5.3% | Growing industrial safety regulations |
| 2023 | 5.5% | Rising environmental protection initiatives |
| 2024 | 5.3% | Expansion of municipal infrastructure projects |
| 2025 | 5.5% | Increased foreign investments in health |
| 2026 | 5.6% | Strengthening of local health policies |
| 2027 | 5.2% | Emergence of new consumer standards |
| 2028 | 5.3% | Heightened focus on sustainability practices |
| 2029 | 5.5% | Wider adoption of safety certifications |
| 2030 | 5.4% | Enhanced research funding allocations |
| 2031 | 5.0% | Growing community engagement efforts |
| 2032 | 5.1% | Strengthening partnerships with NGOs |
Note: Market size estimations and growth projections presented in this report are based on 6Wresearch's proprietary forecasting methodology, utilizing the latest available industry data, government publications, and primary research inputs.
Tanzania Microbiological Testing Of Water Market Synopsis
Regulatory requirements are the strongest force shaping the Tanzania microbiological testing of water market. Compliance with health and environmental standards ensures that both drinking water and wastewater are monitored for microbial contaminants, directly impacting public safety and environmental quality.
Additionally, government initiatives aimed at enhancing water infrastructure and sanitation standards are crucial. These efforts promote not only compliance but also raise public awareness about waterborne diseases, further stimulating the market for testing services.
Tanzania Microbiological Testing Of Water Market Key Takeaways
- The market is characterized by a steady growth rate driven by public health awareness and regulatory requirements.
- Increased urbanization and industrialization are significant contributors to the rising demand for microbiological testing services.
- Government policies focus on enhancing testing standards and providing support for infrastructure development.
- Public awareness campaigns are essential for improving community engagement and compliance with water safety measures.
- Investment opportunities exist in advanced testing technologies and capacity building for local professionals.
Evaluation of Restraints in Tanzania Microbiological Testing Of Water Market
Despite the positive growth trajectory, several factors restrain the Tanzania microbiological testing of water market. A notable challenge is the limited access to advanced testing equipment, which can hinder the ability of laboratories to conduct comprehensive analyses. Furthermore, variability in the enforcement of water quality standards across regions creates inconsistencies in testing reliability. Public awareness regarding waterborne diseases remains low, which can limit demand for testing services, highlighting a need for educational initiatives.
Tanzania Microbiological Testing Of Water Market Trends
The market is witnessing a shift towards more advanced and automated testing technologies, allowing for quicker and more accurate results. There is also a growing trend towards integrated testing services that encompass both microbial and chemical analyses. Furthermore, collaborations between public and private sectors are becoming increasingly common to enhance testing capabilities and infrastructure development.
Tanzania Microbiological Testing Of Water Market Opportunities
Genuine growth opportunities lie in the expansion of testing services into rural areas, where access to clean water is still a significant issue. Investment in training programs for local technicians and partnerships with international organizations can enhance the skill set available within the country. Moreover, developing mobile testing units could greatly improve accessibility and responsiveness to water quality concerns in remote regions.
Government Initiatives in the Tanzania Microbiological Testing Of Water Market
The Tanzanian government prioritizes public health through stringent regulations that mandate the use of accredited laboratories for water testing. Policies are in place that encourage capacity building among water testing professionals, ensuring adherence to standardized protocols. Additionally, the government offers various incentives, such as equipment grants and certification subsidies, to support the expansion of water testing services nationwide, reinforcing its commitment to public health and sustainable water management.
Future Insights of the Tanzania Microbiological Testing Of Water Market
Looking towards 2026-2032, the Tanzania microbiological testing of water market is poised for continued growth, fueled by an ongoing commitment to improving water safety standards. With government initiatives and public awareness efforts gaining momentum, the market will likely experience increased investment in technological advancements. Furthermore, a greater emphasis on sustainable practices will drive innovation in testing methods, enhancing overall water quality management in the region.
Tanzania Microbiological Testing Of Water Market Latest Developments (2025 - 2026)
Recent developments indicate a stronger focus on the implementation of new water testing technologies, enabling faster and more efficient analysis of microbial contaminants. Collaborative efforts between local governments and NGOs are emerging to improve laboratory capacities and expand testing outreach in underserved areas. Furthermore, public health campaigns are intensifying, raising awareness about the importance of water quality testing as a critical component of community health.
Tanzania Microbiological Testing Of Water Market - Key Attractiveness of the Report
- 10 Years of Market Numbers
- Historical Data Starting from 2022 to 2025
- Base Year: 2025
- Forecast Data until 2032
- Key Performance Indicators Impacting the Market
- Major Upcoming Developments and Projects
Key Highlights of the Report:
- Tanzania Microbiological Testing Of Water Market Outlook
- Market Size of Tanzania Microbiological Testing Of Water Market, 2025
- Forecast of Tanzania Microbiological Testing Of Water Market, 2032
- Historical Data and Forecast of Tanzania Microbiological Testing Of Water Revenues & Volume for the Period 2022-2032F
- Tanzania Microbiological Testing Of Water Market Trend Evolution
- Tanzania Microbiological Testing Of Water Market Drivers and Challenges
- Tanzania Microbiological Testing Of Water Price Trends
- Tanzania Microbiological Testing Of Water Porter's Five Forces
- Tanzania Microbiological Testing Of Water Industry Life Cycle
- Historical Data and Forecast of Tanzania Microbiological Testing Of Water Market Revenues & Volume By Pathogen Type for the Period 2022-2032F
- Historical Data and Forecast of Tanzania Microbiological Testing Of Water Market Revenues & Volume By Legionella for the Period 2022-2032F
- Historical Data and Forecast of Tanzania Microbiological Testing Of Water Market Revenues & Volume By Coliform for the Period 2022-2032F
- Historical Data and Forecast of Tanzania Microbiological Testing Of Water Market Revenues & Volume By Salmonella for the Period 2022-2032F
- Historical Data and Forecast of Tanzania Microbiological Testing Of Water Market Revenues & Volume By Vibrio for the Period 2022-2032F
- Historical Data and Forecast of Tanzania Microbiological Testing Of Water Market Revenues & Volume By Clostridium for the Period 2022-2032F
- Historical Data and Forecast of Tanzania Microbiological Testing Of Water Market Revenues & Volume By Others for the Period 2022-2032F
- Historical Data and Forecast of Tanzania Microbiological Testing Of Water Market Revenues & Volume By Water Type for the Period 2022-2032F
- Historical Data and Forecast of Tanzania Microbiological Testing Of Water Market Revenues & Volume By Drinking & bottled water for the Period 2022-2032F
- Historical Data and Forecast of Tanzania Microbiological Testing Of Water Market Revenues & Volume By Industrial water for the Period 2022-2032F
- Historical Data and Forecast of Tanzania Microbiological Testing Of Water Market Revenues & Volume By Type for the Period 2022-2032F
- Historical Data and Forecast of Tanzania Microbiological Testing Of Water Market Revenues & Volume By Instruments for the Period 2022-2032F
- Historical Data and Forecast of Tanzania Microbiological Testing Of Water Market Revenues & Volume By Test kits & reagents for the Period 2022-2032F
- Historical Data and Forecast of Tanzania Microbiological Testing Of Water Market Revenues & Volume By Industry Type for the Period 2022-2032F
- Historical Data and Forecast of Tanzania Microbiological Testing Of Water Market Revenues & Volume By Pharmaceutical for the Period 2022-2032F
- Historical Data and Forecast of Tanzania Microbiological Testing Of Water Market Revenues & Volume By Clinical for the Period 2022-2032F
- Historical Data and Forecast of Tanzania Microbiological Testing Of Water Market Revenues & Volume By Food for the Period 2022-2032F
- Historical Data and Forecast of Tanzania Microbiological Testing Of Water Market Revenues & Volume By Energy for the Period 2022-2032F
- Historical Data and Forecast of Tanzania Microbiological Testing Of Water Market Revenues & Volume By Chemicals & material for the Period 2022-2032F
- Historical Data and Forecast of Tanzania Microbiological Testing Of Water Market Revenues & Volume By Environmental for the Period 2022-2032F
- Tanzania Microbiological Testing Of Water Import Export Trade Statistics
- Market Opportunity Assessment By Pathogen Type
- Market Opportunity Assessment By Water Type
- Market Opportunity Assessment By Type
- Market Opportunity Assessment By Industry Type
- Tanzania Microbiological Testing Of Water Top Companies Market Share
- Tanzania Microbiological Testing Of Water Competitive Benchmarking By Technical and Operational Parameters
- Tanzania Microbiological Testing Of Water Company Profiles
- Tanzania Microbiological Testing Of Water Key Strategic Recommendations
Frequently Asked Questions About the Market Study (FAQs):
The growth is driven largely by public health concerns, regulatory requirements, and the increasing demand for safe drinking water amidst urbanization and industrial activities.
The government promotes the use of accredited laboratories, provides training for testing professionals, and offers incentives such as grants for equipment to enhance testing capabilities.
The market is estimated at USD 351 Million in 2025 and is projected to reach USD 478 Million by 2032, with a CAGR of 4.5% from 2026 to 2032.
Current trends include the adoption of automated testing methods and integrated services that combine both microbial and chemical analyses for comprehensive assessments.
Investment in mobile testing units and partnerships with local communities can significantly enhance access and responsiveness to water quality concerns in rural regions.
6Wresearch actively monitors the Tanzania Microbiological Testing Of Water Market and publishes its comprehensive annual report, highlighting emerging trends, growth drivers, revenue analysis, and forecast outlook. Our insights help businesses to make data-backed strategic decisions with ongoing market dynamics. Our analysts track relevent industries related to the Tanzania Microbiological Testing Of Water Market, allowing our clients with actionable intelligence and reliable forecasts tailored to emerging regional needs.
Yes, we provide customisation as per your requirements. To learn more, feel free to contact us on sales@6wresearch.com
1 Executive Summary |
2 Introduction |
2.1 Key Highlights of the Report |
2.2 Report Description |
2.3 Market Scope & Segmentation |
2.4 Research Methodology |
2.5 Assumptions |
3 Tanzania Microbiological Testing Of Water Market Overview |
3.1 Tanzania Country Macro Economic Indicators |
3.2 Tanzania Microbiological Testing Of Water Market Revenues & Volume, 2022 & 2032F |
3.3 Tanzania Microbiological Testing Of Water Market - Industry Life Cycle |
3.4 Tanzania Microbiological Testing Of Water Market - Porter's Five Forces |
3.5 Tanzania Microbiological Testing Of Water Market Revenues & Volume Share, By Pathogen Type, 2022 & 2032F |
3.6 Tanzania Microbiological Testing Of Water Market Revenues & Volume Share, By Water Type, 2022 & 2032F |
3.7 Tanzania Microbiological Testing Of Water Market Revenues & Volume Share, By Type, 2022 & 2032F |
3.8 Tanzania Microbiological Testing Of Water Market Revenues & Volume Share, By Industry Type, 2022 & 2032F |
4 Tanzania Microbiological Testing Of Water Market Dynamics |
4.1 Impact Analysis |
4.2 Market Drivers |
4.2.1 Increasing awareness about waterborne diseases and the importance of safe drinking water. |
4.2.2 Stringent regulations and standards set by government authorities for water quality testing. |
4.2.3 Growing investments in infrastructure development leading to increased demand for water testing services. |
4.3 Market Restraints |
4.3.1 Lack of skilled professionals and expertise in microbiological testing. |
4.3.2 High costs associated with setting up microbiological testing facilities. |
4.3.3 Limited access to advanced technology and equipment for water testing. |
5 Tanzania Microbiological Testing Of Water Market Trends |
6 Tanzania Microbiological Testing Of Water Market, By Types |
6.1 Tanzania Microbiological Testing Of Water Market, By Pathogen Type |
6.1.1 Overview and Analysis |
6.1.2 Tanzania Microbiological Testing Of Water Market Revenues & Volume, By Pathogen Type, 2022-2032F |
6.1.3 Tanzania Microbiological Testing Of Water Market Revenues & Volume, By Legionella, 2022-2032F |
6.1.4 Tanzania Microbiological Testing Of Water Market Revenues & Volume, By Coliform, 2022-2032F |
6.1.5 Tanzania Microbiological Testing Of Water Market Revenues & Volume, By Salmonella, 2022-2032F |
6.1.6 Tanzania Microbiological Testing Of Water Market Revenues & Volume, By Vibrio, 2022-2032F |
6.1.7 Tanzania Microbiological Testing Of Water Market Revenues & Volume, By Clostridium, 2022-2032F |
6.1.8 Tanzania Microbiological Testing Of Water Market Revenues & Volume, By Others, 2022-2032F |
6.2 Tanzania Microbiological Testing Of Water Market, By Water Type |
6.2.1 Overview and Analysis |
6.2.2 Tanzania Microbiological Testing Of Water Market Revenues & Volume, By Drinking & bottled water, 2022-2032F |
6.2.3 Tanzania Microbiological Testing Of Water Market Revenues & Volume, By Industrial water, 2022-2032F |
6.3 Tanzania Microbiological Testing Of Water Market, By Type |
6.3.1 Overview and Analysis |
6.3.2 Tanzania Microbiological Testing Of Water Market Revenues & Volume, By Instruments, 2022-2032F |
6.3.3 Tanzania Microbiological Testing Of Water Market Revenues & Volume, By Test kits & reagents, 2022-2032F |
6.4 Tanzania Microbiological Testing Of Water Market, By Industry Type |
6.4.1 Overview and Analysis |
6.4.2 Tanzania Microbiological Testing Of Water Market Revenues & Volume, By Pharmaceutical, 2022-2032F |
6.4.3 Tanzania Microbiological Testing Of Water Market Revenues & Volume, By Clinical, 2022-2032F |
6.4.4 Tanzania Microbiological Testing Of Water Market Revenues & Volume, By Food, 2022-2032F |
6.4.5 Tanzania Microbiological Testing Of Water Market Revenues & Volume, By Energy, 2022-2032F |
6.4.6 Tanzania Microbiological Testing Of Water Market Revenues & Volume, By Chemicals & material, 2022-2032F |
6.4.7 Tanzania Microbiological Testing Of Water Market Revenues & Volume, By Environmental, 2022-2032F |
7 Tanzania Microbiological Testing Of Water Market Import-Export Trade Statistics |
7.1 Tanzania Microbiological Testing Of Water Market Export to Major Countries |
7.2 Tanzania Microbiological Testing Of Water Market Imports from Major Countries |
8 Tanzania Microbiological Testing Of Water Market Key Performance Indicators |
8.1 Percentage increase in the number of water testing facilities across Tanzania. |
8.2 Number of new regulations or standards introduced by government authorities related to water quality testing. |
8.3 Percentage growth in the adoption of automated water testing equipment in the market. |
9 Tanzania Microbiological Testing Of Water Market - Opportunity Assessment |
9.1 Tanzania Microbiological Testing Of Water Market Opportunity Assessment, By Pathogen Type, 2022 & 2032F |
9.2 Tanzania Microbiological Testing Of Water Market Opportunity Assessment, By Water Type, 2022 & 2032F |
9.3 Tanzania Microbiological Testing Of Water Market Opportunity Assessment, By Type, 2022 & 2032F |
9.4 Tanzania Microbiological Testing Of Water Market Opportunity Assessment, By Industry Type, 2022 & 2032F |
10 Tanzania Microbiological Testing Of Water Market - Competitive Landscape |
10.1 Tanzania Microbiological Testing Of Water Market Revenue Share, By Companies, 2025 |
10.2 Tanzania Microbiological Testing Of Water Market Competitive Benchmarking, By Operating and Technical Parameters |
11 Company Profiles |
12 Recommendations |
13 Disclaimer |
Global Go To Market Strategy - 2030
Export potential enables firms to identify high-growth global markets with greater confidence by combining advanced trade intelligence with a structured quantitative methodology. The framework analyzes emerging demand trends and country-level import patterns while integrating macroeconomic and trade datasets such as GDP and population forecasts, bilateral import–export flows, tariff structures, elasticity differentials between developed and developing economies, geographic distance, and import demand projections. Using weighted trade values from 2020–2024 as the base period to project country-to-country export potential for 2030, these inputs are operationalized through calculated drivers such as gravity model parameters, tariff impact factors, and projected GDP per-capita growth. Through an analysis of hidden potentials, demand hotspots, and market conditions that are most favorable to success, this method enables firms to focus on target countries, maximize returns, and global expansion with data, backed by accuracy.
By factoring in the projected importer demand gap that is currently unmet and could be potential opportunity, it identifies the potential for the Exporter (Country) among 190 countries, against the general trade analysis, which identifies the biggest importer or exporter.
To discover high-growth global markets and optimize your business strategy:
Click Here
Pricing
- Single User License$ 1,995
- Department License$ 2,400
- Site License$ 3,120
- Global License$ 3,795

Leadership Perspectives from Industry Events
Search
Thought Leadership and Analyst Meet


Our Clients
6WResearch In News
- India Air Conditioner Market Set for Strong Rebound in 2026 After Weather-Led Correction and GST-Driven Recovery: 6Wresearch
- ADAS in India: How Automatic Emergency Braking, Blind Spot Detection & Driver Monitoring are Transforming Road Safety
- Doha a strategic location for EV manufacturing hub: IPA Qatar
- Demand for luxury TVs surging in the GCC, says Samsung
- Empowering Growth: The Thriving Journey of Bangladesh’s Cable Industry
- Demand for luxury TVs surging in the GCC, says Samsung
Latest Reports
- Nicaragua RPG Gaming Market (2026-2032)
- New Zealand RPG Gaming Market (2026-2032)
- Netherlands RPG Gaming Market (2026-2032)
- Nauru RPG Gaming Market (2026-2032)
- Namibia RPG Gaming Market (2026-2032)
- Mozambique RPG Gaming Market (2026-2032)
- Montenegro RPG Gaming Market (2026-2032)
- Mongolia RPG Gaming Market (2026-2032)
- Monaco RPG Gaming Market (2026-2032)
- Micronesia RPG Gaming Market (2026-2032)
Industry Events and Analyst Meet

EV India Expo 2026

HIMTEX 2026

India Refining Summit 2026

India EV Show 2026

EV tech India Expo 2026
Whitepaper
- Middle East & Africa Commercial Security Market Click here to view more.
- Middle East & Africa Fire Safety Systems & Equipment Market Click here to view more.
- GCC Drone Market Click here to view more.
- Middle East Lighting Fixture Market Click here to view more.
- GCC Physical & Perimeter Security Market Click here to view more.