Tanzania Mortar Market (2026-2032) | Industry, Revenue, Share, Size, Forecast, Outlook, Growth, Analysis, Trends, Companies & Value
Market Forecast By Type (Wet Mixed Mortar, Dry Mortar), By Application (Construction Industry, Home Decoration Industry, Others) And Competitive Landscape
| Product Code: ETC042575 | Publication Date: Jan 2021 | Updated Date: Jun 2026 | Product Type: Report | |
| Publisher: 6Wresearch | Author: Ravi Bhandari | No. of Pages: 70 | No. of Figures: 35 | No. of Tables: 5 |
Tanzania Mortar Market Summary
The tanzania mortar market was estimated at USD 472 Million in 2025 and is projected to reach USD 629 Million by 2032, growing at a CAGR of 5.0% from 2026 to 2032.
Tanzania Mortar Market Year-wise Growth Rate and Key Drivers
This graph highlights how the Tanzania Mortar Market has steadily grown over the past five years, supported by major growth factors.
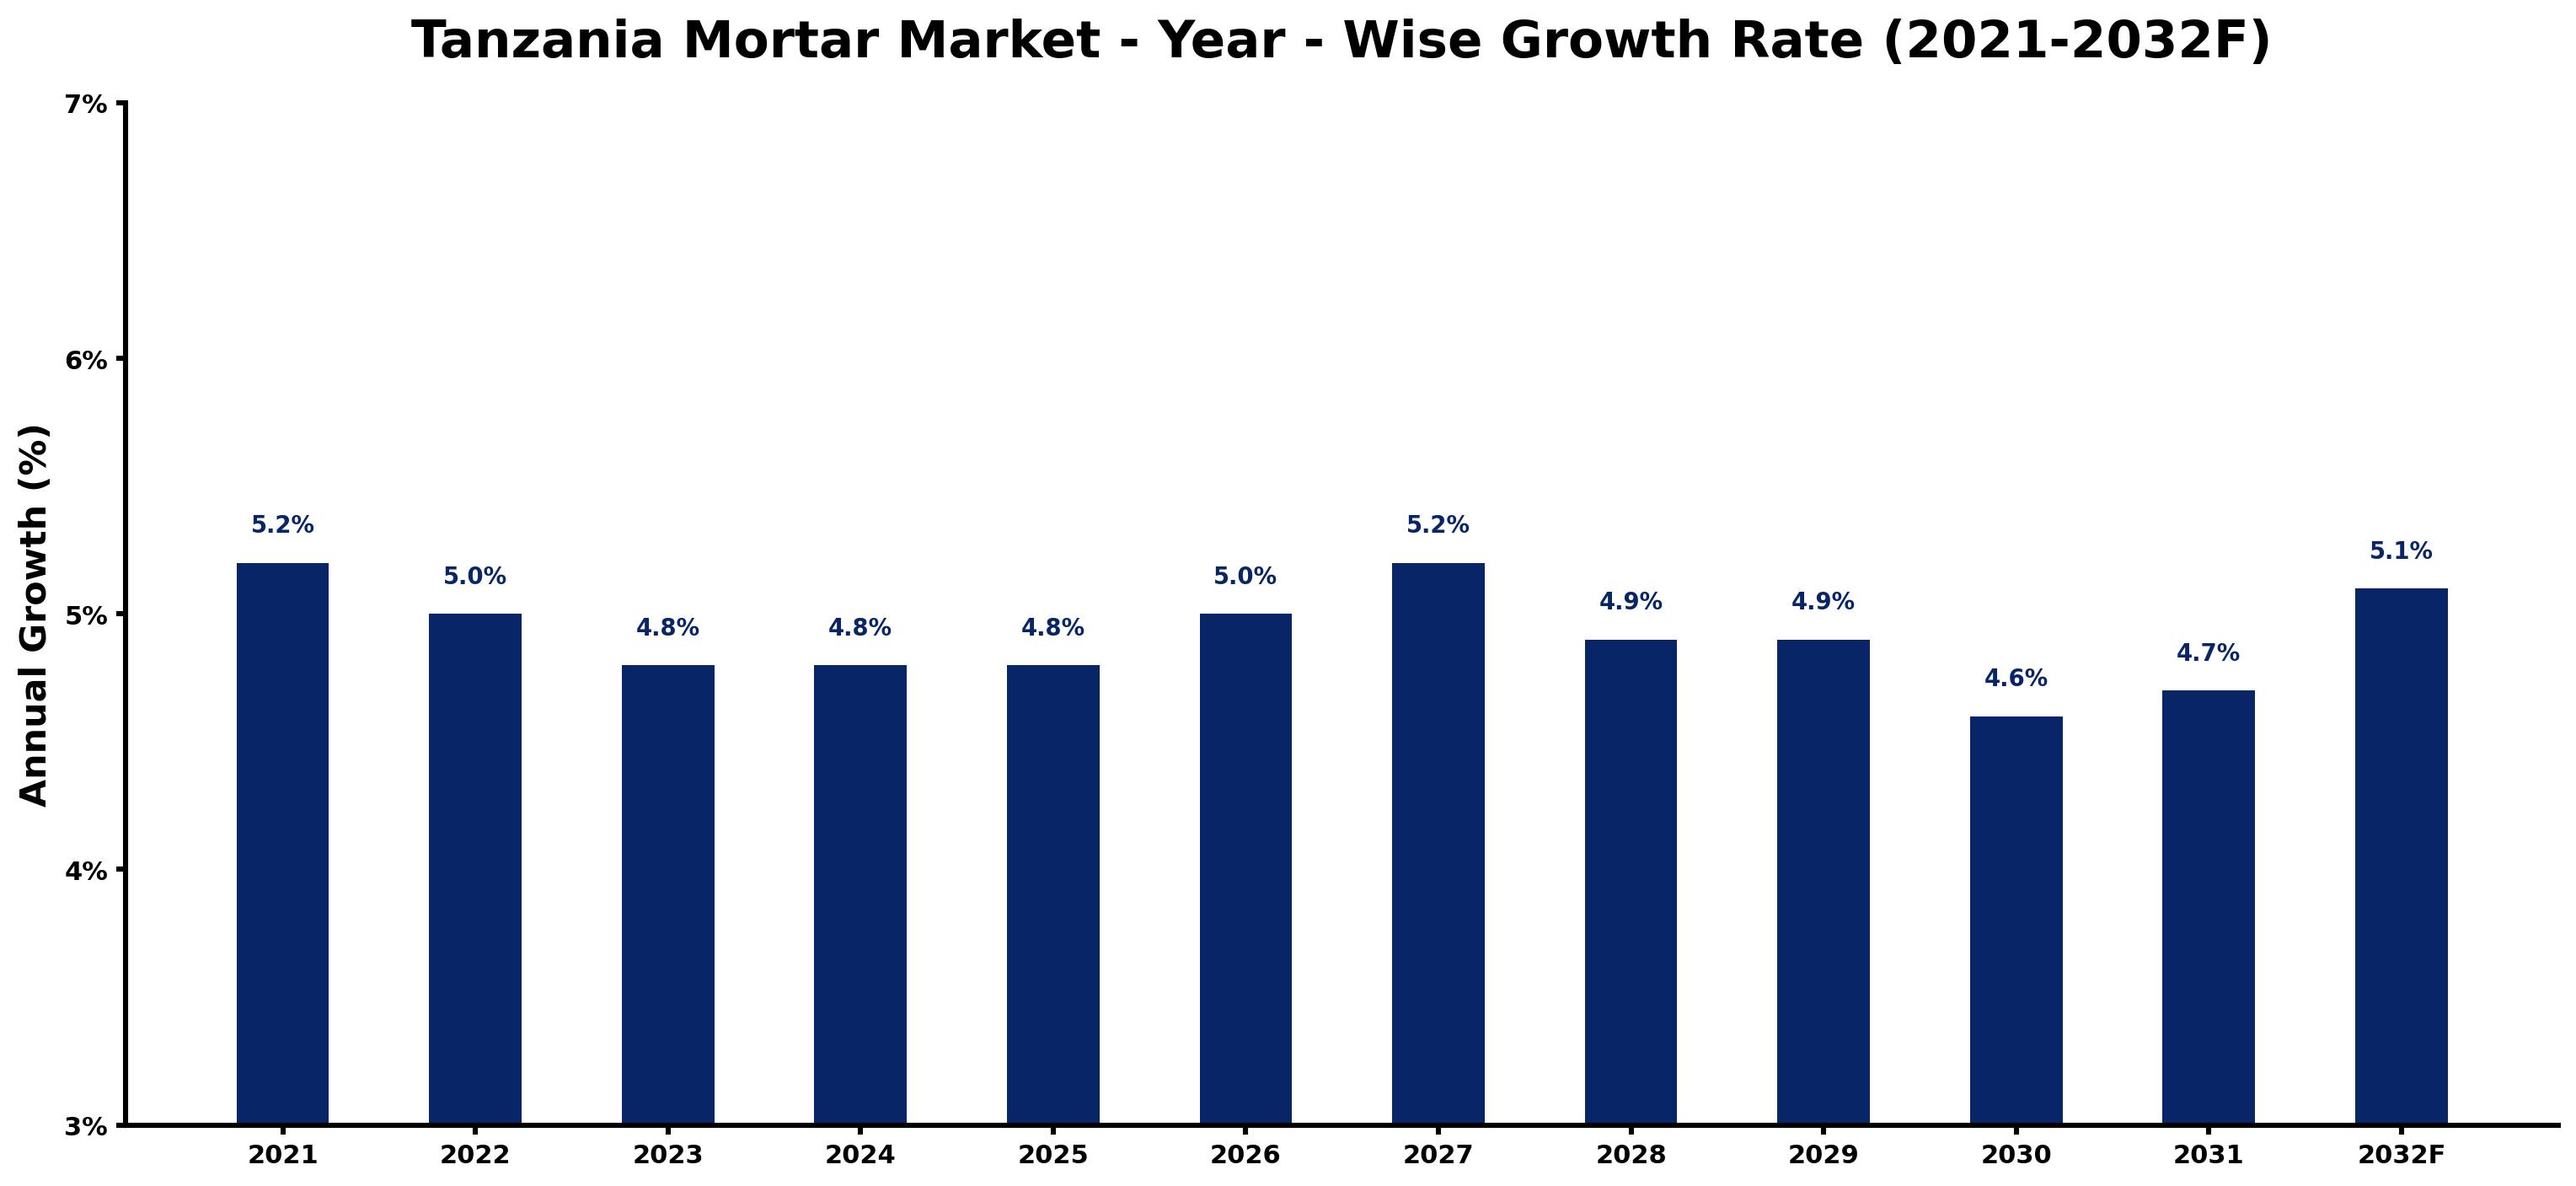
The table below presents the year wise growth rates along with the key drivers influencing the market
| Year | Growth Rate | Major Drivers |
| 2021 | 5.2% | Infrastructure projects are setting the stage for increased mortar consumption in Tanzania. |
| 2022 | 5.0% | Construction activities surge as urbanization trends reshape Tanzania's city landscapes. |
| 2023 | 4.8% | Investment in affordable housing initiatives boosts demand for durable mortar solutions. |
| 2024 | 4.8% | The local industry adapts to match international standards for construction materials. |
| 2025 | 4.8% | Emerging construction firms prioritize quality materials, enhancing customer trust in mortars. |
| 2026 | 5.0% | Tanzania's economic growth encourages private investments in real estate and infrastructure. |
| 2027 | 5.2% | Rural development projects stimulate increases in mortar utilization across various regions. |
| 2028 | 4.9% | Sustainability trends lead to innovations in eco-friendly mortar formulations and applications. |
| 2029 | 4.9% | Technological improvements in production processes enhance mortar quality and affordability. |
| 2030 | 4.6% | Trade partnerships unlock new markets, diversifying sources for mortar materials. |
| 2031 | 4.7% | Consumer awareness of building materials influences preferences towards high-performance mortars. |
| 2032 | 5.1% | International construction standards create demand for specialized mortars in major projects. |
Note - Market size estimations and growth projections presented in this report are based on 6Wresearch's advanced forecasting approach, validated with industry datasets as of June 2026.
Tanzania Mortar Market Synopsis
The Tanzania Mortar Market is projected to reach 5.0% and witness significant growth during the forecast period (2026-2032). Driven by a surge in construction activities and a concerted effort towards urbanization and infrastructure development, this market is positioned for a robust expansion. Mortar, integral to the construction sector, serves as a bonding agent for bricks and stones, underlining its essential role in building projects. The market's landscape features a diverse range of mortar types, including cement mortar and lime mortar, tailored to accommodate various construction requirements.
Tanzania Mortar Market Growth Drivers
The growth trajectory of the Tanzania Mortar Market is influenced by multiple factors:
- Increasing urbanization is leading to higher demand for residential and commercial buildings, thereby escalating the need for quality mortar products.
- Government initiatives aimed at improving national infrastructure are providing a significant push to construction activities, which in turn fuels mortar consumption.
- The construction industry's shift towards modern building techniques is inspiring the use of innovative and efficient mortar solutions.
- Enhancements in supply chain logistics are making mortar products more accessible to a wider range of construction projects.
- Growing emphasis on durable and sustainable building materials is prompting a shift toward advanced mortar formulations that meet environmental standards.
Tanzania Mortar Market Trends and Opportunities
The Tanzania Mortar Market is currently witnessing several notable trends:
- A rising preference for ready-to-use mortar products is evident, driven by their convenience and the time-saving benefits they offer to construction projects.
- Eco-friendly mortar solutions are gaining traction as both consumers and contractors prioritize sustainable construction practices.
- Customization in mortar products is becoming increasingly important as diverse construction needs emerge, prompting innovation among manufacturers.
- The market is seeing advancements in technology that enhance the performance characteristics of mortar, leading to improved durability and efficiency.
- Strategic partnerships with local construction stakeholders are presenting opportunities to provide tailored mortar solutions specific to project requirements.
Tanzania Mortar Market Challenges and Restraints
Despite the favorable outlook, the Tanzania Mortar Market faces several challenges:
- The inconsistent quality of mortar products due to the lack of standardized quality control measures poses a significant concern for construction professionals.
- Limited access to raw materials can lead to supply chain interruptions, ultimately affecting production schedules and pricing stability.
- Competition from alternative building materials is increasing, challenging the traditional mortar market and requiring innovation to maintain market share.
- Regulatory barriers can complicate market entry for new players, necessitating comprehensive knowledge of local policies and standards.
- Fluctuating costs of raw materials can impact pricing strategies, making it difficult for companies to maintain competitive pricing while ensuring quality.
Tanzania Mortar Market Investment Opportunities
Investment avenues within the Tanzania Mortar Market are becoming increasingly appealing:
- As the construction sector flourishes, there is a growing demand for specialized mortar products, which investors can capitalize on.
- Opportunities lie in the development of innovative mortar solutions that address specific construction challenges, like fast-setting formulations.
- Establishing collaborations with local construction firms to provide bespoke products can lead to a competitive advantage in the market.
- Investing in sustainable and eco-friendly mortar production can attract environmentally conscious consumers and projects.
- Infrastructure development funding from governmental and international sources presents additional opportunities for growth in this sector.
Tanzania Mortar Market Government Investment and Initiatives
The Tanzanian government is actively involved in shaping the mortar market through several strategic initiatives:
- The enforcement of quality standards for mortar production ensures that only reliable products are available for construction projects, enhancing safety.
- Government policies encouraging local manufacturing of building materials seek to reduce reliance on imports, promoting domestic economic growth.
- Public investment in infrastructure projects has a direct positive impact on the demand for quality mortar, stimulating market growth.
- Incentives for businesses that adhere to environmental standards help align market practices with global sustainability goals.
- Efforts to improve training and skill development for workers in the construction sector enhance the overall quality of construction services, indirectly benefiting the mortar market.
Tanzania Mortar Market Latest Developments (May 2025 - June 2026)
Recent developments within the Tanzania Mortar Market indicate a dynamic phase for the construction industry:
- Increased governmental focus on housing projects has led to a spike in the demand for mortar products, reinforcing market growth potentials.
- Innovative mortar formulations introduced by various manufacturers reflect a stronger commitment to sustainability and performance improvement.
- Collaborations between material producers and construction companies have intensified, facilitating tailored solutions that meet specific project needs.
- The market has seen a gradual shift towards automation in mortar production processes, enhancing efficiency and reducing labor costs.
- Regulatory bodies have intensified inspections and enforcement of quality standards, ensuring improvements in product offerings across the market.
Tanzania Mortar Market - Key Attractiveness of the Report
- 10 Years of Market Numbers
- Historical Data Starting from 2022 to 2025
- Base Year: 2025
- Forecast Data until 2032
- Key Performance Indicators Impacting the Market
- Major Upcoming Developments and Projects
Key Highlights of the Report:
- Tanzania Mortar Market Outlook
- Market Size of Tanzania Mortar Market, 2025
- Forecast of Tanzania Mortar Market, 2032F
- Historical Data and Forecast of Tanzania Mortar Revenues & Volume for the Period 2022-2032F
- Tanzania Mortar Market Trend Evolution
- Tanzania Mortar Market Drivers and Challenges
- Tanzania Mortar Price Trends
- Tanzania Mortar Porter's Five Forces
- Tanzania Mortar Industry Life Cycle
- Historical Data and Forecast of Tanzania Mortar Market Revenues & Volume By Type for the Period 2022-2032F
- Historical Data and Forecast of Tanzania Mortar Market Revenues & Volume By Wet Mixed Mortar for the Period 2022-2032F
- Historical Data and Forecast of Tanzania Mortar Market Revenues & Volume By Dry Mortar for the Period 2022-2032F
- Historical Data and Forecast of Tanzania Mortar Market Revenues & Volume By Application for the Period 2022-2032F
- Historical Data and Forecast of Tanzania Mortar Market Revenues & Volume By Construction Industry for the Period 2022-2032F
- Historical Data and Forecast of Tanzania Mortar Market Revenues & Volume By Home Decoration Industry for the Period 2022-2032F
- Historical Data and Forecast of Tanzania Mortar Market Revenues & Volume By Others for the Period 2022-2032F
- Tanzania Mortar Import Export Trade Statistics
- Market Opportunity Assessment By Type
- Market Opportunity Assessment By Application
- Tanzania Mortar Top Companies Market Share
- Tanzania Mortar Competitive Benchmarking By Technical and Operational Parameters
- Tanzania Mortar Company Profiles
- Tanzania Mortar Key Strategic Recommendations
Frequently Asked Questions About the Market Study (FAQs):
The growth is primarily driven by urbanization, government infrastructure initiatives, and a shift towards modern construction practices.
Cement mortar and lime mortar are the most commonly used types, each serving different construction needs.
The government is enforcing quality standards, promoting local production, and investing in infrastructure upgrades to bolster the market.
Key challenges include inconsistent quality control, supply chain disruptions, and competition from alternative materials.
6Wresearch actively monitors the Tanzania Mortar Market and publishes its comprehensive annual report, highlighting emerging trends, growth drivers, revenue analysis, and forecast outlook. Our insights help businesses to make data-backed strategic decisions with ongoing market dynamics. Our analysts track relevent industries related to the Tanzania Mortar Market, allowing our clients with actionable intelligence and reliable forecasts tailored to emerging regional needs.
Yes, we provide customisation as per your requirements. To learn more, feel free to contact us on sales@6wresearch.com
1 Executive Summary |
2 Introduction |
2.1 Key Highlights of the Report |
2.2 Report Description |
2.3 Market Scope & Segmentation |
2.4 Research Methodology |
2.5 Assumptions |
3 Tanzania Mortar Market Overview |
3.1 Tanzania Country Macro Economic Indicators |
3.2 Tanzania Mortar Market Revenues & Volume, 2022 & 2032F |
3.3 Tanzania Mortar Market - Industry Life Cycle |
3.4 Tanzania Mortar Market - Porter's Five Forces |
3.5 Tanzania Mortar Market Revenues & Volume Share, By Type, 2022 & 2032F |
3.6 Tanzania Mortar Market Revenues & Volume Share, By Application, 2022 & 2032F |
4 Tanzania Mortar Market Dynamics |
4.1 Impact Analysis |
4.2 Market Drivers |
4.3 Market Restraints |
5 Tanzania Mortar Market Trends |
6 Tanzania Mortar Market, By Types |
6.1 Tanzania Mortar Market, By Type |
6.1.1 Overview and Analysis |
6.1.2 Tanzania Mortar Market Revenues & Volume, By Type, 2022-2032F |
6.1.3 Tanzania Mortar Market Revenues & Volume, By Wet Mixed Mortar, 2022-2032F |
6.1.4 Tanzania Mortar Market Revenues & Volume, By Dry Mortar, 2022-2032F |
6.2 Tanzania Mortar Market, By Application |
6.2.1 Overview and Analysis |
6.2.2 Tanzania Mortar Market Revenues & Volume, By Construction Industry, 2022-2032F |
6.2.3 Tanzania Mortar Market Revenues & Volume, By Home Decoration Industry, 2022-2032F |
6.2.4 Tanzania Mortar Market Revenues & Volume, By Others, 2022-2032F |
7 Tanzania Mortar Market Import-Export Trade Statistics |
7.1 Tanzania Mortar Market Export to Major Countries |
7.2 Tanzania Mortar Market Imports from Major Countries |
8 Tanzania Mortar Market Key Performance Indicators |
9 Tanzania Mortar Market - Opportunity Assessment |
9.1 Tanzania Mortar Market Opportunity Assessment, By Type, 2022 & 2032F |
9.2 Tanzania Mortar Market Opportunity Assessment, By Application, 2022 & 2032F |
10 Tanzania Mortar Market - Competitive Landscape |
10.1 Tanzania Mortar Market Revenue Share, By Companies, 2025 |
10.2 Tanzania Mortar Market Competitive Benchmarking, By Operating and Technical Parameters |
11 Company Profiles |
12 Recommendations |
13 Disclaimer |
Global Go To Market Strategy - 2030
Export potential enables firms to identify high-growth global markets with greater confidence by combining advanced trade intelligence with a structured quantitative methodology. The framework analyzes emerging demand trends and country-level import patterns while integrating macroeconomic and trade datasets such as GDP and population forecasts, bilateral import–export flows, tariff structures, elasticity differentials between developed and developing economies, geographic distance, and import demand projections. Using weighted trade values from 2020–2024 as the base period to project country-to-country export potential for 2030, these inputs are operationalized through calculated drivers such as gravity model parameters, tariff impact factors, and projected GDP per-capita growth. Through an analysis of hidden potentials, demand hotspots, and market conditions that are most favorable to success, this method enables firms to focus on target countries, maximize returns, and global expansion with data, backed by accuracy.
By factoring in the projected importer demand gap that is currently unmet and could be potential opportunity, it identifies the potential for the Exporter (Country) among 190 countries, against the general trade analysis, which identifies the biggest importer or exporter.
To discover high-growth global markets and optimize your business strategy:
Click Here
Pricing
- Single User License$ 1,995
- Department License$ 2,400
- Site License$ 3,120
- Global License$ 3,795

Leadership Perspectives from Industry Events
Search
Thought Leadership and Analyst Meet


Our Clients
6WResearch In News
- India Air Conditioner Market Set for Strong Rebound in 2026 After Weather-Led Correction and GST-Driven Recovery: 6Wresearch
- ADAS in India: How Automatic Emergency Braking, Blind Spot Detection & Driver Monitoring are Transforming Road Safety
- Doha a strategic location for EV manufacturing hub: IPA Qatar
- Demand for luxury TVs surging in the GCC, says Samsung
- Empowering Growth: The Thriving Journey of Bangladesh’s Cable Industry
- Demand for luxury TVs surging in the GCC, says Samsung
Latest Reports
- Nicaragua RPG Gaming Market (2026-2032)
- New Zealand RPG Gaming Market (2026-2032)
- Netherlands RPG Gaming Market (2026-2032)
- Nauru RPG Gaming Market (2026-2032)
- Namibia RPG Gaming Market (2026-2032)
- Mozambique RPG Gaming Market (2026-2032)
- Montenegro RPG Gaming Market (2026-2032)
- Mongolia RPG Gaming Market (2026-2032)
- Monaco RPG Gaming Market (2026-2032)
- Micronesia RPG Gaming Market (2026-2032)
Industry Events and Analyst Meet

EV India Expo 2026

HIMTEX 2026

India Refining Summit 2026

India EV Show 2026

EV tech India Expo 2026
Whitepaper
- Middle East & Africa Commercial Security Market Click here to view more.
- Middle East & Africa Fire Safety Systems & Equipment Market Click here to view more.
- GCC Drone Market Click here to view more.
- Middle East Lighting Fixture Market Click here to view more.
- GCC Physical & Perimeter Security Market Click here to view more.