Thailand Nonmetallic Mineral Product Market: Import Trend Analysis
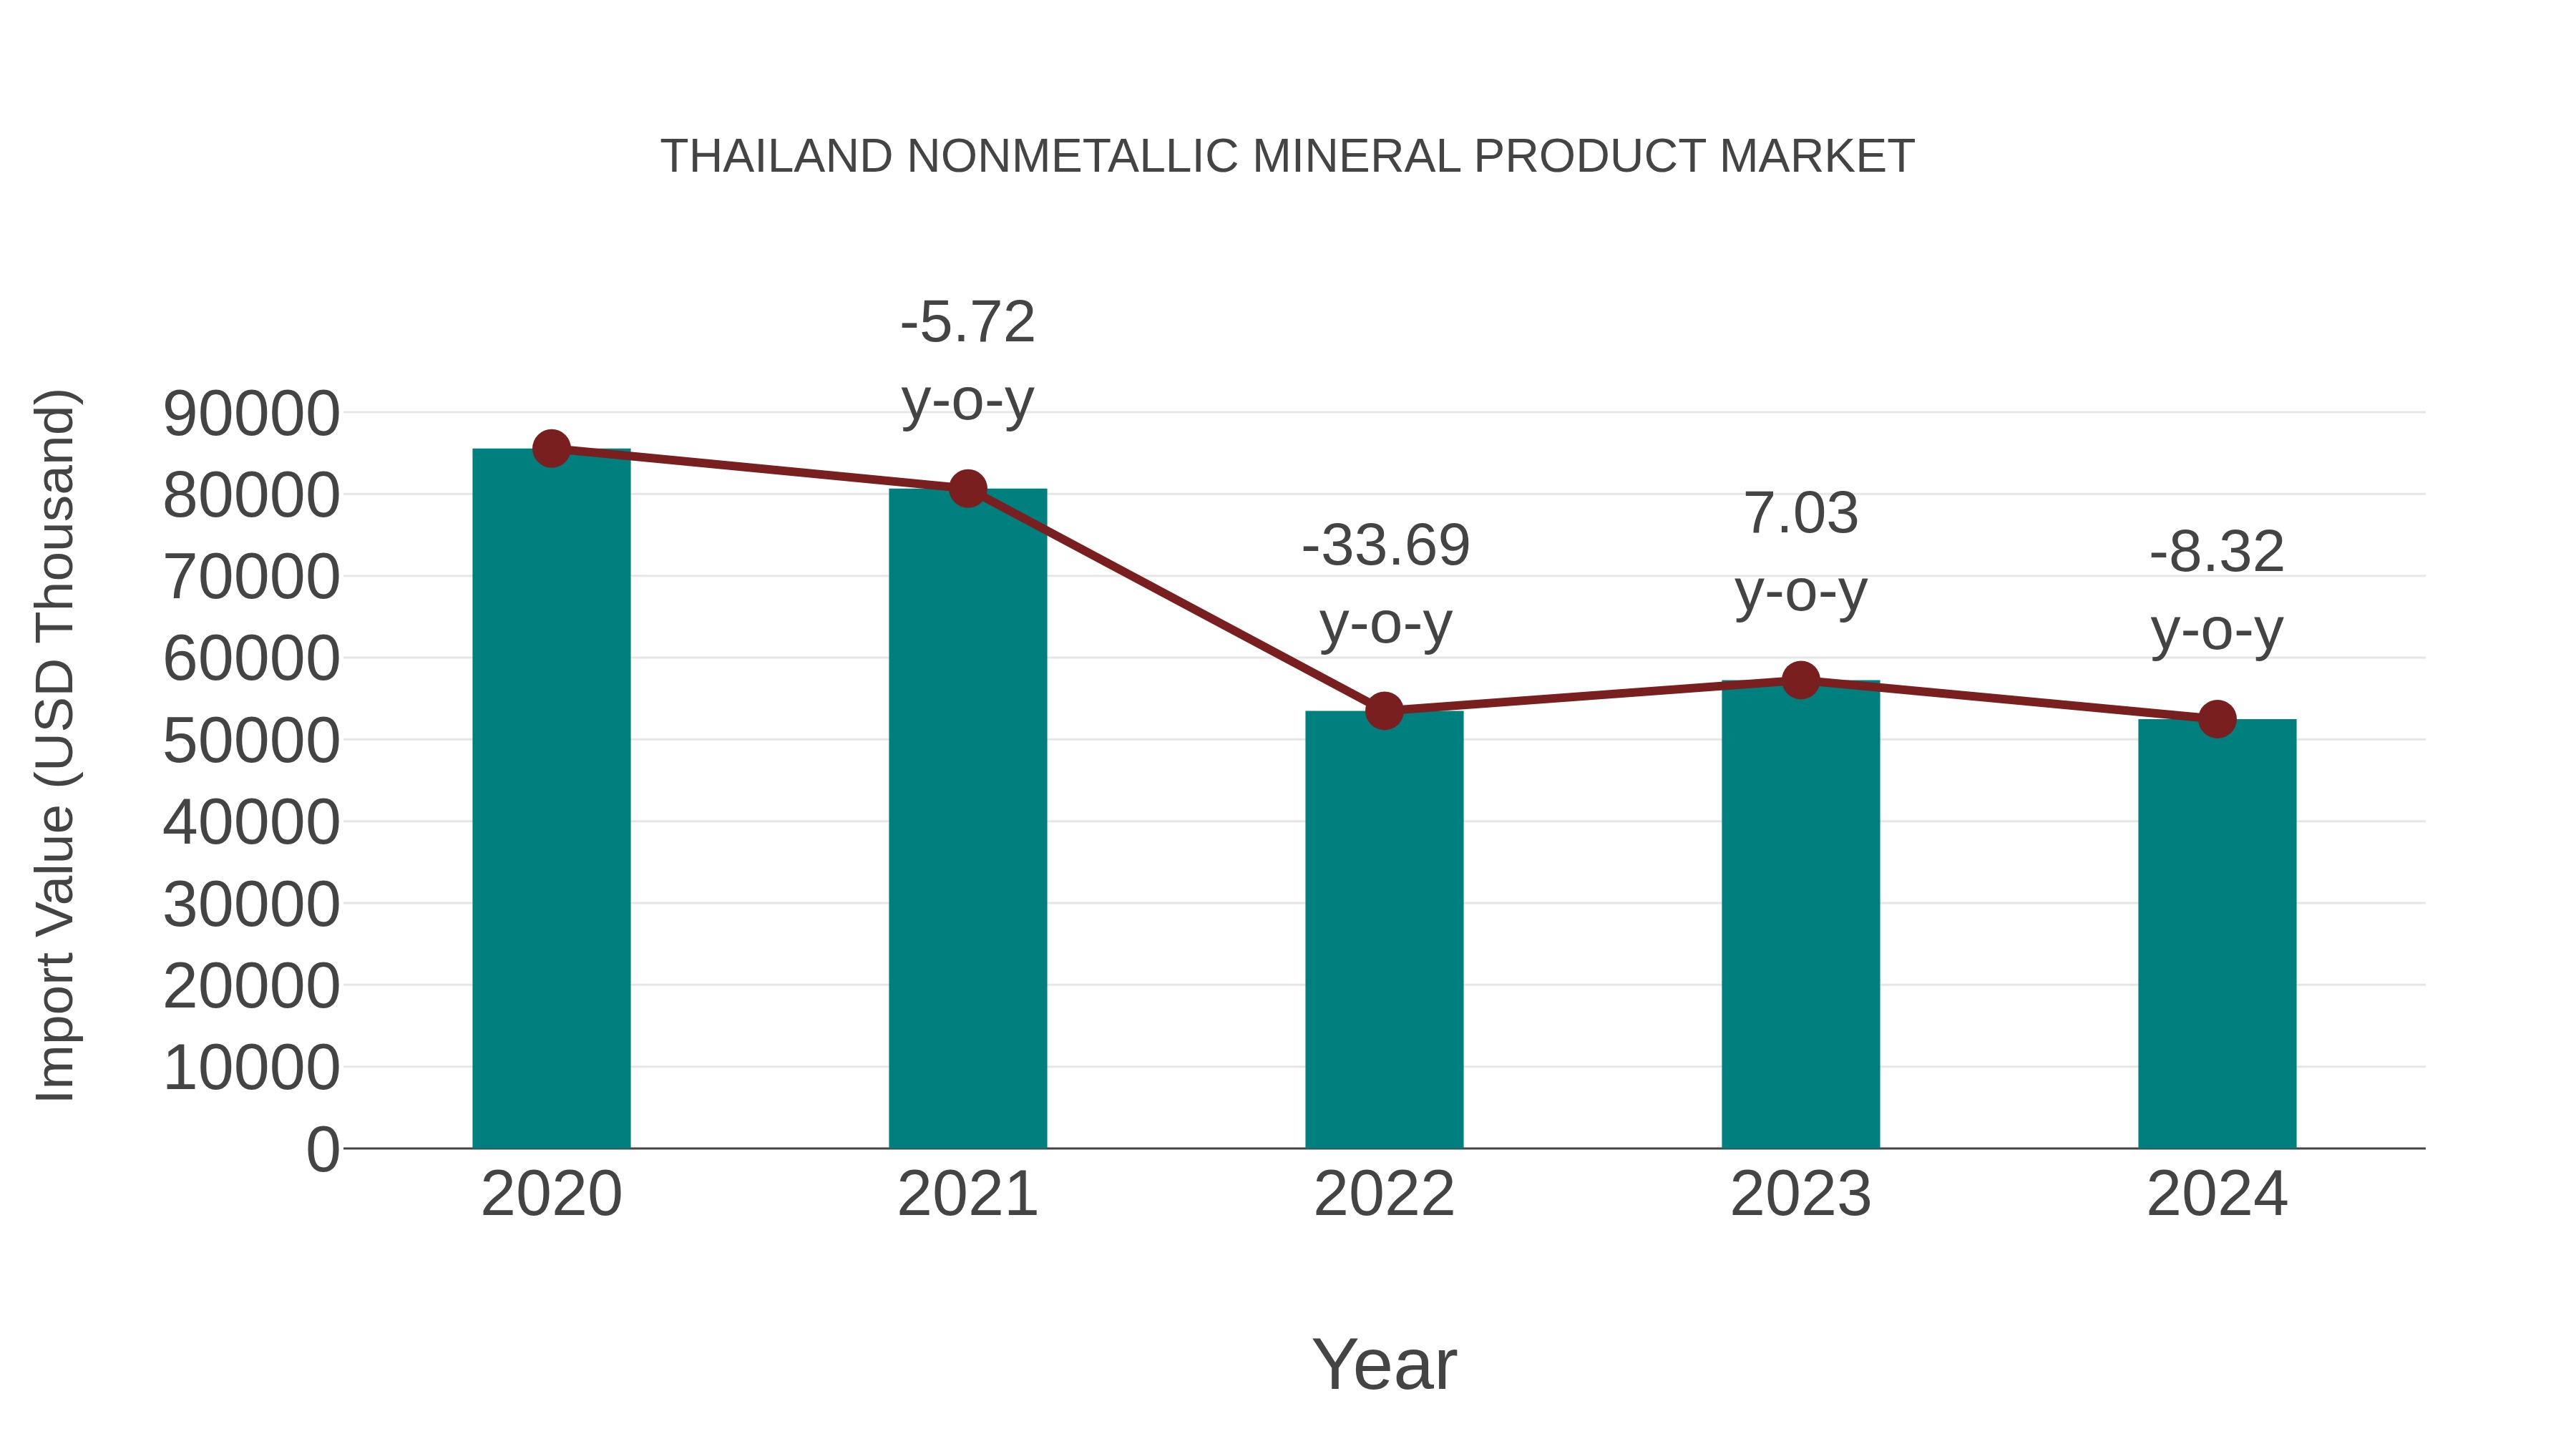
Thailand import trend for nonmetallic mineral products experienced a decline from 2023 to 2024, with a growth rate of -8.32%. The compound annual growth rate (CAGR) for the period 2020-2024 stood at -11.5%. This downward trajectory could be attributed to shifts in demand patterns or changes in global trade dynamics impacting market stability.
Thailand Nonmetallic Mineral Product Market Synopsis
Thailand`s nonmetallic mineral product market encompasses a wide range of products such as cement, glass, and ceramics. These materials are crucial for construction, manufacturing, and infrastructure development. The market is influenced by factors like urbanization, economic growth, and government infrastructure initiatives, making it a key sector in Thailand`s economy.
Drivers of the Market
The Thailand Nonmetallic Mineral Product market is experiencing robust growth due to several key drivers. The construction and real estate sectors are expanding rapidly, driving the demand for nonmetallic mineral products such as cement, concrete, and gypsum. Additionally, Thailand`s growing automotive industry requires nonmetallic materials for vehicle production. Moreover, the tourism sector`s growth fuels the construction of hotels and resorts, further boosting the market. Government infrastructure projects and initiatives to promote manufacturing are also playing a pivotal role in driving the market forward.
Challenges of the Market
The nonmetallic mineral product market in Thailand faces several challenges. One significant challenge is the environmental impact of mining and processing these minerals, which can lead to habitat destruction and water pollution. Additionally, competition from cheaper imports can put pressure on local manufacturers. Ensuring sustainable sourcing practices and maintaining product quality while being cost-competitive are ongoing challenges for this market.
COVID-19 Impact on the Market
The Thailand Nonmetallic Mineral Product Market experienced a downturn during the COVID-19 pandemic, primarily due to reduced construction activities and disruptions in the manufacturing sector. Restrictions on movement and labor shortages also impacted production. However, the market began to recover as construction projects resumed and demand for non-metallic mineral products like cement and ceramics slowly rebounded.
Key Players in the Market
Siam Cement Group, SCG Packaging, Cementhai Chemicals, Thai Ceramic, and TPI Polene. These are some top companies offering ranges of products to their customers in order to cater their needs.
Key Highlights of the Report:
- Thailand Nonmetallic Mineral Product Market Outlook
- Market Size of Thailand Nonmetallic Mineral Product Market, 2025
- Forecast of Thailand Nonmetallic Mineral Product Market, 2032
- Historical Data and Forecast of Thailand Nonmetallic Mineral Product Revenues & Volume for the Period 2022-2032F
- Thailand Nonmetallic Mineral Product Market Trend Evolution
- Thailand Nonmetallic Mineral Product Market Drivers and Challenges
- Thailand Nonmetallic Mineral Product Price Trends
- Thailand Nonmetallic Mineral Product Porter's Five Forces
- Thailand Nonmetallic Mineral Product Industry Life Cycle
- Historical Data and Forecast of Thailand Nonmetallic Mineral Product Market Revenues & Volume By Form Type for the Period 2022-2032F
- Historical Data and Forecast of Thailand Nonmetallic Mineral Product Market Revenues & Volume By Powder Form for the Period 2022-2032F
- Historical Data and Forecast of Thailand Nonmetallic Mineral Product Market Revenues & Volume By Liquid Form for the Period 2022-2032F
- Historical Data and Forecast of Thailand Nonmetallic Mineral Product Market Revenues & Volume By End User for the Period 2022-2032F
- Historical Data and Forecast of Thailand Nonmetallic Mineral Product Market Revenues & Volume By Jewellery for the Period 2022-2032F
- Historical Data and Forecast of Thailand Nonmetallic Mineral Product Market Revenues & Volume By Construction for the Period 2022-2032F
- Historical Data and Forecast of Thailand Nonmetallic Mineral Product Market Revenues & Volume By Iron & Ore for the Period 2022-2032F
- Thailand Nonmetallic Mineral Product Import Export Trade Statistics
- Market Opportunity Assessment By Form Type
- Market Opportunity Assessment By End User
- Thailand Nonmetallic Mineral Product Top Companies Market Share
- Thailand Nonmetallic Mineral Product Competitive Benchmarking By Technical and Operational Parameters
- Thailand Nonmetallic Mineral Product Company Profiles
- Thailand Nonmetallic Mineral Product Key Strategic Recommendations






































