Thailand Smart Electricity Meters Market (2025-2031) Outlook | Analysis, Value, Industry, Size, Companies, Share, Forecast, Trends, Growth, Revenue
Market Forecast By Phase (Single-phase, Three-phase), By End-Use (Residential, Commercial, Industrial) And Competitive Landscape
| Product Code: ETC075224 | Publication Date: Jul 2023 | Updated Date: Apr 2025 | Product Type: Report | |
| Publisher: 6Wresearch | Author: Ravi Bhandari | No. of Pages: 70 | No. of Figures: 35 | No. of Tables: 5 |
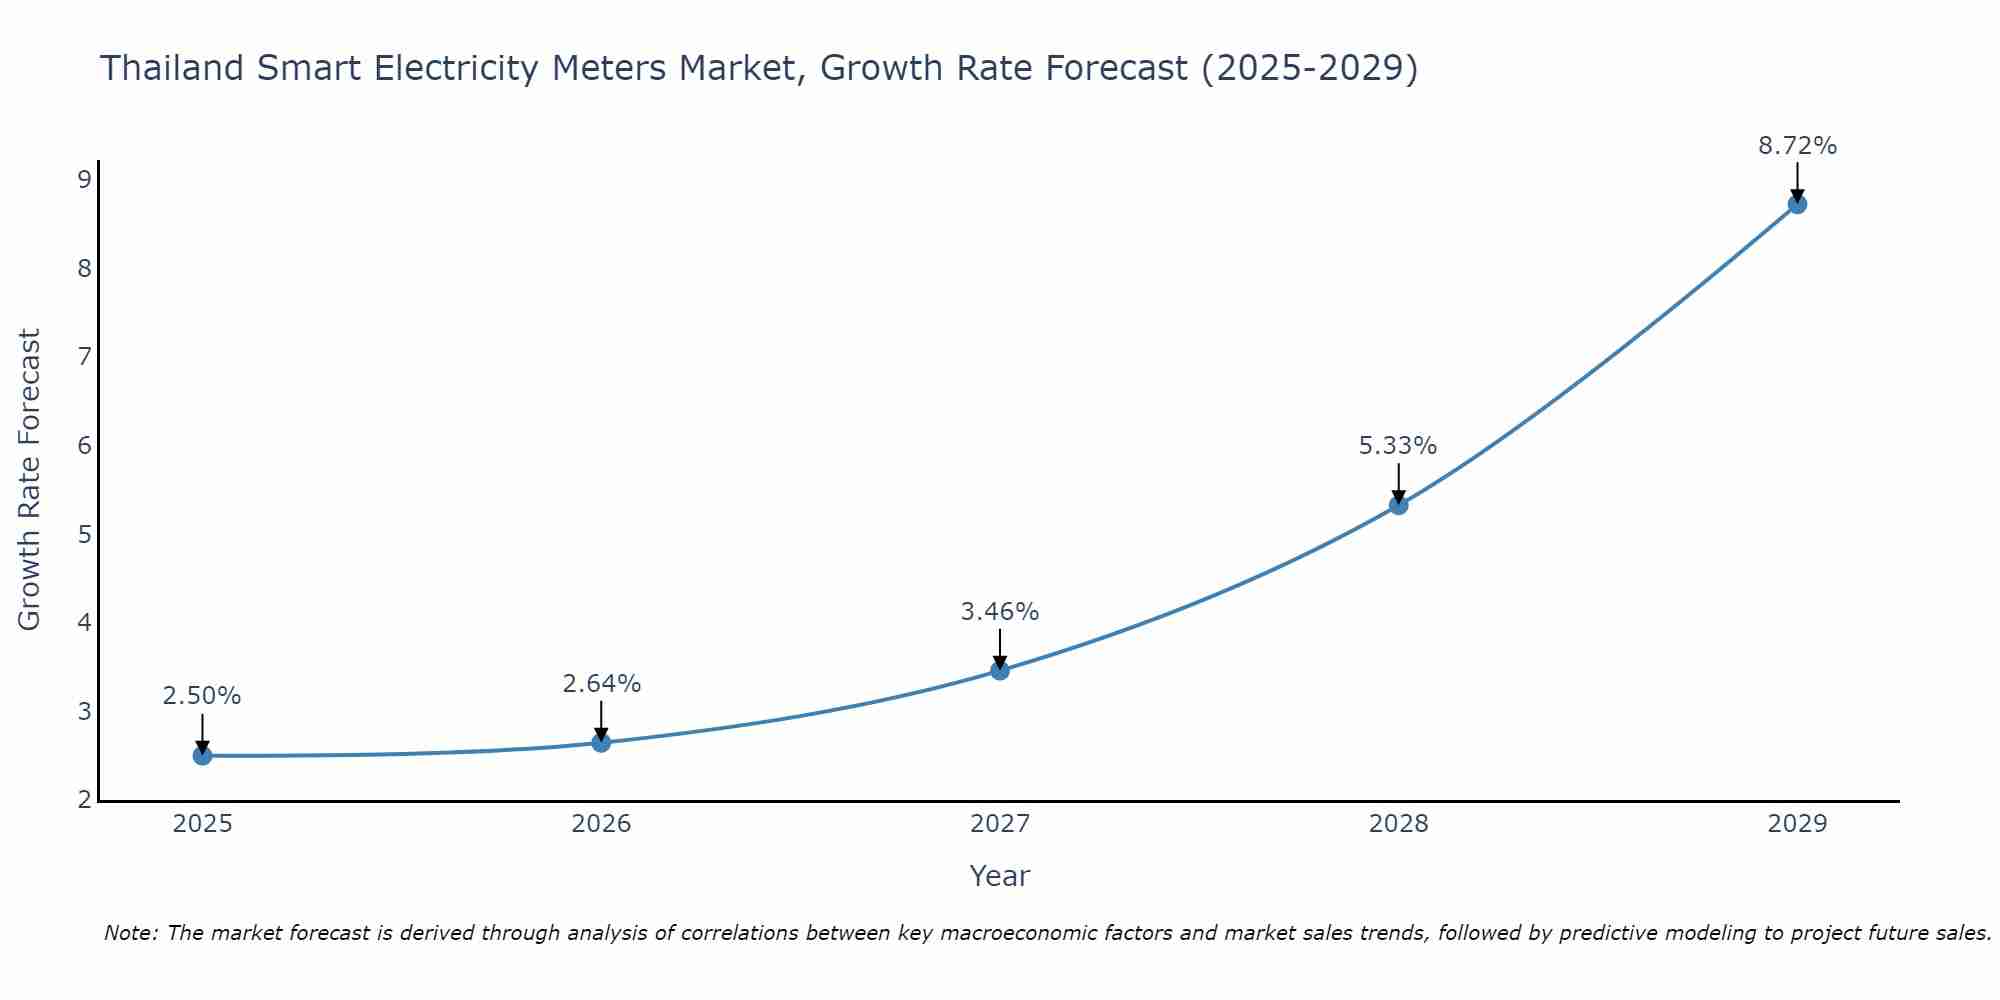
Thailand Smart Electricity Meters Market Size Growth Rate
The Thailand Smart Electricity Meters Market is poised for steady growth rate improvements from 2025 to 2029. Commencing at 2.50% in 2025, growth builds up to 8.72% by 2029.
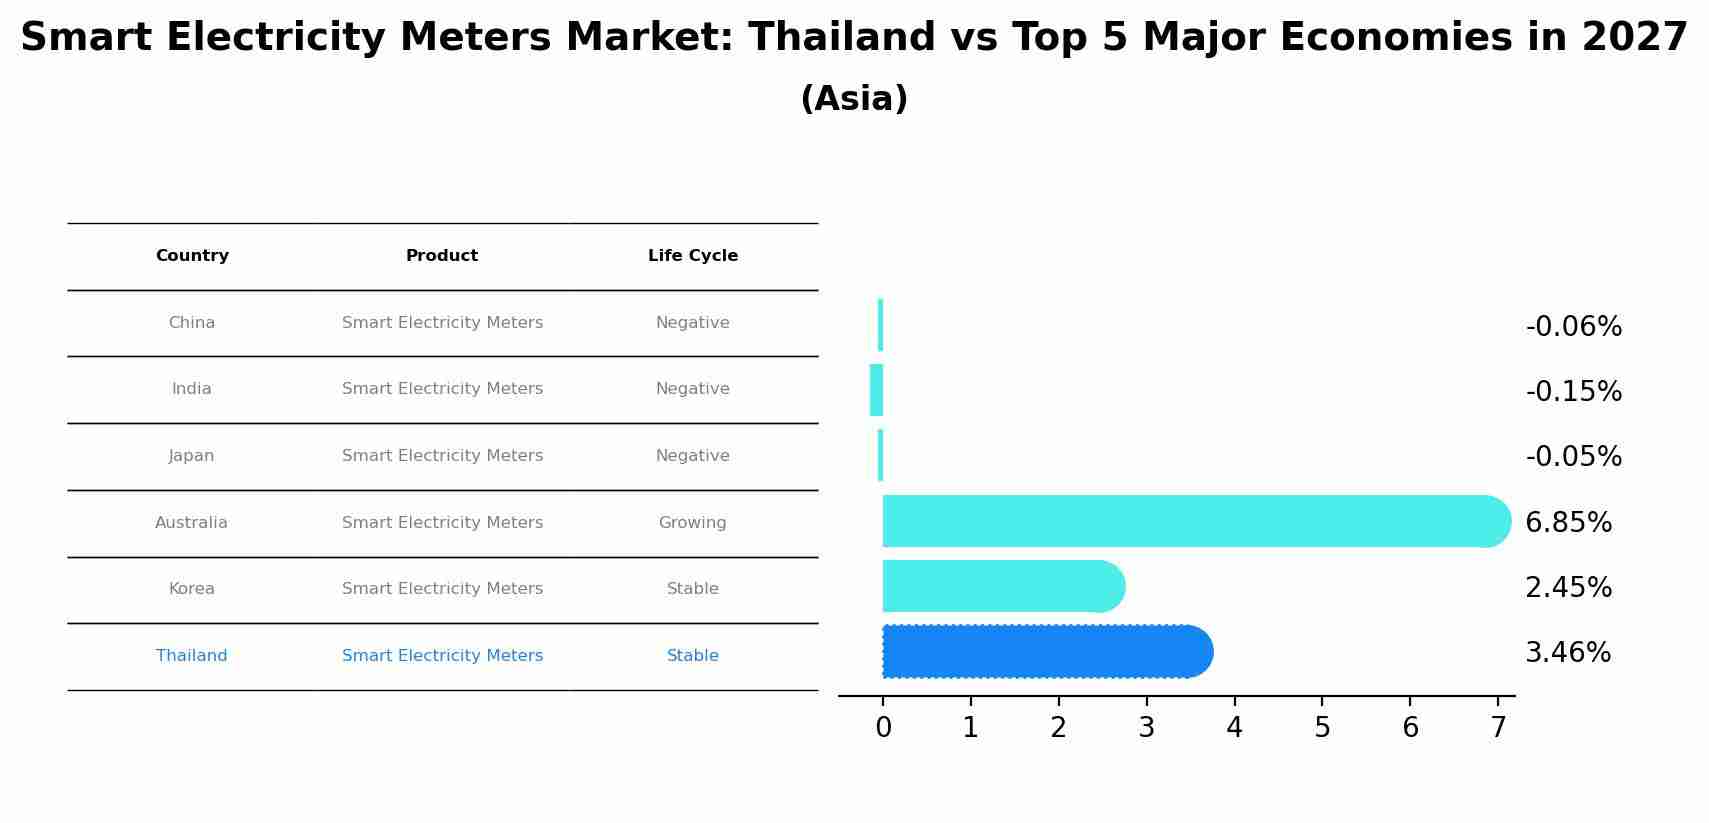
Smart Electricity Meters Market: Thailand vs Top 5 Major Economies in 2027 (Asia)
Thailand's Smart Electricity Meters market is anticipated to experience a stable growth rate of 3.46% by 2027, reflecting trends observed in the largest economy China, followed by India, Japan, Australia and South Korea.
Thailand Smart Electricity Meters Market Synopsis
The smart electricity meters market in Thailand has witnessed significant growth, driven by the country`s efforts to modernize its energy infrastructure and promote energy efficiency. Smart electricity meters, also known as advanced metering infrastructure (AMI) meters, offer real-time data monitoring and two-way communication capabilities, enabling better management of electricity consumption and distribution. With the increasing focus on smart grid technologies and sustainable energy practices, the adoption of smart electricity meters has gained traction in Thailand.
Market Drivers
Several drivers have contributed to the growth of the smart electricity meters market in Thailand. Firstly, the government`s initiatives to upgrade the power grid and implement smart grid technologies have created a conducive environment for the deployment of smart electricity meters. Secondly, the need for accurate billing and revenue management by utility companies has driven the demand for smart meters, which eliminate the need for manual meter reading and enable remote data collection. Additionally, the increasing awareness among consumers about energy conservation and the benefits of real-time data access has encouraged the adoption of smart electricity meters.
Challenges of the Market
Despite the positive market trends, the smart electricity meters industry in Thailand faces certain challenges. One of the key challenges is the initial cost of deploying smart metering infrastructure, which requires significant investments by utility companies. Moreover, ensuring data privacy and cybersecurity in smart metering systems is critical to gaining consumer trust and preventing unauthorized access. Additionally, in some regions, limited internet connectivity and infrastructure may hinder the widespread deployment of smart electricity meters.
Covid-19 Impact on the Market
The outbreak of the Covid-19 pandemic had a mixed impact on the smart electricity meters market in Thailand. During the initial phases of the pandemic, the focus shifted towards ensuring essential services and maintaining the power supply, leading to delays in some smart metering projects. However, the pandemic also highlighted the importance of digital solutions and remote monitoring, which reinforced the value of smart electricity meters in managing electricity consumption efficiently. Moreover, the pandemic accelerated the adoption of digital technologies in the utility sector, further promoting the use of smart meters.
Key Highlights of the Report:
- Thailand Smart Electricity Meters Market Outlook
- Market Size of Thailand Smart Electricity Meters Market, 2024
- Forecast of Thailand Smart Electricity Meters Market, 2031
- Historical Data and Forecast of Thailand Smart Electricity Meters Revenues & Volume for the Period 2021-2031
- Thailand Smart Electricity Meters Market Trend Evolution
- Thailand Smart Electricity Meters Market Drivers and Challenges
- Thailand Smart Electricity Meters Price Trends
- Thailand Smart Electricity Meters Porter's Five Forces
- Thailand Smart Electricity Meters Industry Life Cycle
- Historical Data and Forecast of Thailand Smart Electricity Meters Market Revenues & Volume By Phase for the Period 2021-2031
- Historical Data and Forecast of Thailand Smart Electricity Meters Market Revenues & Volume By Single-phase for the Period 2021-2031
- Historical Data and Forecast of Thailand Smart Electricity Meters Market Revenues & Volume By Three-phase for the Period 2021-2031
- Historical Data and Forecast of Thailand Smart Electricity Meters Market Revenues & Volume By End-Use for the Period 2021-2031
- Historical Data and Forecast of Thailand Smart Electricity Meters Market Revenues & Volume By Residential for the Period 2021-2031
- Historical Data and Forecast of Thailand Smart Electricity Meters Market Revenues & Volume By Commercial for the Period 2021-2031
- Historical Data and Forecast of Thailand Smart Electricity Meters Market Revenues & Volume By Industrial for the Period 2021-2031
- Thailand Smart Electricity Meters Import Export Trade Statistics
- Market Opportunity Assessment By Phase
- Market Opportunity Assessment By End-Use
- Thailand Smart Electricity Meters Top Companies Market Share
- Thailand Smart Electricity Meters Competitive Benchmarking By Technical and Operational Parameters
- Thailand Smart Electricity Meters Company Profiles
- Thailand Smart Electricity Meters Key Strategic Recommendations
Frequently Asked Questions About the Market Study (FAQs):
6Wresearch actively monitors the Thailand Smart Electricity Meters Market and publishes its comprehensive annual report, highlighting emerging trends, growth drivers, revenue analysis, and forecast outlook. Our insights help businesses to make data-backed strategic decisions with ongoing market dynamics. Our analysts track relevent industries related to the Thailand Smart Electricity Meters Market, allowing our clients with actionable intelligence and reliable forecasts tailored to emerging regional needs.
Yes, we provide customisation as per your requirements. To learn more, feel free to contact us on sales@6wresearch.com
1 Executive Summary |
2 Introduction |
2.1 Key Highlights of the Report |
2.2 Report Description |
2.3 Market Scope & Segmentation |
2.4 Research Methodology |
2.5 Assumptions |
3 North America Wafer Biscuit Market Overview |
3.1 North America Regional Macro Economic Indicators |
3.2 North America Wafer Biscuit Market Revenues & Volume, 2021 & 2031F |
3.3 North America Wafer Biscuit Market - Industry Life Cycle |
3.4 North America Wafer Biscuit Market - Porter's Five Forces |
3.5 North America Wafer Biscuit Market Revenues & Volume Share, By Countries, 2021 & 2031F |
3.6 North America Wafer Biscuit Market Revenues & Volume Share, By Form, 2021 & 2031F |
3.7 North America Wafer Biscuit Market Revenues & Volume Share, By Distribution Channel, 2021 & 2031F |
4 North America Wafer Biscuit Market Dynamics |
4.1 Impact Analysis |
4.2 Market Drivers |
4.3 Market Restraints |
5 North America Wafer Biscuit Market Trends |
6 North America Wafer Biscuit Market, 2017 - 2031 |
6.1 North America Wafer Biscuit Market, Revenues & Volume, By Form, 2017 - 2031 |
6.2 North America Wafer Biscuit Market, Revenues & Volume, By Distribution Channel, 2017 - 2031 |
7 United States Wafer Biscuit Market, 2017 - 2031 |
7.1 United States Wafer Biscuit Market, Revenues & Volume, By Form, 2017 - 2031 |
7.2 United States Wafer Biscuit Market, Revenues & Volume, By Distribution Channel, 2017 - 2031 |
8 Canada Wafer Biscuit Market, 2017 - 2031 |
8.1 Canada Wafer Biscuit Market, Revenues & Volume, By Form, 2017 - 2031 |
8.2 Canada Wafer Biscuit Market, Revenues & Volume, By Distribution Channel, 2017 - 2031 |
9 North America Wafer Biscuit Market Key Performance Indicators |
10 North America Wafer Biscuit Market - Opportunity Assessment |
10.1 North America Wafer Biscuit Market Opportunity Assessment, By Countries, 2021 & 2031F |
10.2 North America Wafer Biscuit Market Opportunity Assessment, By Form, 2021 & 2031F |
10.3 North America Wafer Biscuit Market Opportunity Assessment, By Distribution Channel, 2021 & 2031F |
11 North America Wafer Biscuit Market - Competitive Landscape |
11.1 North America Wafer Biscuit Market Revenue Share, By Companies, 2024 |
11.2 North America Wafer Biscuit Market Competitive Benchmarking, By Operating and Technical Parameters |
12 Company Profiles |
13 Recommendations |
14 Disclaimer |
Global Go To Market Strategy - 2030
Export potential enables firms to identify high-growth global markets with greater confidence by combining advanced trade intelligence with a structured quantitative methodology. The framework analyzes emerging demand trends and country-level import patterns while integrating macroeconomic and trade datasets such as GDP and population forecasts, bilateral import–export flows, tariff structures, elasticity differentials between developed and developing economies, geographic distance, and import demand projections. Using weighted trade values from 2020–2024 as the base period to project country-to-country export potential for 2030, these inputs are operationalized through calculated drivers such as gravity model parameters, tariff impact factors, and projected GDP per-capita growth. Through an analysis of hidden potentials, demand hotspots, and market conditions that are most favorable to success, this method enables firms to focus on target countries, maximize returns, and global expansion with data, backed by accuracy.
By factoring in the projected importer demand gap that is currently unmet and could be potential opportunity, it identifies the potential for the Exporter (Country) among 190 countries, against the general trade analysis, which identifies the biggest importer or exporter.
To discover high-growth global markets and optimize your business strategy:
Click Here
Pricing
- Single User License$ 1,995
- Department License$ 2,400
- Site License$ 3,120
- Global License$ 3,795

Leadership Perspectives from Industry Events
Search
Thought Leadership and Analyst Meet


Our Clients
6WResearch In News
- India Air Conditioner Market Set for Strong Rebound in 2026 After Weather-Led Correction and GST-Driven Recovery: 6Wresearch
- ADAS in India: How Automatic Emergency Braking, Blind Spot Detection & Driver Monitoring are Transforming Road Safety
- Doha a strategic location for EV manufacturing hub: IPA Qatar
- Demand for luxury TVs surging in the GCC, says Samsung
- Empowering Growth: The Thriving Journey of Bangladesh’s Cable Industry
- Demand for luxury TVs surging in the GCC, says Samsung
Latest Reports
- Nicaragua RPG Gaming Market (2026-2032)
- New Zealand RPG Gaming Market (2026-2032)
- Netherlands RPG Gaming Market (2026-2032)
- Nauru RPG Gaming Market (2026-2032)
- Namibia RPG Gaming Market (2026-2032)
- Mozambique RPG Gaming Market (2026-2032)
- Montenegro RPG Gaming Market (2026-2032)
- Mongolia RPG Gaming Market (2026-2032)
- Monaco RPG Gaming Market (2026-2032)
- Micronesia RPG Gaming Market (2026-2032)
Industry Events and Analyst Meet

EV India Expo 2026

HIMTEX 2026

India Refining Summit 2026

India EV Show 2026

EV tech India Expo 2026
Whitepaper
- Middle East & Africa Commercial Security Market Click here to view more.
- Middle East & Africa Fire Safety Systems & Equipment Market Click here to view more.
- GCC Drone Market Click here to view more.
- Middle East Lighting Fixture Market Click here to view more.
- GCC Physical & Perimeter Security Market Click here to view more.