Tunisia Clay Products And Refractories Market (2026-2032) Outlook | Growth, Revenue, Share, Industry, Companies, Value, Forecast, Analysis, Trends & Size
Market Forecast By Type (Pottery, Ceramics, Plumbing Fixtures, Clay Building Material, Refractories), By Process (Grinding , Cutting , Mixing , Shaping, Honing), By Material (Quartz, Chamatte, Sand, Sawdust, Slag, Pulverized , Coal), By End-User Vertical (Construction , Automobiles , Steel Making , Cosmetics, Food Industry, Others) And Competitive Landscape
| Product Code: ETC319134 | Publication Date: Aug 2022 | Updated Date: Jul 2026 | Product Type: Market Research Report | |
| Publisher: 6Wresearch | Author: Shubham Padhi | No. of Pages: 75 | No. of Figures: 35 | No. of Tables: 20 |
Tunisia Clay Products And Refractories Market Size, Share & Growth Rate
The Tunisia Clay Products And Refractories Market was estimated at USD 311 Million in 2025 and is projected to reach USD 431 Million by 2032, growing at a CAGR of 4.8% from 2026 to 2032. This growth is driven primarily by the robust demand for heat-resistant materials across the steel, cement, glass, and ceramics industries. Furthermore, the ongoing expansion of Tunisias industrial manufacturing sector, coupled with significant infrastructure development projects, underscores the critical role that clay products and refractories play in supporting the nations economic progress.
Tunisia Clay Products And Refractories Market Year-wise Growth Rate and Key Drivers
This graph highlights how the Tunisia Clay Products And Refractories Market has steadily grown over the years, supported by major growth factors.
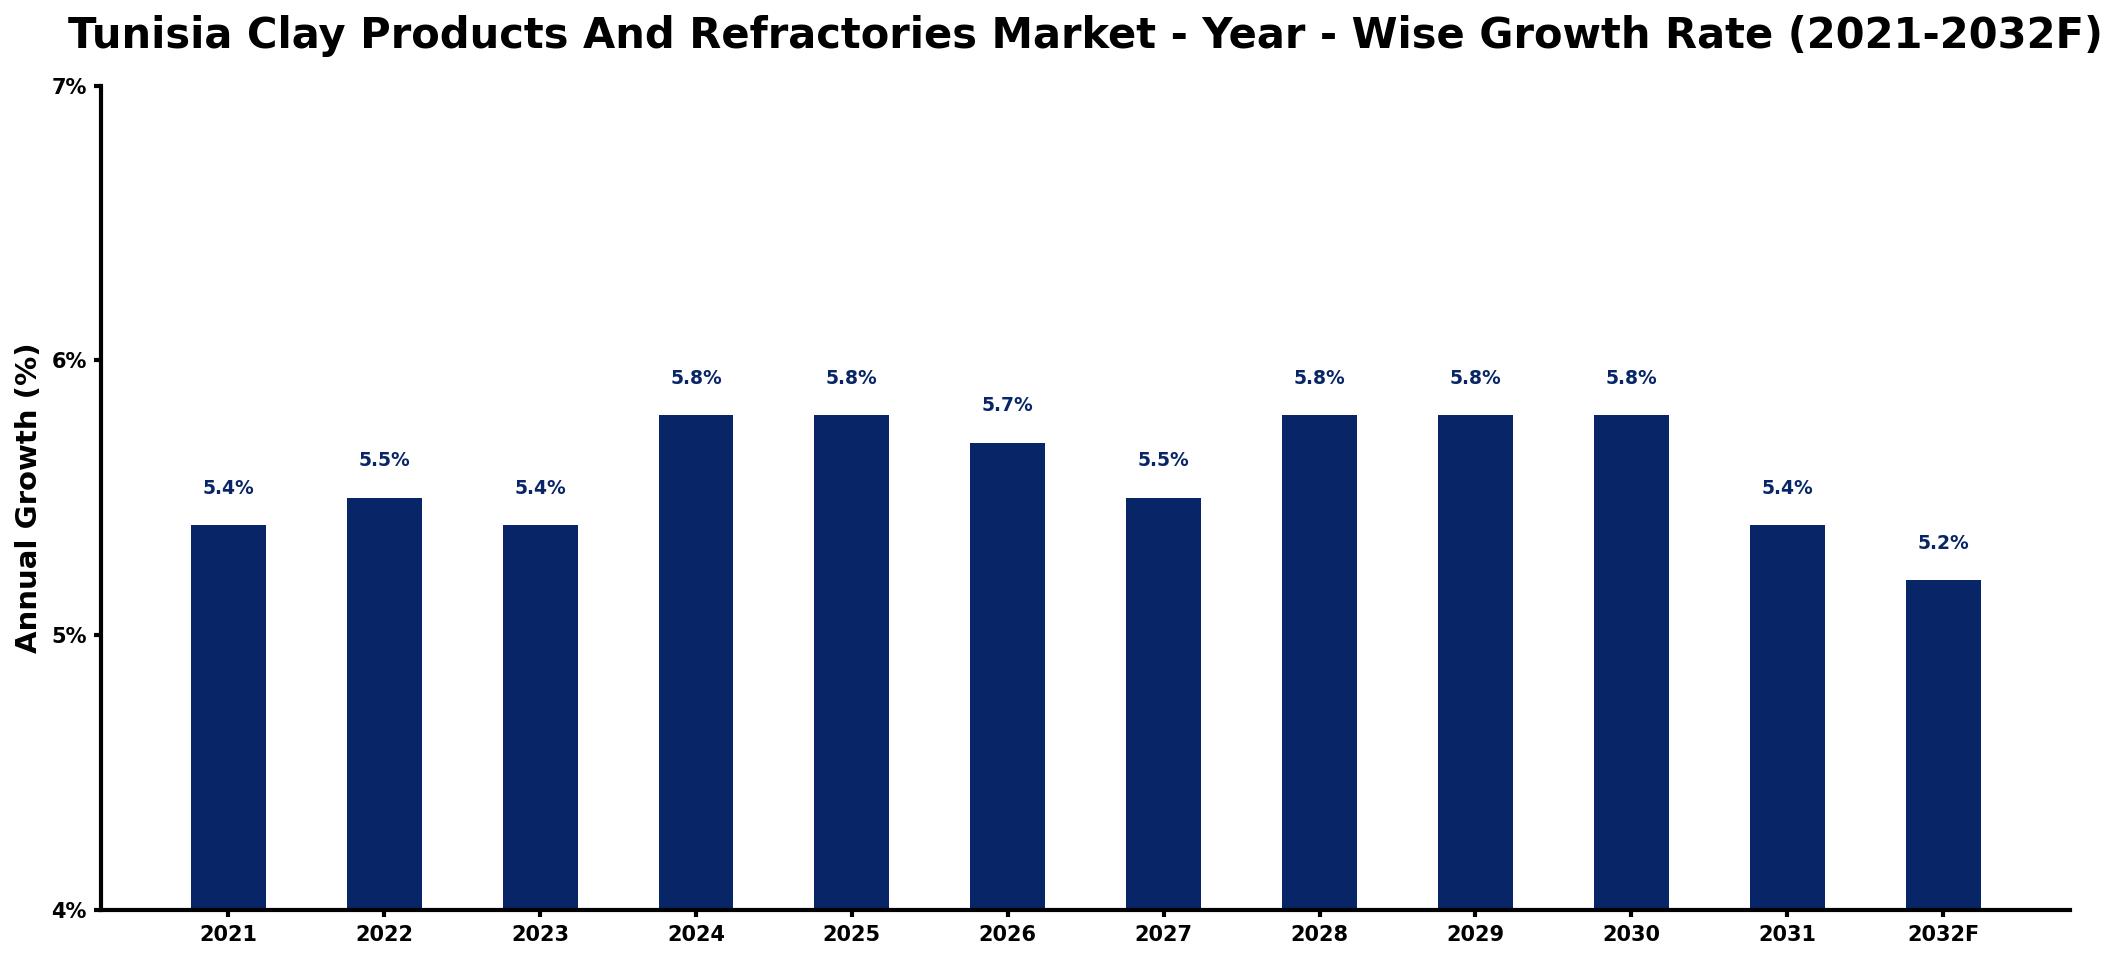
The table below presents the year‑wise growth rates along with the key drivers influencing the market
| Year | Growth Rate | Major Drivers |
| 2021 | 5.4% | Rising construction sector investments |
| 2022 | 5.5% | Increased demand from manufacturing |
| 2023 | 5.4% | Expansion of energy sector projects |
| 2024 | 5.8% | Growing infrastructure development initiatives |
| 2025 | 5.8% | Surge in industrial applications demand |
| 2026 | 5.7% | Strengthening export market opportunities |
| 2027 | 5.5% | Diversification of industrial supply chains |
| 2028 | 5.8% | Enhanced sustainability practices adoption |
| 2029 | 5.8% | Technological advancements in production |
| 2030 | 5.8% | Rising urbanization and housing needs |
| 2031 | 5.4% | Growing demand for thermal insulation |
| 2032 | 5.2% | Increased focus on eco-friendly solutions |
Note: Market size estimations and growth projections presented in this report are based on 6Wresearch's proprietary forecasting methodology, utilizing the latest available industry data, government publications, and primary research inputs.
Tunisia Clay Products And Refractories Market Synopsis
The key driving force in the Tunisia Clay Products And Refractories Market today is the escalating need for advanced materials that withstand high temperatures and corrosive environments. This demand is closely linked to the growth of various industries, particularly in metallurgy and construction.
Technological innovations in the formulation of clay products are also reshaping the landscape. Improved durability, thermal insulation, and chemical resistance are not just enhancing product performance but also aligning with the global shift towards energy efficiency and sustainable practices.
Tunisia Clay Products And Refractories Market Key Takeaways
- The market is positioned for steady growth driven by industrial demand and infrastructure projects.
- Technological advancements are improving product performance and sustainability.
- Government policies are favorably influencing the manufacturing environment.
- Increased focus on energy efficiency is driving market dynamics.
- Competition from alternative materials remains a challenge but also spurs innovation.
Evaluation of Restraints in Tunisia Clay Products And Refractories Market
Despite its promising outlook, the Tunisia Clay Products And Refractories Market faces significant challenges. High production costs associated with raw materials and advanced manufacturing technologies hinder profitability for many local producers. Additionally, competition from alternative refractory materials, which often offer cost advantages, is placing pressure on traditional clay-based products. Furthermore, limited domestic production capabilities can restrict supply, leaving the market vulnerable to fluctuations in import reliance and pricing volatility.
Tunisia Clay Products And Refractories Market Trends
Current trends indicate a marked shift towards developing innovative and environmentally friendly refractory materials. Manufacturers are increasingly focusing on creating products that not only meet industrial standards but also comply with sustainability mandates. Moreover, there is a rising adoption of smart manufacturing techniques that leverage automation and data analytics to enhance operational efficiencies. This focus on innovation is pivotal in meeting the evolving demands of industries such as construction and metallurgy.
Tunisia Clay Products And Refractories Market Opportunities
The opportunities for growth in the Tunisia Clay Products And Refractories Market are plentiful. Investment in advanced production techniques presents a pathway for enhancing product quality while reducing costs. Additionally, expanding the export market can provide local manufacturers access to larger revenue streams, particularly in regions seeking reliable refractory solutions. Furthermore, collaboration with research institutions to develop cutting-edge products that align with global sustainability trends represents a significant growth avenue.
Government Initiatives in the Tunisia Clay Products And Refractories Market
The Tunisian government is playing a proactive role in promoting the clay products and refractories market through a range of policies aimed at supporting industrial manufacturing. This includes establishing product quality standards and enhancing export competitiveness. Regulations are in place to ensure that clay products and refractories meet international performance specifications, which not only boosts local market confidence but also facilitates entry into global markets. Furthermore, financial incentives for manufacturers investing in advanced production methods further bolster the sectors growth potential.
Future Insights of the Tunisia Clay Products And Refractories Market
Looking ahead to 2026-2032, the Tunisia Clay Products And Refractories Market is expected to continue its upward trajectory, driven by sustained industrial demand and ongoing infrastructure investments. As manufacturers adopt more advanced technologies and sustainable practices, product offerings will likely become more competitive. Additionally, increasing collaborations with international partners for knowledge exchange and technology transfer will foster innovation and enhance the market's resilience against challenges.
Tunisia Clay Products And Refractories Market Latest Developments (2025 - 2026)
In recent months, the industry has seen a notable increase in initiatives aimed at enhancing product sustainability. Numerous manufacturers are actively exploring alternative raw materials to lower environmental impact while improving product performance. Furthermore, advancements in manufacturing technologies are being implemented to enhance operational efficiencies, helping companies remain competitive in an increasingly globalized market. The focus on energy efficiency is also prompting investments in innovative production techniques that minimize energy consumption.
Tunisia Clay Products And Refractories Market - Key Attractiveness of the Report
- 10 Years of Market Numbers
- Historical Data Starting from 2022 to 2025
- Base Year: 2025
- Forecast Data until 2032
- Key Performance Indicators Impacting the Market
- Major Upcoming Developments and Projects
Key Highlights of the Report:
- Tunisia Clay Products And Refractories Market Outlook
- Market Size of Tunisia Clay Products And Refractories Market, 2025
- Forecast of Tunisia Clay Products And Refractories Market, 2032
- Historical Data and Forecast of Tunisia Clay Products And Refractories Revenues & Volume for the Period 2022-2032F
- Tunisia Clay Products And Refractories Market Trend Evolution
- Tunisia Clay Products And Refractories Market Drivers and Challenges
- Tunisia Clay Products And Refractories Price Trends
- Tunisia Clay Products And Refractories Porter's Five Forces
- Tunisia Clay Products And Refractories Industry Life Cycle
- Historical Data and Forecast of Tunisia Clay Products And Refractories Market Revenues & Volume By Type for the Period 2022-2032F
- Historical Data and Forecast of Tunisia Clay Products And Refractories Market Revenues & Volume By Pottery for the Period 2022-2032F
- Historical Data and Forecast of Tunisia Clay Products And Refractories Market Revenues & Volume By Ceramics for the Period 2022-2032F
- Historical Data and Forecast of Tunisia Clay Products And Refractories Market Revenues & Volume By Plumbing Fixtures for the Period 2022-2032F
- Historical Data and Forecast of Tunisia Clay Products And Refractories Market Revenues & Volume By Clay Building Material for the Period 2022-2032F
- Historical Data and Forecast of Tunisia Clay Products And Refractories Market Revenues & Volume By Refractories for the Period 2022-2032F
- Historical Data and Forecast of Tunisia Clay Products And Refractories Market Revenues & Volume By Process for the Period 2022-2032F
- Historical Data and Forecast of Tunisia Clay Products And Refractories Market Revenues & Volume By Grinding for the Period 2022-2032F
- Historical Data and Forecast of Tunisia Clay Products And Refractories Market Revenues & Volume By Cutting for the Period 2022-2032F
- Historical Data and Forecast of Tunisia Clay Products And Refractories Market Revenues & Volume By Mixing for the Period 2022-2032F
- Historical Data and Forecast of Tunisia Clay Products And Refractories Market Revenues & Volume By Shaping for the Period 2022-2032F
- Historical Data and Forecast of Tunisia Clay Products And Refractories Market Revenues & Volume By Honing for the Period 2022-2032F
- Historical Data and Forecast of Tunisia Clay Products And Refractories Market Revenues & Volume By Material for the Period 2022-2032F
- Historical Data and Forecast of Tunisia Clay Products And Refractories Market Revenues & Volume By Quartz for the Period 2022-2032F
- Historical Data and Forecast of Tunisia Clay Products And Refractories Market Revenues & Volume By Chamatte for the Period 2022-2032F
- Historical Data and Forecast of Tunisia Clay Products And Refractories Market Revenues & Volume By Sand for the Period 2022-2032F
- Historical Data and Forecast of Tunisia Clay Products And Refractories Market Revenues & Volume By Sawdust for the Period 2022-2032F
- Historical Data and Forecast of Tunisia Clay Products And Refractories Market Revenues & Volume By Slag for the Period 2022-2032F
- Historical Data and Forecast of Tunisia Clay Products And Refractories Market Revenues & Volume By Pulverized for the Period 2022-2032F
- Historical Data and Forecast of Tunisia Clay Products And Refractories Market Revenues & Volume By Coal for the Period 2022-2032F
- Historical Data and Forecast of Tunisia Clay Products And Refractories Market Revenues & Volume By End-User Vertical for the Period 2022-2032F
- Historical Data and Forecast of Tunisia Clay Products And Refractories Market Revenues & Volume By Construction for the Period 2022-2032F
- Historical Data and Forecast of Tunisia Clay Products And Refractories Market Revenues & Volume By Automobiles for the Period 2022-2032F
- Historical Data and Forecast of Tunisia Clay Products And Refractories Market Revenues & Volume By Steel Making for the Period 2022-2032F
- Historical Data and Forecast of Tunisia Clay Products And Refractories Market Revenues & Volume By Cosmetics for the Period 2022-2032F
- Historical Data and Forecast of Tunisia Clay Products And Refractories Market Revenues & Volume By Food Industry for the Period 2022-2032F
- Historical Data and Forecast of Tunisia Clay Products And Refractories Market Revenues & Volume By Others for the Period 2022-2032F
- Tunisia Clay Products And Refractories Import Export Trade Statistics
- Market Opportunity Assessment By Type
- Market Opportunity Assessment By Process
- Market Opportunity Assessment By Material
- Market Opportunity Assessment By End-User Vertical
- Tunisia Clay Products And Refractories Top Companies Market Share
- Tunisia Clay Products And Refractories Competitive Benchmarking By Technical and Operational Parameters
- Tunisia Clay Products And Refractories Company Profiles
- Tunisia Clay Products And Refractories Key Strategic Recommendations
Frequently Asked Questions About the Market Study (FAQs):
The Tunisia Clay Products And Refractories Market is estimated to be valued at USD 311 Million in 2025, with expectations to reach USD 431 Million by 2032, reflecting a CAGR of 4.8% from 2026 to 2032.
The demand for refractories is significantly driven by growth in industries such as steel, cement, and glass, which rely on heat-resistant materials for high-temperature applications. Additionally, ongoing infrastructure projects boost the demand for clay products.
Innovations in manufacturing and product formulation are leading to enhanced durability, thermal insulation, and chemical resistance, allowing local manufacturers to meet evolving market demands more effectively.
Yes, the Tunisian government provides financial incentives for manufacturers that invest in advanced production techniques and quality assurance programs, enhancing their competitiveness in both domestic and international markets.
Domestic producers grapple with high production costs, limited manufacturing capabilities, and competition from alternative materials, which can inhibit market growth and profitability.
6Wresearch actively monitors the Tunisia Clay Products And Refractories Market and publishes its comprehensive annual report, highlighting emerging trends, growth drivers, revenue analysis, and forecast outlook. Our insights help businesses to make data-backed strategic decisions with ongoing market dynamics. Our analysts track relevent industries related to the Tunisia Clay Products And Refractories Market, allowing our clients with actionable intelligence and reliable forecasts tailored to emerging regional needs.
Yes, we provide customisation as per your requirements. To learn more, feel free to contact us on sales@6wresearch.com
1 Executive Summary |
2 Introduction |
2.1 Key Highlights of the Report |
2.2 Report Description |
2.3 Market Scope & Segmentation |
2.4 Research Methodology |
2.5 Assumptions |
3 Tunisia Clay Products And Refractories Market Overview |
3.1 Tunisia Country Macro Economic Indicators |
3.2 Tunisia Clay Products And Refractories Market Revenues & Volume, 2022 & 2032F |
3.3 Tunisia Clay Products And Refractories Market - Industry Life Cycle |
3.4 Tunisia Clay Products And Refractories Market - Porter's Five Forces |
3.5 Tunisia Clay Products And Refractories Market Revenues & Volume Share, By Type, 2022 & 2032F |
3.6 Tunisia Clay Products And Refractories Market Revenues & Volume Share, By Process , 2022 & 2032F |
3.7 Tunisia Clay Products And Refractories Market Revenues & Volume Share, By Material , 2022 & 2032F |
3.8 Tunisia Clay Products And Refractories Market Revenues & Volume Share, By End-User Vertical , 2022 & 2032F |
4 Tunisia Clay Products And Refractories Market Dynamics |
4.1 Impact Analysis |
4.2 Market Drivers |
4.2.1 Growing construction industry in Tunisia |
4.2.2 Increase in infrastructure development projects |
4.2.3 Rising demand for energy-efficient and sustainable building materials |
4.3 Market Restraints |
4.3.1 Fluctuating raw material prices |
4.3.2 Intense competition from alternative materials |
4.3.3 Regulatory challenges related to environmental standards and permits |
5 Tunisia Clay Products And Refractories Market Trends |
6 Tunisia Clay Products And Refractories Market, By Types |
6.1 Tunisia Clay Products And Refractories Market, By Type |
6.1.1 Overview and Analysis |
6.1.2 Tunisia Clay Products And Refractories Market Revenues & Volume, By Type, 2022-2032F |
6.1.3 Tunisia Clay Products And Refractories Market Revenues & Volume, By Pottery, 2022-2032F |
6.1.4 Tunisia Clay Products And Refractories Market Revenues & Volume, By Ceramics, 2022-2032F |
6.1.5 Tunisia Clay Products And Refractories Market Revenues & Volume, By Plumbing Fixtures, 2022-2032F |
6.1.6 Tunisia Clay Products And Refractories Market Revenues & Volume, By Clay Building Material, 2022-2032F |
6.1.7 Tunisia Clay Products And Refractories Market Revenues & Volume, By Refractories, 2022-2032F |
6.2 Tunisia Clay Products And Refractories Market, By Process |
6.2.1 Overview and Analysis |
6.2.2 Tunisia Clay Products And Refractories Market Revenues & Volume, By Grinding , 2022-2032F |
6.2.3 Tunisia Clay Products And Refractories Market Revenues & Volume, By Cutting , 2022-2032F |
6.2.4 Tunisia Clay Products And Refractories Market Revenues & Volume, By Mixing , 2022-2032F |
6.2.5 Tunisia Clay Products And Refractories Market Revenues & Volume, By Shaping, 2022-2032F |
6.2.6 Tunisia Clay Products And Refractories Market Revenues & Volume, By Honing, 2022-2032F |
6.3 Tunisia Clay Products And Refractories Market, By Material |
6.3.1 Overview and Analysis |
6.3.2 Tunisia Clay Products And Refractories Market Revenues & Volume, By Quartz, 2022-2032F |
6.3.3 Tunisia Clay Products And Refractories Market Revenues & Volume, By Chamatte, 2022-2032F |
6.3.4 Tunisia Clay Products And Refractories Market Revenues & Volume, By Sand, 2022-2032F |
6.3.5 Tunisia Clay Products And Refractories Market Revenues & Volume, By Sawdust, 2022-2032F |
6.3.6 Tunisia Clay Products And Refractories Market Revenues & Volume, By Slag, 2022-2032F |
6.3.7 Tunisia Clay Products And Refractories Market Revenues & Volume, By Pulverized , 2022-2032F |
6.4 Tunisia Clay Products And Refractories Market, By End-User Vertical |
6.4.1 Overview and Analysis |
6.4.2 Tunisia Clay Products And Refractories Market Revenues & Volume, By Construction , 2022-2032F |
6.4.3 Tunisia Clay Products And Refractories Market Revenues & Volume, By Automobiles , 2022-2032F |
6.4.4 Tunisia Clay Products And Refractories Market Revenues & Volume, By Steel Making , 2022-2032F |
6.4.5 Tunisia Clay Products And Refractories Market Revenues & Volume, By Cosmetics, 2022-2032F |
6.4.6 Tunisia Clay Products And Refractories Market Revenues & Volume, By Food Industry, 2022-2032F |
6.4.7 Tunisia Clay Products And Refractories Market Revenues & Volume, By Others, 2022-2032F |
7 Tunisia Clay Products And Refractories Market Import-Export Trade Statistics |
7.1 Tunisia Clay Products And Refractories Market Export to Major Countries |
7.2 Tunisia Clay Products And Refractories Market Imports from Major Countries |
8 Tunisia Clay Products And Refractories Market Key Performance Indicators |
8.1 Percentage of clay products and refractories used in major construction projects |
8.2 Adoption rate of energy-efficient clay products and refractories |
8.3 Investment in RD for innovative clay products and refractories |
9 Tunisia Clay Products And Refractories Market - Opportunity Assessment |
9.1 Tunisia Clay Products And Refractories Market Opportunity Assessment, By Type, 2022 & 2032F |
9.2 Tunisia Clay Products And Refractories Market Opportunity Assessment, By Process , 2022 & 2032F |
9.3 Tunisia Clay Products And Refractories Market Opportunity Assessment, By Material , 2022 & 2032F |
9.4 Tunisia Clay Products And Refractories Market Opportunity Assessment, By End-User Vertical , 2022 & 2032F |
10 Tunisia Clay Products And Refractories Market - Competitive Landscape |
10.1 Tunisia Clay Products And Refractories Market Revenue Share, By Companies, 2025 |
10.2 Tunisia Clay Products And Refractories Market Competitive Benchmarking, By Operating and Technical Parameters |
11 Company Profiles |
12 Recommendations |
13 Disclaimer |
Global Go To Market Strategy - 2030
Export potential enables firms to identify high-growth global markets with greater confidence by combining advanced trade intelligence with a structured quantitative methodology. The framework analyzes emerging demand trends and country-level import patterns while integrating macroeconomic and trade datasets such as GDP and population forecasts, bilateral import–export flows, tariff structures, elasticity differentials between developed and developing economies, geographic distance, and import demand projections. Using weighted trade values from 2020–2024 as the base period to project country-to-country export potential for 2030, these inputs are operationalized through calculated drivers such as gravity model parameters, tariff impact factors, and projected GDP per-capita growth. Through an analysis of hidden potentials, demand hotspots, and market conditions that are most favorable to success, this method enables firms to focus on target countries, maximize returns, and global expansion with data, backed by accuracy.
By factoring in the projected importer demand gap that is currently unmet and could be potential opportunity, it identifies the potential for the Exporter (Country) among 190 countries, against the general trade analysis, which identifies the biggest importer or exporter.
To discover high-growth global markets and optimize your business strategy:
Click Here
Pricing
- Single User License$ 1,995
- Department License$ 2,400
- Site License$ 3,120
- Global License$ 3,795

Leadership Perspectives from Industry Events
Search
Thought Leadership and Analyst Meet


Our Clients
6WResearch In News
- India Air Conditioner Market Set for Strong Rebound in 2026 After Weather-Led Correction and GST-Driven Recovery: 6Wresearch
- ADAS in India: How Automatic Emergency Braking, Blind Spot Detection & Driver Monitoring are Transforming Road Safety
- Doha a strategic location for EV manufacturing hub: IPA Qatar
- Demand for luxury TVs surging in the GCC, says Samsung
- Empowering Growth: The Thriving Journey of Bangladesh’s Cable Industry
- Demand for luxury TVs surging in the GCC, says Samsung
Latest Reports
- Nicaragua RPG Gaming Market (2026-2032)
- New Zealand RPG Gaming Market (2026-2032)
- Netherlands RPG Gaming Market (2026-2032)
- Nauru RPG Gaming Market (2026-2032)
- Namibia RPG Gaming Market (2026-2032)
- Mozambique RPG Gaming Market (2026-2032)
- Montenegro RPG Gaming Market (2026-2032)
- Mongolia RPG Gaming Market (2026-2032)
- Monaco RPG Gaming Market (2026-2032)
- Micronesia RPG Gaming Market (2026-2032)
Industry Events and Analyst Meet

EV India Expo 2026

HIMTEX 2026

India Refining Summit 2026

India EV Show 2026

EV tech India Expo 2026
Whitepaper
- Middle East & Africa Commercial Security Market Click here to view more.
- Middle East & Africa Fire Safety Systems & Equipment Market Click here to view more.
- GCC Drone Market Click here to view more.
- Middle East Lighting Fixture Market Click here to view more.
- GCC Physical & Perimeter Security Market Click here to view more.