Tunisia Electronic parts Market (2026-2032) | Growth, Companies, Trends, Size, Outlook, Industry, Forecast, Value, Analysis, Share & Revenue
Market Forecast By Type (Passive, Active, Electro Mechanic), By Application (Automotive, Communications, Computing Applications, Others) And Competitive Landscape
| Product Code: ETC035594 | Publication Date: Oct 2020 | Updated Date: Jun 2026 | Product Type: Report | |
| Publisher: 6Wresearch | Author: Bhawna Singh | No. of Pages: 70 | No. of Figures: 35 | No. of Tables: 5 |
Tunisia Electronic parts Market Summary
The tunisia electronic parts market was estimated at USD 356 Million in 2025 and is projected to reach USD 487 Million by 2032, growing at a CAGR of 5.6% from 2026 to 2032.
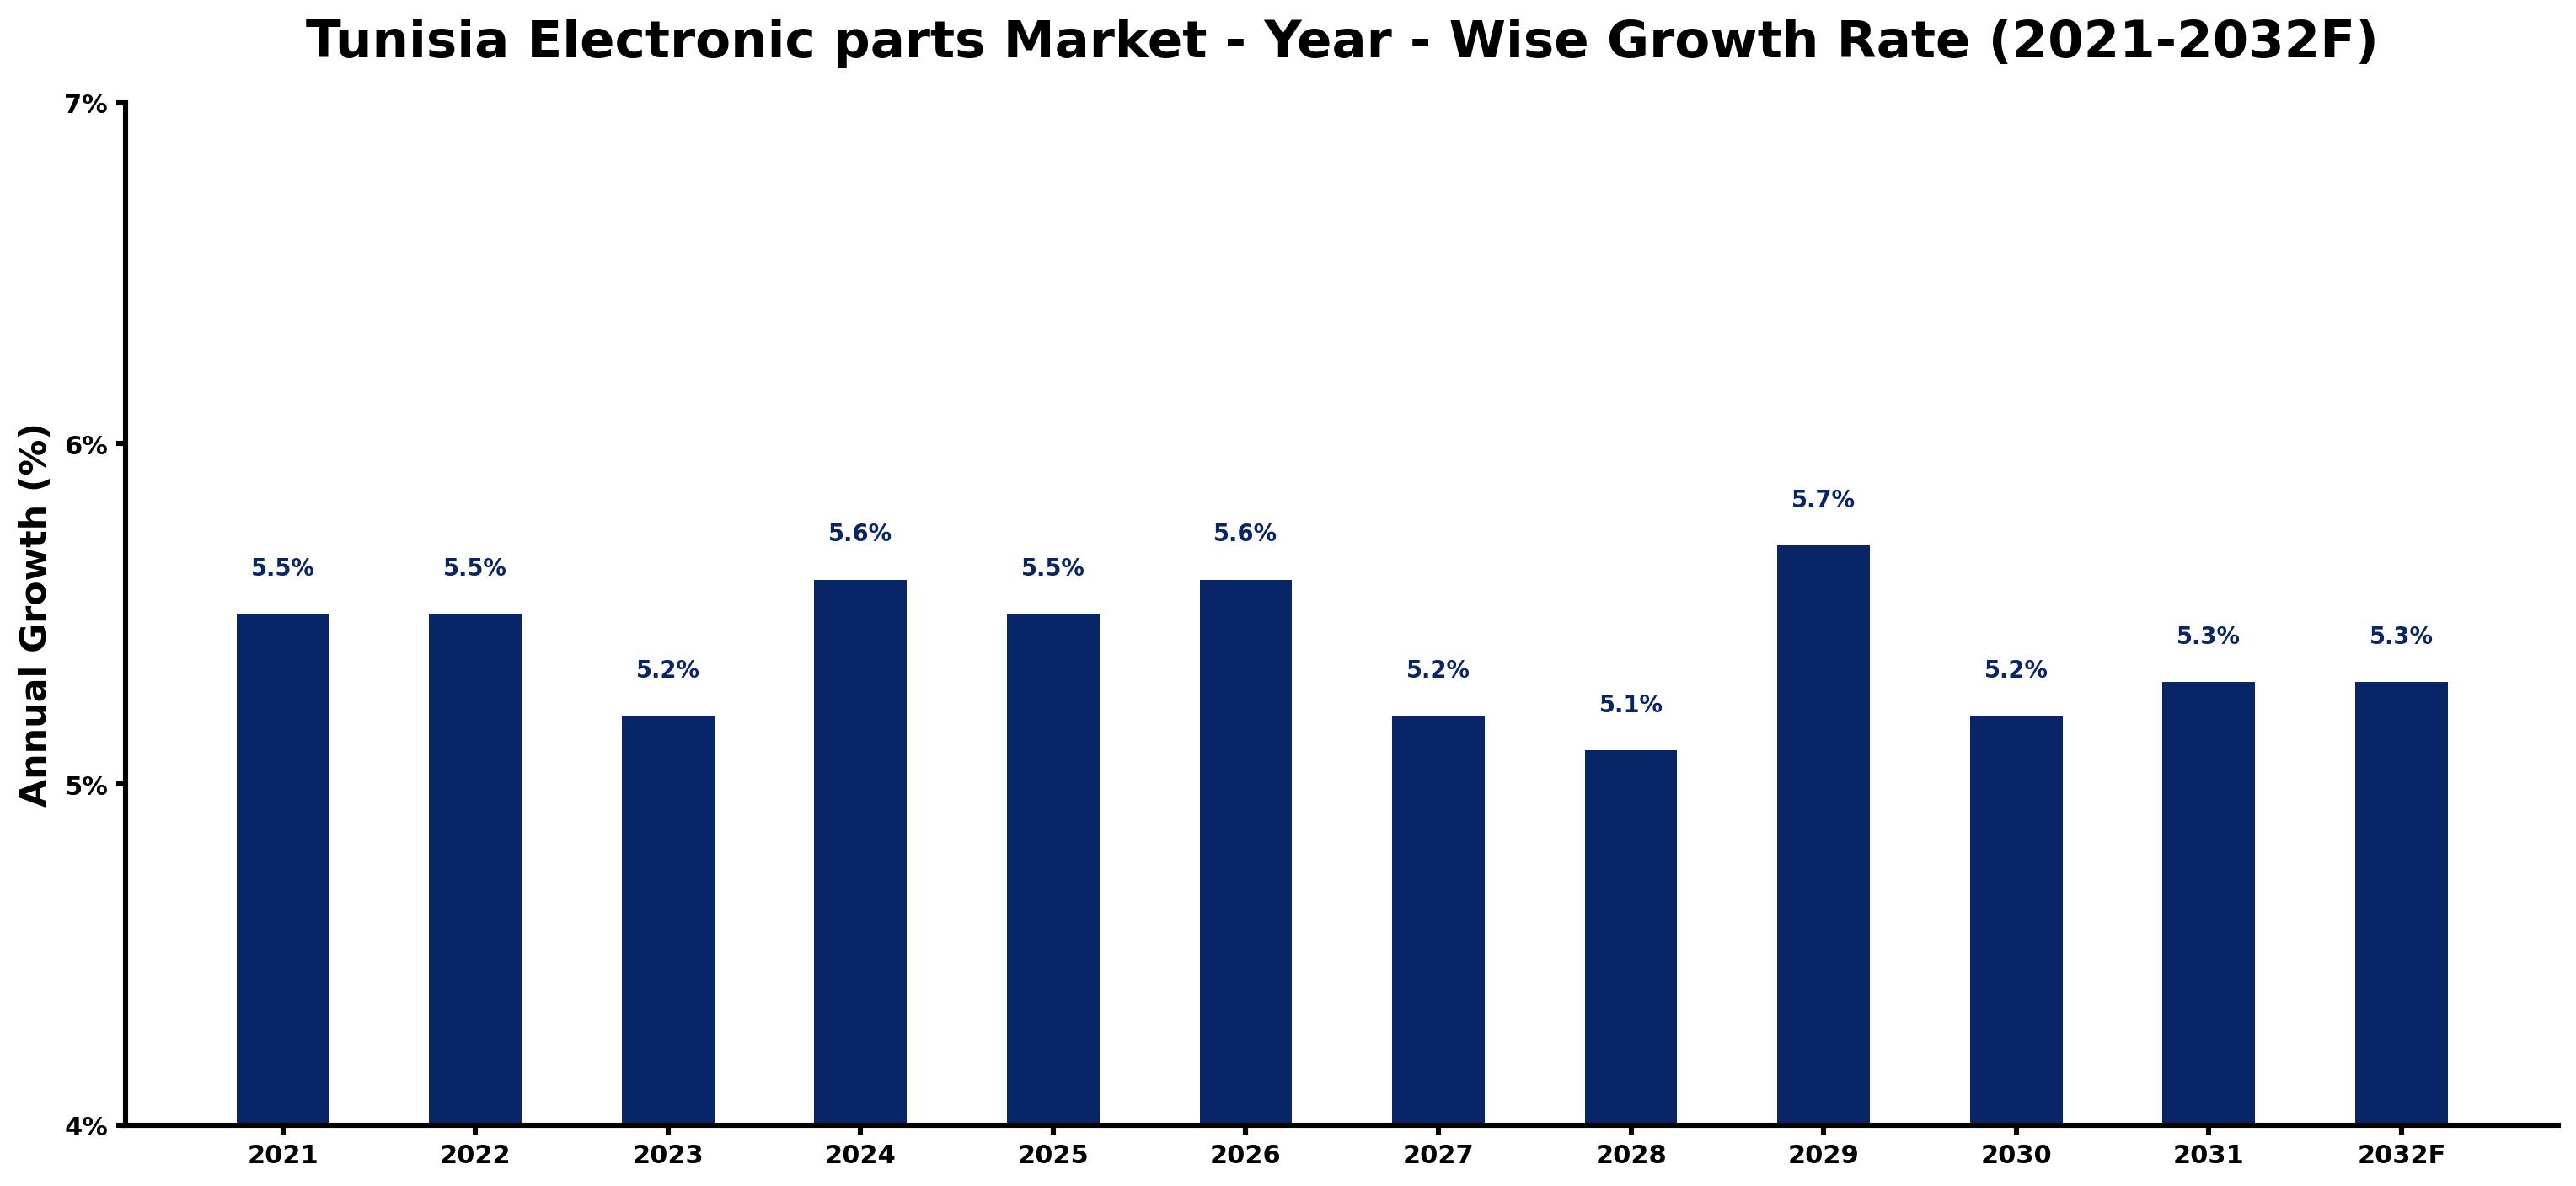
Tunisia Electronic parts Market Growth Rate Analysis (2021-2032)
The Tunisia electronic parts market has exhibited stable growth over recent years, achieving a noteworthy 5.5% growth in both 2021 and 2022. This steady expansion can be attributed to increasing investments in technology and infrastructure, alongside a rising consumer demand for advanced electronic products. However, a slight dip to 5.2% in 2023 was influenced by global supply chain disruptions and a temporary slowdown in production capacities. Looking ahead, growth rebounded to 5.6% in 2024 and is projected to remain resilient, with various years recording growth rates around 5.5%. Drivers such as energy transition initiatives and digitalization efforts are poised to bolster market potential through 2032.
Tunisia Electronic parts Market Year-wise Growth Rate and Key Drivers
This graph highlights how the Tunisia Electronic parts Market has steadily grown over the past five years, supported by major growth factors.
The table below presents the year wise growth rates along with the key drivers influencing the market
| Year | Growth Rate | Major Drivers |
| 2021 | 5.5% | Post-pandemic recovery spurred investments in electronic components and infrastructure projects. |
| 2022 | 5.5% | Local manufacturers began sourcing components to reduce dependency on international imports. |
| 2023 | 5.2% | Emerging tech startups sought innovative electronic solutions, driving further market expansion. |
| 2024 | 5.6% | Transition to renewable energy prompted demand for efficient electronic control systems. |
| 2025 | 5.5% | Rising consumer electronics usage fueled need for advanced electronic parts and components. |
| 2026 | 5.6% | Government incentives encouraged local production of electronic goods and components. |
| 2027 | 5.2% | Increased digitization across sectors prompted investments in electronic hardware upgrades. |
| 2028 | 5.1% | Regional collaborations in tech manufacturing strengthened supply chains and production networks. |
| 2029 | 5.7% | Demand for smart home devices rapidly increased, creating new opportunities in the market. |
| 2030 | 5.2% | Export opportunities in North Africa attracted foreign investments in local electronic production. |
| 2031 | 5.3% | Urbanization trends highlighted the need for advanced electronic infrastructure and services. |
| 2032 | 5.3% | Technological convergence in IoT and automation reshaped the electronic parts landscape. |
Note - Market size estimations and growth projections presented in this report are based on 6Wresearch's advanced forecasting approach, validated with industry datasets as of June 2026.
Tunisia Electronic parts Market Synopsis
The Tunisia Electronic parts Market is projected to reach 5.6% and witness significant growth during the forecast period (2026-2032). The growth trajectory is influenced by a multitude of factors including increasing demand in sectors such as automotive, telecommunications, and consumer electronics. This market is characterized not only by a surge in consumption but also by advancements in technology that necessitate high-quality electronic components.
Tunisia Electronic parts Market Growth Drivers
Several key elements are propelling the Tunisia electronic parts market forward:
- The automotive industry is shifting towards the use of electronic components for functionalities such as safety systems, infotainment, and electric vehicle technologies, which significantly boosts demand.
- A burgeoning telecommunications sector, especially with the rollout of 5G networks, is creating a robust appetite for advanced electronic parts such as semiconductors and connectors.
- Consumer electronics are witnessing a rise in demand, driven by increased disposable income and changing consumer preferences towards smart devices.
- The government's focus on infrastructure development is also enhancing the market, as investments flow into projects that require sophisticated electronic parts.
- Growing adoption of IoT devices is spurring the need for innovative electronic components, further driving the market's expansion.
Tunisia Electronic parts Market Trends and Opportunities
The Tunisia electronic parts market is witnessing several notable trends:
- A clear trend towards miniaturization in electronic components is emerging, leading to increased demand for advanced semiconductors and sensors that offer greater functionality in smaller sizes.
- Energy-efficient and sustainable electronic components are becoming more popular as manufacturers strive to align with global sustainability goals.
- The market is also shifting toward high-performance electronic parts to accommodate the demands of new technologies, including AI and automation.
- There is increasing collaboration between local manufacturers and international firms, fostering innovation and enhancing market competitiveness.
- The rise in online sales and e-commerce platforms is changing the distribution landscape, providing opportunities for new entrants in the market.
Tunisia Electronic parts Market Challenges and Restraints
Despite the growth potential, the Tunisia electronic parts market faces significant challenges:
- There is limited availability of specialized components locally, which often leads to delays and higher costs associated with imports.
- High import tariffs and taxes add to the expense of sourcing electronic components from abroad, impacting pricing and competitiveness.
- Inconsistent supply chain logistics create uncertainty around procurement timelines, complicating inventory management for businesses.
- Currency fluctuations can adversely affect the pricing structure of electronic components, further complicating financial forecasting for local companies.
- Technological obsolescence is a constant threat, pressuring companies to innovate and adapt quickly to stay relevant in a rapidly evolving market.
Tunisia Electronic parts Market Investment Opportunities
Investment within the Tunisia electronic parts market offers various lucrative avenues:
- With significant growth in telecommunications and automotive sectors, there is an urgent need for reliable suppliers of semiconductors, connectors, capacitors, and resistors.
- Investing in the development of locally-manufactured components could enhance production capabilities and reduce reliance on imports.
- Research and development initiatives focused on innovative components for emerging technologies such as electric vehicles and IoT devices are likely to yield long-term growth opportunities.
- Establishing partnerships with local entities or investing in free trade zones could provide businesses with cost advantages and an expanded market reach.
- The push towards smart technologies and automation will continue to present exciting opportunities for investors in the electronic parts landscape.
Tunisia Electronic parts Market Government Investment and Initiatives
The Tunisian government is proactive in fostering the growth of the electronic parts market through various initiatives.
- Tax incentives are being offered to attract foreign investment in the electronics sector, aiming to stimulate local production and innovation.
- Policies supporting research and development activities are being implemented to enhance the competitiveness of local manufacturers.
- Programs focused on upgrading infrastructure are being rolled out, which will directly benefit the supply chain and logistics for electronic components.
- Regulatory frameworks are being established to ensure that product quality and safety standards are maintained across the industry.
- Support mechanisms for local manufacturers are being introduced to help them scale production and expand export capabilities, positioning Tunisia as a competitive player in the global market.
Tunisia Electronic parts Market Latest Developments (May 2025 - June 2026)
Recent developments in the Tunisia electronic parts market indicate a positive trajectory:
- The government has announced further tax incentives to encourage foreign investment, particularly in the automotive electronics segment.
- Several initiatives aimed at public-private partnerships have been launched to foster innovation and enhance research capabilities within local enterprises.
- Investment in infrastructure development continues to receive additional funding, notably in regions earmarked for high-tech industries.
- The demand for components related to the deployment of 5G networks has surged, reflecting the country's commitment to enhancing digital connectivity.
- Increased collaboration between universities and industry stakeholders has begun to yield new research projects focusing on sustainable and energy-efficient electronic components.
Tunisia Electronic parts Market - Key Attractiveness of the Report
- 10 Years of Market Numbers
- Historical Data Starting from 2022 to 2025
- Base Year: 2025
- Forecast Data until 2032
- Key Performance Indicators Impacting the Market
- Major Upcoming Developments and Projects
Key Highlights of the Report:
- Tunisia Electronic parts Market Outlook
- Market Size of Tunisia Electronic parts Market, 2025
- Forecast of Tunisia Electronic parts Market, 2032F
- Historical Data and Forecast of Tunisia Electronic parts Revenues & Volume for the Period 2022-2032F
- Tunisia Electronic parts Market Trend Evolution
- Tunisia Electronic parts Market Drivers and Challenges
- Tunisia Electronic parts Price Trends
- Tunisia Electronic parts Porter's Five Forces
- Tunisia Electronic parts Industry Life Cycle
- Historical Data and Forecast of Tunisia Electronic parts Market Revenues & Volume By Type for the Period 2022-2032F
- Historical Data and Forecast of Tunisia Electronic parts Market Revenues & Volume By Passive for the Period 2022-2032F
- Historical Data and Forecast of Tunisia Electronic parts Market Revenues & Volume By Active for the Period 2022-2032F
- Historical Data and Forecast of Tunisia Electronic parts Market Revenues & Volume By Electro Mechanic for the Period 2022-2032F
- Historical Data and Forecast of Tunisia Electronic parts Market Revenues & Volume By Application for the Period 2022-2032F
- Historical Data and Forecast of Tunisia Electronic parts Market Revenues & Volume By Automotive for the Period 2022-2032F
- Historical Data and Forecast of Tunisia Electronic parts Market Revenues & Volume By Communications for the Period 2022-2032F
- Historical Data and Forecast of Tunisia Electronic parts Market Revenues & Volume By Computing Applications for the Period 2022-2032F
- Historical Data and Forecast of Tunisia Electronic parts Market Revenues & Volume By Others for the Period 2022-2032F
- Tunisia Electronic parts Import Export Trade Statistics
- Market Opportunity Assessment By Type
- Market Opportunity Assessment By Application
- Tunisia Electronic parts Top Companies Market Share
- Tunisia Electronic parts Competitive Benchmarking By Technical and Operational Parameters
- Tunisia Electronic parts Company Profiles
- Tunisia Electronic parts Key Strategic Recommendations
Frequently Asked Questions About the Market Study (FAQs):
The primary drivers include rising demand from the automotive and telecommunications industries, advancements in consumer electronics, and government support for infrastructure development.
Key challenges include high import costs, limited local production capabilities, and currency fluctuations that can impact pricing and supply.
There are opportunities in local manufacturing, R&D for innovative components, and partnerships within free trade zones to capitalize on growing demand.
The government is implementing tax incentives, supporting R&D activities, and establishing regulatory frameworks to promote quality and safety within the industry.
6Wresearch actively monitors the Tunisia Electronic parts Market and publishes its comprehensive annual report, highlighting emerging trends, growth drivers, revenue analysis, and forecast outlook. Our insights help businesses to make data-backed strategic decisions with ongoing market dynamics. Our analysts track relevent industries related to the Tunisia Electronic parts Market, allowing our clients with actionable intelligence and reliable forecasts tailored to emerging regional needs.
Yes, we provide customisation as per your requirements. To learn more, feel free to contact us on sales@6wresearch.com
1 Executive Summary |
2 Introduction |
2.1 Key Highlights of the Report |
2.2 Report Description |
2.3 Market Scope & Segmentation |
2.4 Research Methodology |
2.5 Assumptions |
3 Tunisia Electronic parts Market Overview |
3.1 Tunisia Country Macro Economic Indicators |
3.2 Tunisia Electronic parts Market Revenues & Volume, 2022 & 2032F |
3.3 Tunisia Electronic parts Market - Industry Life Cycle |
3.4 Tunisia Electronic parts Market - Porter's Five Forces |
3.5 Tunisia Electronic parts Market Revenues & Volume Share, By Type, 2022 & 2032F |
3.6 Tunisia Electronic parts Market Revenues & Volume Share, By Application, 2022 & 2032F |
4 Tunisia Electronic parts Market Dynamics |
4.1 Impact Analysis |
4.2 Market Drivers |
4.3 Market Restraints |
5 Tunisia Electronic parts Market Trends |
6 Tunisia Electronic parts Market, By Types |
6.1 Tunisia Electronic parts Market, By Type |
6.1.1 Overview and Analysis |
6.1.2 Tunisia Electronic parts Market Revenues & Volume, By Type, 2022-2032F |
6.1.3 Tunisia Electronic parts Market Revenues & Volume, By Passive, 2022-2032F |
6.1.4 Tunisia Electronic parts Market Revenues & Volume, By Active, 2022-2032F |
6.1.5 Tunisia Electronic parts Market Revenues & Volume, By Electro Mechanic, 2022-2032F |
6.2 Tunisia Electronic parts Market, By Application |
6.2.1 Overview and Analysis |
6.2.2 Tunisia Electronic parts Market Revenues & Volume, By Automotive, 2022-2032F |
6.2.3 Tunisia Electronic parts Market Revenues & Volume, By Communications, 2022-2032F |
6.2.4 Tunisia Electronic parts Market Revenues & Volume, By Computing Applications, 2022-2032F |
6.2.5 Tunisia Electronic parts Market Revenues & Volume, By Others, 2022-2032F |
7 Tunisia Electronic parts Market Import-Export Trade Statistics |
7.1 Tunisia Electronic parts Market Export to Major Countries |
7.2 Tunisia Electronic parts Market Imports from Major Countries |
8 Tunisia Electronic parts Market Key Performance Indicators |
9 Tunisia Electronic parts Market - Opportunity Assessment |
9.1 Tunisia Electronic parts Market Opportunity Assessment, By Type, 2022 & 2032F |
9.2 Tunisia Electronic parts Market Opportunity Assessment, By Application, 2022 & 2032F |
10 Tunisia Electronic parts Market - Competitive Landscape |
10.1 Tunisia Electronic parts Market Revenue Share, By Companies, 2025 |
10.2 Tunisia Electronic parts Market Competitive Benchmarking, By Operating and Technical Parameters |
11 Company Profiles |
12 Recommendations |
13 Disclaimer |
Global Go To Market Strategy - 2030
Export potential enables firms to identify high-growth global markets with greater confidence by combining advanced trade intelligence with a structured quantitative methodology. The framework analyzes emerging demand trends and country-level import patterns while integrating macroeconomic and trade datasets such as GDP and population forecasts, bilateral import–export flows, tariff structures, elasticity differentials between developed and developing economies, geographic distance, and import demand projections. Using weighted trade values from 2020–2024 as the base period to project country-to-country export potential for 2030, these inputs are operationalized through calculated drivers such as gravity model parameters, tariff impact factors, and projected GDP per-capita growth. Through an analysis of hidden potentials, demand hotspots, and market conditions that are most favorable to success, this method enables firms to focus on target countries, maximize returns, and global expansion with data, backed by accuracy.
By factoring in the projected importer demand gap that is currently unmet and could be potential opportunity, it identifies the potential for the Exporter (Country) among 190 countries, against the general trade analysis, which identifies the biggest importer or exporter.
To discover high-growth global markets and optimize your business strategy:
Click Here
Pricing
- Single User License$ 1,995
- Department License$ 2,400
- Site License$ 3,120
- Global License$ 3,795

Leadership Perspectives from Industry Events
Search
Thought Leadership and Analyst Meet


Our Clients
6WResearch In News
- India Air Conditioner Market Set for Strong Rebound in 2026 After Weather-Led Correction and GST-Driven Recovery: 6Wresearch
- ADAS in India: How Automatic Emergency Braking, Blind Spot Detection & Driver Monitoring are Transforming Road Safety
- Doha a strategic location for EV manufacturing hub: IPA Qatar
- Demand for luxury TVs surging in the GCC, says Samsung
- Empowering Growth: The Thriving Journey of Bangladesh’s Cable Industry
- Demand for luxury TVs surging in the GCC, says Samsung
Latest Reports
- Nicaragua RPG Gaming Market (2026-2032)
- New Zealand RPG Gaming Market (2026-2032)
- Netherlands RPG Gaming Market (2026-2032)
- Nauru RPG Gaming Market (2026-2032)
- Namibia RPG Gaming Market (2026-2032)
- Mozambique RPG Gaming Market (2026-2032)
- Montenegro RPG Gaming Market (2026-2032)
- Mongolia RPG Gaming Market (2026-2032)
- Monaco RPG Gaming Market (2026-2032)
- Micronesia RPG Gaming Market (2026-2032)
Industry Events and Analyst Meet

HIMTEX 2026

India Refining Summit 2026

India EV Show 2026

EV tech India Expo 2026

Auto Tech Asia 2026
Whitepaper
- Middle East & Africa Commercial Security Market Click here to view more.
- Middle East & Africa Fire Safety Systems & Equipment Market Click here to view more.
- GCC Drone Market Click here to view more.
- Middle East Lighting Fixture Market Click here to view more.
- GCC Physical & Perimeter Security Market Click here to view more.