Tunisia Inorganic Pigments Market (2026-2032) Outlook | Growth, Industry, Size, Value, Forecast, Analysis, Share, Revenue, Companies & Trends
Market Forecast By Type (Titanium Dioxide, Iron Oxide, Cadmium, Carbon Blank, Lead Chromate, Chromium Oxide, Others), By Colour (Red, Yellow, Orange, Green, Blue, Black, White, Others), By Chemistry (Oxide, Silicate, Carbonate, Sulphate, Sulphide, Others), By Grade (Food Grade, Pharmaceutical Grade, Industrial Grade, Others), By Form (Powder, Liquid), By Application (Plastics, Paints & Coatings, Printing Inks, Glass & Ceramics, Cosmetics, Paper Industry, Food Industry, Others) And Competitive Landscape
| Product Code: ETC190566 | Publication Date: May 2022 | Updated Date: Jun 2026 | Product Type: Market Research Report | |
| Publisher: 6Wresearch | Author: Ravi Bhandari | No. of Pages: 60 | No. of Figures: 40 | No. of Tables: 7 |
Tunisia Inorganic Pigments Market Size, Share & Growth Rate
The Tunisia Inorganic Pigments Market was estimated at USD 179 Million in 2025 and is projected to reach USD 238 Million by 2032, growing at a CAGR of 4.2% from 2026 to 2032. This upward trajectory is largely driven by the increasing demand for eco-friendly and sustainable pigments in various sectors, including construction, automotive, and plastics. Furthermore, government initiatives promoting non-toxic formulations are bolstering the market's growth and encouraging manufacturers to innovate.
Tunisia Inorganic Pigments Market Year-wise Growth Rate and Key Drivers
This graph highlights how the Tunisia Inorganic Pigments Market has steadily grown over the years, supported by major growth factors.
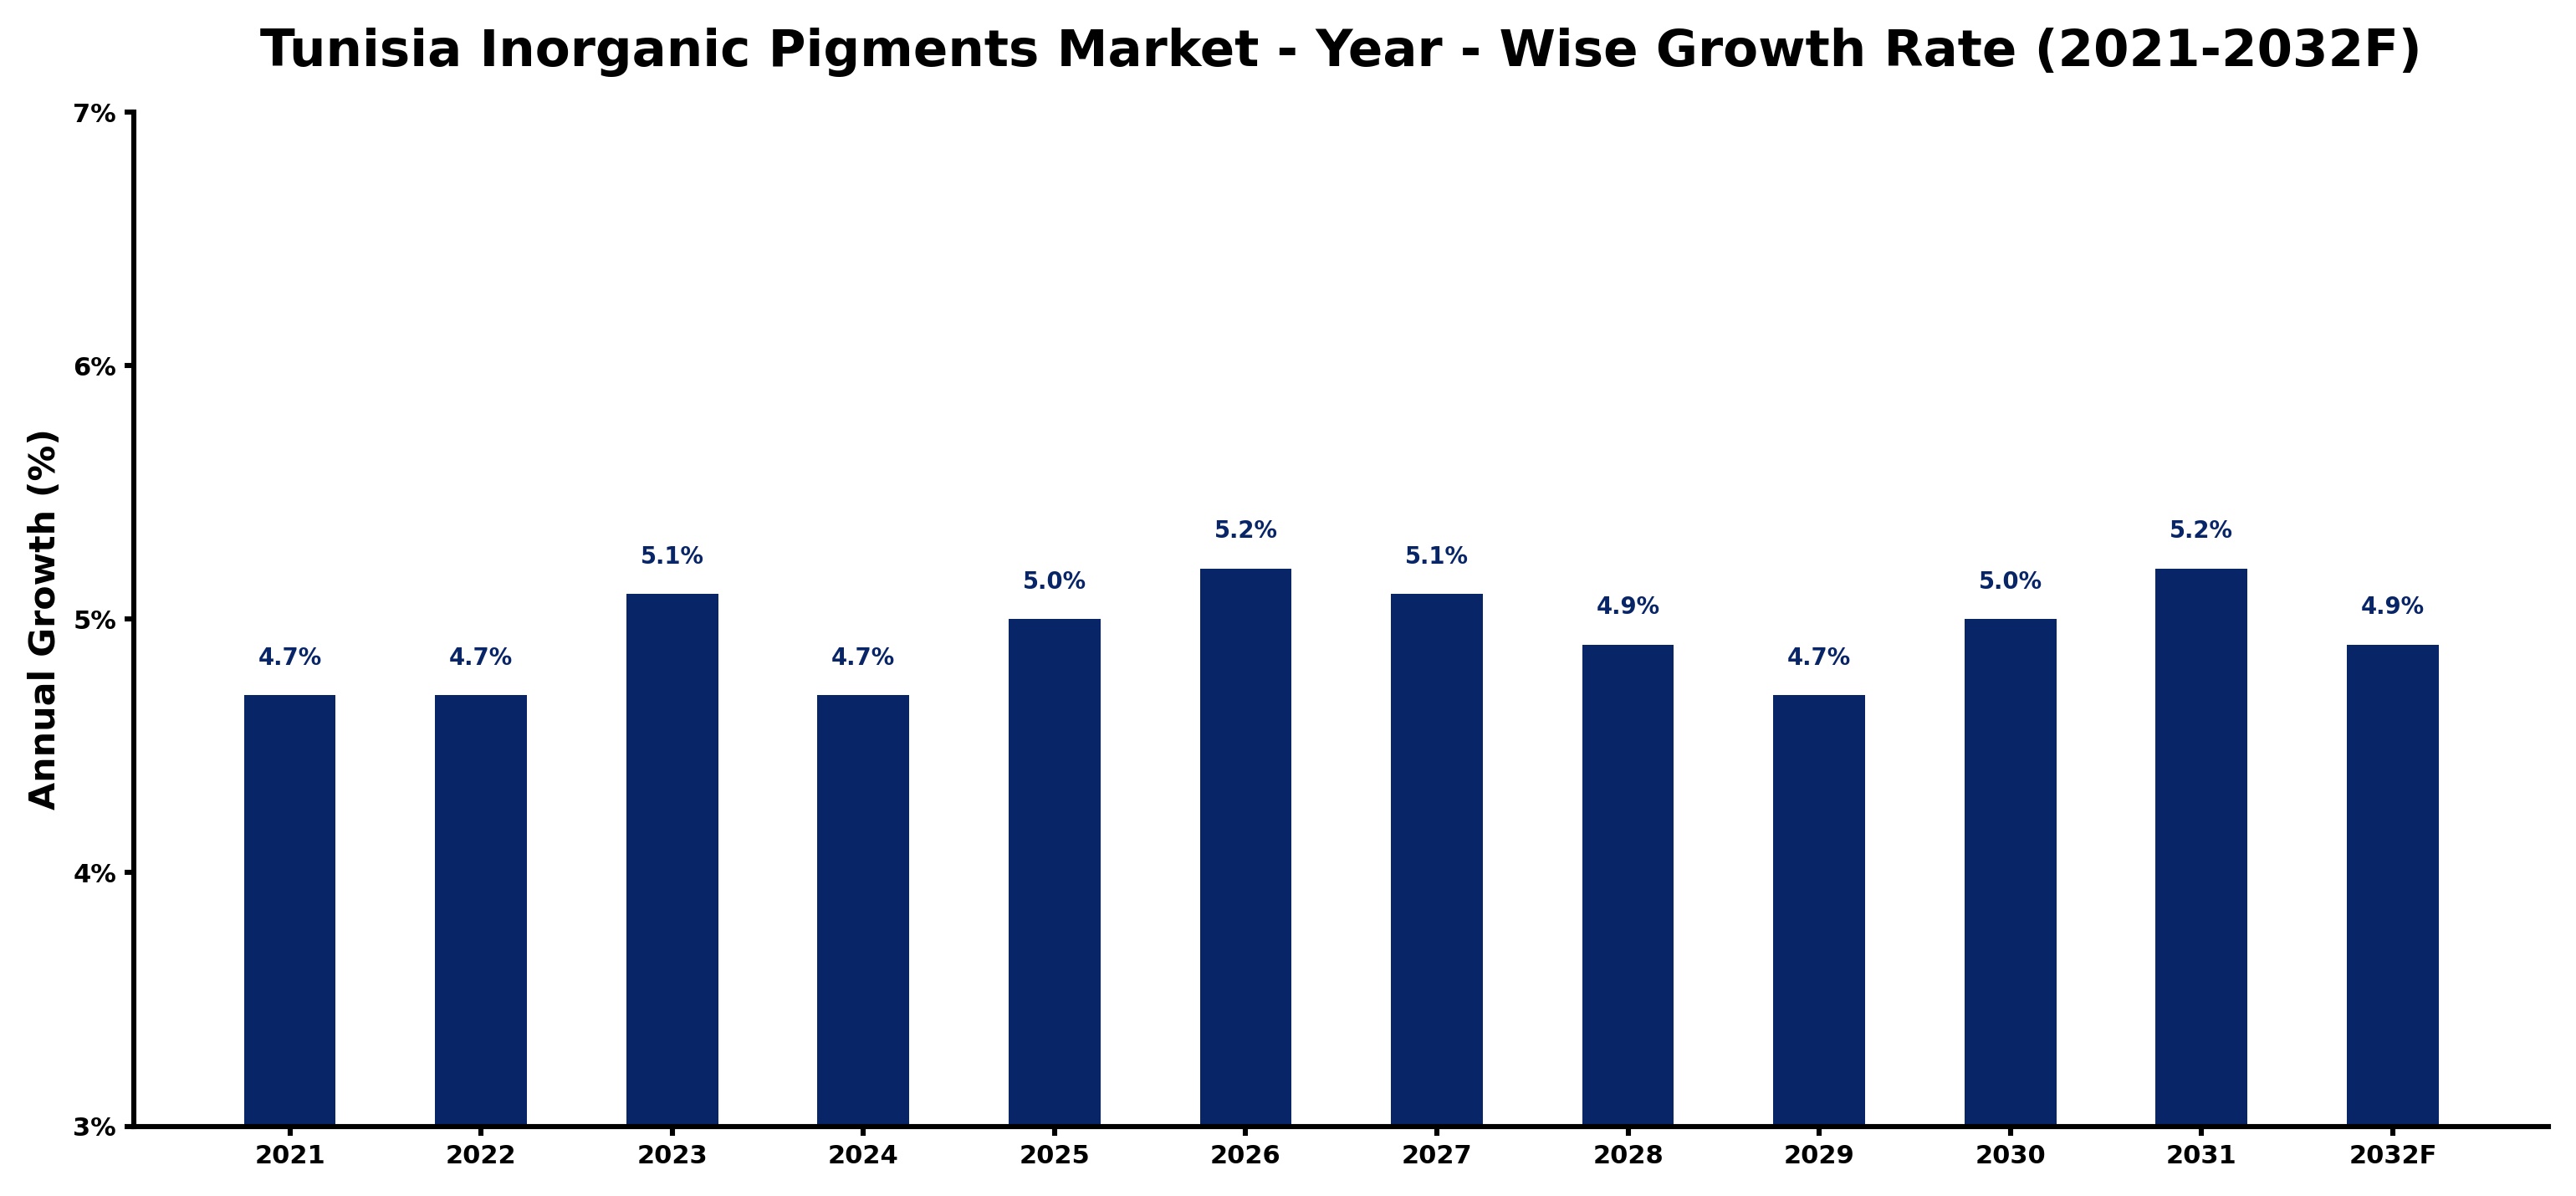
The table below presents the year‑wise growth rates along with the key drivers influencing the market
| Year | Growth Rate | Major Drivers |
| 2021 | 4.7% | Construction sector demand increased significantly |
| 2022 | 4.7% | Automotive industry growth stimulated demand |
| 2023 | 5.1% | Paint and coatings market expanded |
| 2024 | 4.7% | Consumer electronics production increased |
| 2025 | 5.0% | Agricultural applications gained traction |
| 2026 | 5.2% | Textile industry growth enhanced usage |
| 2027 | 5.1% | Infrastructure projects boosted consumption |
| 2028 | 4.9% | Renewable energy sector expanded applications |
| 2029 | 4.7% | Cosmetics industry growth drove demand |
| 2030 | 5.0% | Packaging industry adoption increased |
| 2031 | 5.2% | 3D printing technology advanced usage |
| 2032 | 4.9% | Pharmaceutical applications gained prominence |
Note - Market size estimations and growth projections presented in this report are based on 6Wresearch’s advanced forecasting approach, validated with industry datasets as of June 2026.
Tunisia Inorganic Pigments Market Synopsis
The Tunisian inorganic pigments market is witnessing transformative changes, influenced by a growing emphasis on sustainability and eco-conscious production processes. With applications spanning from construction materials to automotive coatings, the need for high-quality, durable pigments is increasingly recognized.
Currently, the market is adapting to the challenges of sourcing high-quality raw materials while responding to the demand for advanced manufacturing techniques. Notably, government support in the form of incentives for eco-friendly products is poised to further enhance the market landscape.
Tunisia Inorganic Pigments Market Key Takeaways
- The market is set for significant growth driven by sustainable applications across various industries.
- Government initiatives are promoting research and development in eco-friendly pigment technologies.
- The focus on high-quality raw materials is essential for competitive pricing and product durability.
- Increased awareness of environmental impact is influencing consumer preferences and market trends.
- Ongoing investment in R&D will be critical for overcoming production challenges.
Evaluation of Restraints in Tunisia Inorganic Pigments Market
Despite the promising outlook, the Tunisia Inorganic Pigments Market faces considerable challenges, primarily centered around high production costs and the need for advanced manufacturing capabilities. Producers are often hindered by the fluctuating availability of quality raw materials, which directly impacts their ability to deliver competitively priced products. Additionally, the industry's reliance on innovative research and development is critical; without sufficient investment in this area, the market may struggle to meet evolving consumer demands and technological advancements.
Tunisia Inorganic Pigments Market Trends
Current trends indicate a strong shift towards environmentally friendly pigment solutions, driven by both consumer preferences and regulatory mandates. Innovations in pigment formulations that utilize non-toxic substances are becoming increasingly prevalent. Furthermore, the integration of digital technologies in manufacturing processes is enhancing product quality and operational efficiency, thereby positioning Tunisian companies as competitive players in the global market.
Tunisia Inorganic Pigments Market Opportunities
The most promising growth opportunities in the Tunisia Inorganic Pigments Market lie in developing advanced, sustainable products that meet international safety and environmental standards. Investment in technology that reduces production costs while improving product quality will allow manufacturers to cater to emerging sectors such as renewable energy and green construction. Furthermore, the potential for export to neighboring markets presents an avenue for increased revenue and market expansion.
Government Initiatives in the Tunisia Inorganic Pigments Market
The Tunisian government is actively promoting initiatives aimed at fostering sustainable practices within the inorganic pigments market. Policies have been implemented to provide financial incentives for companies focused on developing environmentally friendly products. Additionally, the government supports research and development efforts that align with international environmental standards, thereby enhancing compliance and encouraging innovation among local manufacturers.
Future Insights of the Tunisia Inorganic Pigments Market
Looking ahead to the period from 2026 to 2032, the Tunisia Inorganic Pigments Market is anticipated to evolve significantly. The increasing demand for sustainable and high-quality pigments will drive manufacturers to prioritize innovation and efficiency. Additionally, as public awareness around environmental issues grows, companies that effectively align their practices with sustainability will likely gain a competitive edge. The integration of advanced technologies in production and the strengthening of regulatory frameworks will further solidify the market's growth trajectory.
Tunisia Inorganic Pigments Market Latest Developments (May 2025 - June 2026)
Recent developments within the Tunisia Inorganic Pigments Market highlight a concerted effort among manufacturers to diversify their product offerings and enhance sustainability. Companies are increasingly collaborating with research institutions to innovate new pigment formulations that meet the demands of eco-conscious consumers. Additionally, the market has seen a rise in investments aimed at upgrading manufacturing processes to reduce environmental impact and improve product efficacy.
Tunisia Inorganic Pigments Market - Key Attractiveness of the Report
- 10 Years of Market Numbers
- Historical Data Starting from 2022 to 2025
- Base Year: 2025
- Forecast Data until 2032
- Key Performance Indicators Impacting the Market
- Major Upcoming Developments and Projects
Key Highlights of the Report:
- Tunisia Inorganic Pigments Market Outlook
- Market Size of Tunisia Inorganic Pigments Market, 2025
- Forecast of Tunisia Inorganic Pigments Market, 2032
- Historical Data and Forecast of Tunisia Inorganic Pigments Revenues & Volume for the Period 2022-2032F
- Tunisia Inorganic Pigments Market Trend Evolution
- Tunisia Inorganic Pigments Market Drivers and Challenges
- Tunisia Inorganic Pigments Price Trends
- Tunisia Inorganic Pigments Porter's Five Forces
- Tunisia Inorganic Pigments Industry Life Cycle
- Historical Data and Forecast of Tunisia Inorganic Pigments Market Revenues & Volume By Type for the Period 2022-2032F
- Historical Data and Forecast of Tunisia Inorganic Pigments Market Revenues & Volume By Titanium Dioxide for the Period 2022-2032F
- Historical Data and Forecast of Tunisia Inorganic Pigments Market Revenues & Volume By Iron Oxide, Cadmium for the Period 2022-2032F
- Historical Data and Forecast of Tunisia Inorganic Pigments Market Revenues & Volume By Carbon Blank for the Period 2022-2032F
- Historical Data and Forecast of Tunisia Inorganic Pigments Market Revenues & Volume By Lead Chromate for the Period 2022-2032F
- Historical Data and Forecast of Tunisia Inorganic Pigments Market Revenues & Volume By Chromium Oxide for the Period 2022-2032F
- Historical Data and Forecast of Tunisia Inorganic Pigments Market Revenues & Volume By Others for the Period 2022-2032F
- Historical Data and Forecast of Tunisia Inorganic Pigments Market Revenues & Volume By Colour for the Period 2022-2032F
- Historical Data and Forecast of Tunisia Inorganic Pigments Market Revenues & Volume By Red for the Period 2022-2032F
- Historical Data and Forecast of Tunisia Inorganic Pigments Market Revenues & Volume By Yellow for the Period 2022-2032F
- Historical Data and Forecast of Tunisia Inorganic Pigments Market Revenues & Volume By Orange for the Period 2022-2032F
- Historical Data and Forecast of Tunisia Inorganic Pigments Market Revenues & Volume By Green for the Period 2022-2032F
- Historical Data and Forecast of Tunisia Inorganic Pigments Market Revenues & Volume By Blue for the Period 2022-2032F
- Historical Data and Forecast of Tunisia Inorganic Pigments Market Revenues & Volume By Black for the Period 2022-2032F
- Historical Data and Forecast of Tunisia Inorganic Pigments Market Revenues & Volume By White for the Period 2022-2032F
- Historical Data and Forecast of Tunisia Inorganic Pigments Market Revenues & Volume By Others for the Period 2022-2032F
- Historical Data and Forecast of Tunisia Inorganic Pigments Market Revenues & Volume By Chemistry for the Period 2022-2032F
- Historical Data and Forecast of Tunisia Inorganic Pigments Market Revenues & Volume By Oxide for the Period 2022-2032F
- Historical Data and Forecast of Tunisia Inorganic Pigments Market Revenues & Volume By Silicate for the Period 2022-2032F
- Historical Data and Forecast of Tunisia Inorganic Pigments Market Revenues & Volume By Carbonate for the Period 2022-2032F
- Historical Data and Forecast of Tunisia Inorganic Pigments Market Revenues & Volume By Sulphate for the Period 2022-2032F
- Historical Data and Forecast of Tunisia Inorganic Pigments Market Revenues & Volume By Sulphide for the Period 2022-2032F
- Historical Data and Forecast of Tunisia Inorganic Pigments Market Revenues & Volume By Others for the Period 2022-2032F
- Historical Data and Forecast of Tunisia Inorganic Pigments Market Revenues & Volume By Grade for the Period 2022-2032F
- Historical Data and Forecast of Tunisia Inorganic Pigments Market Revenues & Volume By Food Grade for the Period 2022-2032F
- Historical Data and Forecast of Tunisia Inorganic Pigments Market Revenues & Volume By Pharmaceutical Grade for the Period 2022-2032F
- Historical Data and Forecast of Tunisia Inorganic Pigments Market Revenues & Volume By Industrial Grade for the Period 2022-2032F
- Historical Data and Forecast of Tunisia Inorganic Pigments Market Revenues & Volume By Others for the Period 2022-2032F
- Historical Data and Forecast of Tunisia Inorganic Pigments Market Revenues & Volume By Form for the Period 2022-2032F
- Historical Data and Forecast of Tunisia Inorganic Pigments Market Revenues & Volume By Powder for the Period 2022-2032F
- Historical Data and Forecast of Tunisia Inorganic Pigments Market Revenues & Volume By Liquid for the Period 2022-2032F
- Historical Data and Forecast of Tunisia Inorganic Pigments Market Revenues & Volume By Application for the Period 2022-2032F
- Historical Data and Forecast of Tunisia Inorganic Pigments Market Revenues & Volume By Plastics for the Period 2022-2032F
- Historical Data and Forecast of Tunisia Inorganic Pigments Market Revenues & Volume By Paints & Coatings for the Period 2022-2032F
- Historical Data and Forecast of Tunisia Inorganic Pigments Market Revenues & Volume By Printing Inks for the Period 2022-2032F
- Historical Data and Forecast of Tunisia Inorganic Pigments Market Revenues & Volume By Glass & Ceramics for the Period 2022-2032F
- Historical Data and Forecast of Tunisia Inorganic Pigments Market Revenues & Volume By Cosmetics for the Period 2022-2032F
- Historical Data and Forecast of Tunisia Inorganic Pigments Market Revenues & Volume By Paper Industry for the Period 2022-2032F
- Historical Data and Forecast of Tunisia Inorganic Pigments Market Revenues & Volume By Food Industry for the Period 2022-2032F
- Historical Data and Forecast of Tunisia Inorganic Pigments Market Revenues & Volume By Others for the Period 2022-2032F
- Tunisia Inorganic Pigments Import Export Trade Statistics
- Market Opportunity Assessment By Type
- Market Opportunity Assessment By Colour
- Market Opportunity Assessment By Chemistry
- Market Opportunity Assessment By Grade
- Market Opportunity Assessment By Form
- Market Opportunity Assessment By Application
- Tunisia Inorganic Pigments Top Companies Market Share
- Tunisia Inorganic Pigments Competitive Benchmarking By Technical and Operational Parameters
- Tunisia Inorganic Pigments Company Profiles
- Tunisia Inorganic Pigments Key Strategic Recommendations
Tunisia Inorganic Pigments Market - Frequently Asked Questions
The market is projected to grow from USD 179 Million in 2025 to USD 238 Million by 2032, reflecting a CAGR of 4.2% during the 2026 to 2032 period.
Government policies are pivotal, as they provide incentives for companies to develop sustainable, eco-friendly pigment formulations, ensuring compliance with international safety standards.
Key applications include construction materials, automotive coatings, and various plastic products, where durable and sustainable pigments are increasingly sought after.
Manufacturers struggle with high production costs and the need for advanced technology, particularly in sourcing quality raw materials at competitive prices.
Growing environmental awareness is shifting consumer preferences towards eco-friendly products, prompting manufacturers to innovate and comply with stricter regulations.
The market is likely to see increased investment in sustainable production technologies and the integration of digital advancements that enhance operational efficiencies.
6Wresearch actively monitors the Tunisia Inorganic Pigments Market and publishes its comprehensive annual report, highlighting emerging trends, growth drivers, revenue analysis, and forecast outlook. Our insights help businesses to make data-backed strategic decisions with ongoing market dynamics. Our analysts track relevent industries related to the Tunisia Inorganic Pigments Market, allowing our clients with actionable intelligence and reliable forecasts tailored to emerging regional needs.
Yes, we provide customisation as per your requirements. To learn more, feel free to contact us on sales@6wresearch.com
1 Executive Summary |
2 Introduction |
2.1 Key Highlights of the Report |
2.2 Report Description |
2.3 Market Scope & Segmentation |
2.4 Research Methodology |
2.5 Assumptions |
3 Tunisia Inorganic Pigments Market Overview |
3.1 Tunisia Country Macro Economic Indicators |
3.2 Tunisia Inorganic Pigments Market Revenues & Volume, 2022 & 2032F |
3.3 Tunisia Inorganic Pigments Market - Industry Life Cycle |
3.4 Tunisia Inorganic Pigments Market - Porter's Five Forces |
3.5 Tunisia Inorganic Pigments Market Revenues & Volume Share, By Type, 2022 & 2032F |
3.6 Tunisia Inorganic Pigments Market Revenues & Volume Share, By Colour, 2022 & 2032F |
3.7 Tunisia Inorganic Pigments Market Revenues & Volume Share, By Chemistry, 2022 & 2032F |
3.8 Tunisia Inorganic Pigments Market Revenues & Volume Share, By Grade, 2022 & 2032F |
3.9 Tunisia Inorganic Pigments Market Revenues & Volume Share, By Form, 2022 & 2032F |
3.10 Tunisia Inorganic Pigments Market Revenues & Volume Share, By Application, 2022 & 2032F |
4 Tunisia Inorganic Pigments Market Dynamics |
4.1 Impact Analysis |
4.2 Market Drivers |
4.2.1 Increasing demand for inorganic pigments in various industries such as construction, automotive, and packaging due to their durability and color stability. |
4.2.2 Growth in the construction sector in Tunisia leading to higher consumption of inorganic pigments for paints, coatings, and plastics. |
4.2.3 Technological advancements in the production of inorganic pigments leading to improved quality and performance. |
4.3 Market Restraints |
4.3.1 Fluctuating raw material prices impacting the cost of production of inorganic pigments. |
4.3.2 Stringent regulations regarding the use of certain chemicals in inorganic pigments affecting market growth. |
4.3.3 Competition from alternative organic pigments in certain applications affecting market share. |
5 Tunisia Inorganic Pigments Market Trends |
6 Tunisia Inorganic Pigments Market, By Types |
6.1 Tunisia Inorganic Pigments Market, By Type |
6.1.1 Overview and Analysis |
6.1.2 Tunisia Inorganic Pigments Market Revenues & Volume, By Type, 2022-2032F |
6.1.3 Tunisia Inorganic Pigments Market Revenues & Volume, By Titanium Dioxide, 2022-2032F |
6.1.4 Tunisia Inorganic Pigments Market Revenues & Volume, By Iron Oxide, Cadmium, 2022-2032F |
6.1.5 Tunisia Inorganic Pigments Market Revenues & Volume, By Carbon Blank, 2022-2032F |
6.1.6 Tunisia Inorganic Pigments Market Revenues & Volume, By Lead Chromate, 2022-2032F |
6.1.7 Tunisia Inorganic Pigments Market Revenues & Volume, By Chromium Oxide, 2022-2032F |
6.1.8 Tunisia Inorganic Pigments Market Revenues & Volume, By Others, 2022-2032F |
6.2 Tunisia Inorganic Pigments Market, By Colour |
6.2.1 Overview and Analysis |
6.2.2 Tunisia Inorganic Pigments Market Revenues & Volume, By Red, 2022-2032F |
6.2.3 Tunisia Inorganic Pigments Market Revenues & Volume, By Yellow, 2022-2032F |
6.2.4 Tunisia Inorganic Pigments Market Revenues & Volume, By Orange, 2022-2032F |
6.2.5 Tunisia Inorganic Pigments Market Revenues & Volume, By Green, 2022-2032F |
6.2.6 Tunisia Inorganic Pigments Market Revenues & Volume, By Blue, 2022-2032F |
6.2.7 Tunisia Inorganic Pigments Market Revenues & Volume, By Black, 2022-2032F |
6.2.8 Tunisia Inorganic Pigments Market Revenues & Volume, By Others, 2022-2032F |
6.2.9 Tunisia Inorganic Pigments Market Revenues & Volume, By Others, 2022-2032F |
6.3 Tunisia Inorganic Pigments Market, By Chemistry |
6.3.1 Overview and Analysis |
6.3.2 Tunisia Inorganic Pigments Market Revenues & Volume, By Oxide, 2022-2032F |
6.3.3 Tunisia Inorganic Pigments Market Revenues & Volume, By Silicate, 2022-2032F |
6.3.4 Tunisia Inorganic Pigments Market Revenues & Volume, By Carbonate, 2022-2032F |
6.3.5 Tunisia Inorganic Pigments Market Revenues & Volume, By Sulphate, 2022-2032F |
6.3.6 Tunisia Inorganic Pigments Market Revenues & Volume, By Sulphide, 2022-2032F |
6.3.7 Tunisia Inorganic Pigments Market Revenues & Volume, By Others, 2022-2032F |
6.4 Tunisia Inorganic Pigments Market, By Grade |
6.4.1 Overview and Analysis |
6.4.2 Tunisia Inorganic Pigments Market Revenues & Volume, By Food Grade, 2022-2032F |
6.4.3 Tunisia Inorganic Pigments Market Revenues & Volume, By Pharmaceutical Grade, 2022-2032F |
6.4.4 Tunisia Inorganic Pigments Market Revenues & Volume, By Industrial Grade, 2022-2032F |
6.4.5 Tunisia Inorganic Pigments Market Revenues & Volume, By Others, 2022-2032F |
6.5 Tunisia Inorganic Pigments Market, By Form |
6.5.1 Overview and Analysis |
6.5.2 Tunisia Inorganic Pigments Market Revenues & Volume, By Powder, 2022-2032F |
6.5.3 Tunisia Inorganic Pigments Market Revenues & Volume, By Liquid, 2022-2032F |
6.6 Tunisia Inorganic Pigments Market, By Application |
6.6.1 Overview and Analysis |
6.6.2 Tunisia Inorganic Pigments Market Revenues & Volume, By Plastics, 2022-2032F |
6.6.3 Tunisia Inorganic Pigments Market Revenues & Volume, By Paints & Coatings, 2022-2032F |
6.6.4 Tunisia Inorganic Pigments Market Revenues & Volume, By Printing Inks, 2022-2032F |
6.6.5 Tunisia Inorganic Pigments Market Revenues & Volume, By Glass & Ceramics, 2022-2032F |
6.6.6 Tunisia Inorganic Pigments Market Revenues & Volume, By Cosmetics, 2022-2032F |
6.6.7 Tunisia Inorganic Pigments Market Revenues & Volume, By Paper Industry, 2022-2032F |
6.6.8 Tunisia Inorganic Pigments Market Revenues & Volume, By Others, 2022-2032F |
6.6.9 Tunisia Inorganic Pigments Market Revenues & Volume, By Others, 2022-2032F |
7 Tunisia Inorganic Pigments Market Import-Export Trade Statistics |
7.1 Tunisia Inorganic Pigments Market Export to Major Countries |
7.2 Tunisia Inorganic Pigments Market Imports from Major Countries |
8 Tunisia Inorganic Pigments Market Key Performance Indicators |
8.1 Research and development investment in new inorganic pigment formulations. |
8.2 Adoption rate of eco-friendly and sustainable inorganic pigment options. |
8.3 Percentage of market penetration in emerging applications such as electronics and healthcare. |
9 Tunisia Inorganic Pigments Market - Opportunity Assessment |
9.1 Tunisia Inorganic Pigments Market Opportunity Assessment, By Type, 2022 & 2032F |
9.2 Tunisia Inorganic Pigments Market Opportunity Assessment, By Colour, 2022 & 2032F |
9.3 Tunisia Inorganic Pigments Market Opportunity Assessment, By Chemistry, 2022 & 2032F |
9.4 Tunisia Inorganic Pigments Market Opportunity Assessment, By Grade, 2022 & 2032F |
9.5 Tunisia Inorganic Pigments Market Opportunity Assessment, By Form, 2022 & 2032F |
9.6 Tunisia Inorganic Pigments Market Opportunity Assessment, By Application, 2022 & 2032F |
10 Tunisia Inorganic Pigments Market - Competitive Landscape |
10.1 Tunisia Inorganic Pigments Market Revenue Share, By Companies, 2025 |
10.2 Tunisia Inorganic Pigments Market Competitive Benchmarking, By Operating and Technical Parameters |
11 Company Profiles |
12 Recommendations |
13 Disclaimer |
Global Go To Market Strategy - 2030
Export potential enables firms to identify high-growth global markets with greater confidence by combining advanced trade intelligence with a structured quantitative methodology. The framework analyzes emerging demand trends and country-level import patterns while integrating macroeconomic and trade datasets such as GDP and population forecasts, bilateral import–export flows, tariff structures, elasticity differentials between developed and developing economies, geographic distance, and import demand projections. Using weighted trade values from 2020–2024 as the base period to project country-to-country export potential for 2030, these inputs are operationalized through calculated drivers such as gravity model parameters, tariff impact factors, and projected GDP per-capita growth. Through an analysis of hidden potentials, demand hotspots, and market conditions that are most favorable to success, this method enables firms to focus on target countries, maximize returns, and global expansion with data, backed by accuracy.
By factoring in the projected importer demand gap that is currently unmet and could be potential opportunity, it identifies the potential for the Exporter (Country) among 190 countries, against the general trade analysis, which identifies the biggest importer or exporter.
To discover high-growth global markets and optimize your business strategy:
Click Here
Pricing
- Single User License$ 1,995
- Department License$ 2,400
- Site License$ 3,120
- Global License$ 3,795

Leadership Perspectives from Industry Events
Search
Thought Leadership and Analyst Meet


Our Clients
6WResearch In News
- India Air Conditioner Market Set for Strong Rebound in 2026 After Weather-Led Correction and GST-Driven Recovery: 6Wresearch
- ADAS in India: How Automatic Emergency Braking, Blind Spot Detection & Driver Monitoring are Transforming Road Safety
- Doha a strategic location for EV manufacturing hub: IPA Qatar
- Demand for luxury TVs surging in the GCC, says Samsung
- Empowering Growth: The Thriving Journey of Bangladesh’s Cable Industry
- Demand for luxury TVs surging in the GCC, says Samsung
Latest Reports
- Nicaragua RPG Gaming Market (2026-2032)
- New Zealand RPG Gaming Market (2026-2032)
- Netherlands RPG Gaming Market (2026-2032)
- Nauru RPG Gaming Market (2026-2032)
- Namibia RPG Gaming Market (2026-2032)
- Mozambique RPG Gaming Market (2026-2032)
- Montenegro RPG Gaming Market (2026-2032)
- Mongolia RPG Gaming Market (2026-2032)
- Monaco RPG Gaming Market (2026-2032)
- Micronesia RPG Gaming Market (2026-2032)
Industry Events and Analyst Meet

EV India Expo 2026

HIMTEX 2026

India Refining Summit 2026

India EV Show 2026

EV tech India Expo 2026
Whitepaper
- Middle East & Africa Commercial Security Market Click here to view more.
- Middle East & Africa Fire Safety Systems & Equipment Market Click here to view more.
- GCC Drone Market Click here to view more.
- Middle East Lighting Fixture Market Click here to view more.
- GCC Physical & Perimeter Security Market Click here to view more.