Tunisia Inorganic salts Market (2026-2032) Outlook | Analysis, Industry, Share, Growth, Companies, Value, Size, Forecast, Revenue & Trends
Market Forecast By Application (Chemicals, Food Industry, Pharmaceuticals and Personal Care, Agriculture, Others) And Competitive Landscape
| Product Code: ETC415070 | Publication Date: Oct 2022 | Updated Date: Jul 2026 | Product Type: Market Research Report | |
| Publisher: 6Wresearch | Author: Ravi Bhandari | No. of Pages: 75 | No. of Figures: 35 | No. of Tables: 20 |
Tunisia Inorganic salts Market Size, Share & Growth Rate
The Tunisia Inorganic salts Market was estimated at USD 357 Million in 2025 and is projected to reach USD 485 Million by 2032, growing at a CAGR of 4.5% from 2026 to 2032. This growth trajectory is largely fueled by the burgeoning agriculture sector, which increasingly relies on inorganic salts for fertilizers and soil enhancement. Additionally, the chemical and healthcare industries are expanding their utilization of these essential compounds, driving demand and fostering innovation within the market.
Tunisia Inorganic salts Market Year-wise Growth Rate and Key Drivers
This graph highlights how the Tunisia Inorganic salts Market has steadily grown over the years, supported by major growth factors.
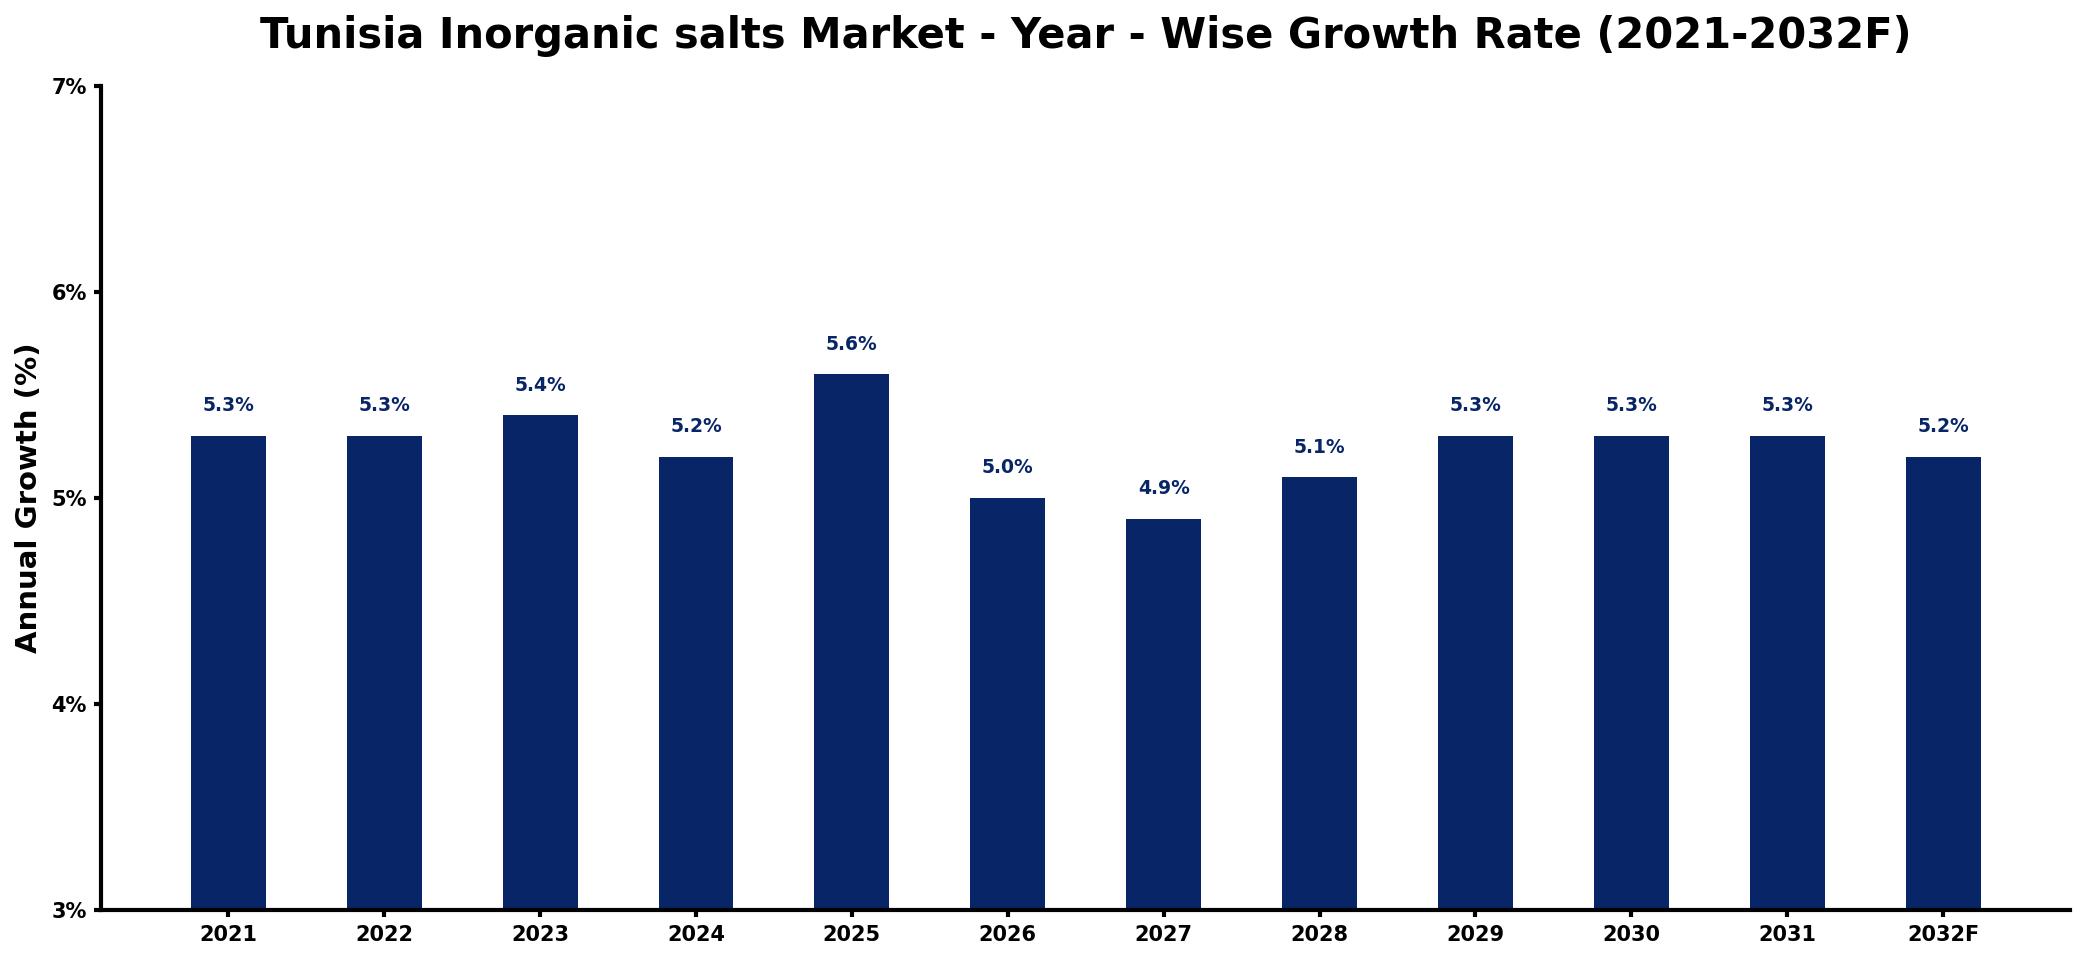
The table below presents the year‑wise growth rates along with the key drivers influencing the market
| Year | Growth Rate | Major Drivers |
| 2021 | 5.3% | Rising agricultural sector investments |
| 2022 | 5.3% | Increased construction activity levels |
| 2023 | 5.4% | Growing demand for fertilizers |
| 2024 | 5.2% | Expansion of chemical manufacturing facilities |
| 2025 | 5.6% | Enhancements in infrastructure projects |
| 2026 | 5.0% | Strengthened export market opportunities |
| 2027 | 4.9% | Emerging technology adoption trends |
| 2028 | 5.1% | Diversification of industrial applications |
| 2029 | 5.3% | Boost in renewable energy initiatives |
| 2030 | 5.3% | Heightened focus on sustainability practices |
| 2031 | 5.3% | Advancements in research and development |
| 2032 | 5.2% | Strengthened regulatory support frameworks |
Note: Market size estimations and growth projections presented in this report are based on 6Wresearch's proprietary forecasting methodology, utilizing the latest available industry data, government publications, and primary research inputs.
Tunisia Inorganic salts Market Synopsis
The Tunisian inorganic salts market is witnessing significant evolution, marked by heightened interest from diverse sectors such as agriculture, chemicals, and healthcare. The growing need for efficient fertilizers and soil treatment options underscores the importance of inorganic salts in enhancing crop yields and supporting agricultural productivity.
Additionally, the healthcare industry's increasing reliance on inorganic salts for pharmaceuticals and medical applications further propels market growth. Manufacturers are now emphasizing sustainable and innovative practices to cater to the shifting preferences of consumers and regulatory frameworks.
Tunisia Inorganic salts Market Key Takeaways
- The Tunisian inorganic salts market is primarily driven by agriculture, chemicals, and healthcare sectors.
- Innovation and technological advancements are central to meeting the evolving market demands.
- Emerging trends toward eco-friendly inorganic salts are reshaping product offerings.
- Competitive pressures from both domestic and international suppliers present ongoing challenges.
- Government initiatives are fostering local production and ensuring adherence to quality standards.
Evaluation of Restraints in Tunisia Inorganic salts Market
While the Tunisian inorganic salts market exhibits promising growth, several constraints limit its full potential. Intense competition from numerous suppliers—both local and international—creates a challenging landscape characterized by price volatility and margin pressures. Furthermore, the susceptibility to fluctuating raw material costs complicates the profitability of local manufacturers. Navigating the intricate regulatory framework in Tunisia, including stringent quality standards and import/export restrictions, can also impede market growth and introduce complexities for industry players.
Tunisia Inorganic salts Market Trends
A prominent trend within the Tunisia inorganic salts market is the growing adoption of these salts in agriculture for enhancing soil quality and boosting crop productivity. The awareness surrounding the benefits of inorganic salts in food processing and preservation is also on the rise. Additionally, there is a notable shift towards sustainability, prompting manufacturers to develop eco-friendly formulations that meet both consumer preferences and regulatory requirements.
Tunisia Inorganic salts Market Opportunities
The Tunisian inorganic salts market offers numerous investment opportunities, particularly for those looking to capitalize on the increasing demand for essential salts like sodium chloride, calcium carbonate, and ammonium sulfate. The market's shift toward sustainable production methods presents avenues for innovation, particularly in the development of new formulations or environmentally friendly products that align with evolving consumer expectations. Investors can leverage the burgeoning agricultural sector's demand to establish a foothold in this growing market.
Government Initiatives in the Tunisia Inorganic salts Market
The Tunisian government has enacted various policies aimed at bolstering the inorganic salts market, focusing on promoting domestic production and enforcing quality standards. These initiatives include import regulations designed to limit foreign competition, subsidies to support local manufacturers, and measures to ensure environmental sustainability in production practices. These policies collectively aim to enhance the competitiveness of local players while fostering innovation and investment within the industry.
Future Insights of the Tunisia Inorganic salts Market
Looking ahead to 2026-2032, the Tunisia inorganic salts market is expected to continue its upward trajectory. Factors such as increased industrial activities, a heightened focus on agrochemicals, and an expanding array of applications across sectors like pharmaceuticals and textiles are poised to drive demand. Government initiatives aimed at fostering industrial development and improving infrastructure will likely provide additional support, although challenges related to raw material pricing and environmental concerns may pose ongoing risks to growth.
Tunisia Inorganic salts Market Latest Developments (2025 - 2026)
In the recent months, there has been a noticeable emphasis on developing innovative production methods within the Tunisian inorganic salts market. Industry players are increasingly investing in research and development to create sustainable products that align with both consumer preferences and regulatory standards. Concurrently, collaborations between public and private sectors are emerging to enhance infrastructure and streamline the supply chain, ultimately fostering a more competitive market environment.
Tunisia Inorganic salts Market - Key Attractiveness of the Report
- 10 Years of Market Numbers
- Historical Data Starting from 2022 to 2025
- Base Year: 2025
- Forecast Data until 2032
- Key Performance Indicators Impacting the Market
- Major Upcoming Developments and Projects
Key Highlights of the Report:
- Tunisia Inorganic salts Market Outlook
- Market Size of Tunisia Inorganic salts Market, 2025
- Forecast of Tunisia Inorganic salts Market, 2032
- Historical Data and Forecast of Tunisia Inorganic salts Revenues & Volume for the Period 2022-2032F
- Tunisia Inorganic salts Market Trend Evolution
- Tunisia Inorganic salts Market Drivers and Challenges
- Tunisia Inorganic salts Price Trends
- Tunisia Inorganic salts Porter's Five Forces
- Tunisia Inorganic salts Industry Life Cycle
- Historical Data and Forecast of Tunisia Inorganic salts Market Revenues & Volume By Application for the Period 2022-2032F
- Historical Data and Forecast of Tunisia Inorganic salts Market Revenues & Volume By Chemicals for the Period 2022-2032F
- Historical Data and Forecast of Tunisia Inorganic salts Market Revenues & Volume By Food Industry for the Period 2022-2032F
- Historical Data and Forecast of Tunisia Inorganic salts Market Revenues & Volume By Pharmaceuticals and Personal Care for the Period 2022-2032F
- Historical Data and Forecast of Tunisia Inorganic salts Market Revenues & Volume By Agriculture for the Period 2022-2032F
- Historical Data and Forecast of Tunisia Inorganic salts Market Revenues & Volume By Others for the Period 2022-2032F
- Tunisia Inorganic salts Import Export Trade Statistics
- Market Opportunity Assessment By Application
- Tunisia Inorganic salts Top Companies Market Share
- Tunisia Inorganic salts Competitive Benchmarking By Technical and Operational Parameters
- Tunisia Inorganic salts Company Profiles
- Tunisia Inorganic salts Key Strategic Recommendations
Frequently Asked Questions About the Market Study (FAQs):
The market is expected to grow at a CAGR of 4.5% from 2026 to 2032, increasing from an estimated USD 357 Million in 2025 to USD 485 Million by 2032.
Inorganic salts play a crucial role in enhancing soil fertility and improving crop yields, primarily through their use as fertilizers and soil conditioners.
Manufacturers often grapple with complex regulatory frameworks, including import/export restrictions and stringent quality standards that can affect operational efficiency.
Sustainability is becoming increasingly important, with a growing emphasis on eco-friendly products that reduce environmental impacts, prompting manufacturers to innovate.
The agriculture, chemicals, and healthcare sectors are the primary drivers of demand, each utilizing inorganic salts for various applications ranging from fertilizers to pharmaceuticals.
6Wresearch actively monitors the Tunisia Inorganic salts Market and publishes its comprehensive annual report, highlighting emerging trends, growth drivers, revenue analysis, and forecast outlook. Our insights help businesses to make data-backed strategic decisions with ongoing market dynamics. Our analysts track relevent industries related to the Tunisia Inorganic salts Market, allowing our clients with actionable intelligence and reliable forecasts tailored to emerging regional needs.
Yes, we provide customisation as per your requirements. To learn more, feel free to contact us on sales@6wresearch.com
1 Executive Summary |
2 Introduction |
2.1 Key Highlights of the Report |
2.2 Report Description |
2.3 Market Scope & Segmentation |
2.4 Research Methodology |
2.5 Assumptions |
3 Tunisia Inorganic salts Market Overview |
3.1 Tunisia Country Macro Economic Indicators |
3.2 Tunisia Inorganic salts Market Revenues & Volume, 2022 & 2032F |
3.3 Tunisia Inorganic salts Market - Industry Life Cycle |
3.4 Tunisia Inorganic salts Market - Porter's Five Forces |
3.5 Tunisia Inorganic salts Market Revenues & Volume Share, By Application, 2022 & 2032F |
4 Tunisia Inorganic salts Market Dynamics |
4.1 Impact Analysis |
4.2 Market Drivers |
4.2.1 Growth in the pharmaceutical industry in Tunisia leading to increased demand for inorganic salts as raw materials |
4.2.2 Expansion of the agriculture sector in Tunisia driving the need for inorganic salts for fertilizers |
4.2.3 Increasing use of inorganic salts in water treatment applications due to growing concerns about water quality |
4.3 Market Restraints |
4.3.1 Fluctuating prices of raw materials impacting the production costs of inorganic salts |
4.3.2 Environmental regulations and sustainability concerns affecting the sourcing and production of inorganic salts |
5 Tunisia Inorganic salts Market Trends |
6 Tunisia Inorganic salts Market, By Types |
6.1 Tunisia Inorganic salts Market, By Application |
6.1.1 Overview and Analysis |
6.1.2 Tunisia Inorganic salts Market Revenues & Volume, By Application, 2022-2032F |
6.1.3 Tunisia Inorganic salts Market Revenues & Volume, By Chemicals, 2022-2032F |
6.1.4 Tunisia Inorganic salts Market Revenues & Volume, By Food Industry, 2022-2032F |
6.1.5 Tunisia Inorganic salts Market Revenues & Volume, By Pharmaceuticals and Personal Care, 2022-2032F |
6.1.6 Tunisia Inorganic salts Market Revenues & Volume, By Agriculture, 2022-2032F |
6.1.7 Tunisia Inorganic salts Market Revenues & Volume, By Others, 2022-2032F |
7 Tunisia Inorganic salts Market Import-Export Trade Statistics |
7.1 Tunisia Inorganic salts Market Export to Major Countries |
7.2 Tunisia Inorganic salts Market Imports from Major Countries |
8 Tunisia Inorganic salts Market Key Performance Indicators |
8.1 Number of new product developments or innovations in the inorganic salts market |
8.2 Percentage increase in the adoption of inorganic salts in key industries in Tunisia |
8.3 Growth rate of the agriculture and pharmaceutical sectors in Tunisia |
8.4 Percentage of compliance with environmental regulations in the production of inorganic salts |
8.5 Investment in research and development for sustainable sourcing and production practices of inorganic salts |
9 Tunisia Inorganic salts Market - Opportunity Assessment |
9.1 Tunisia Inorganic salts Market Opportunity Assessment, By Application, 2022 & 2032F |
10 Tunisia Inorganic salts Market - Competitive Landscape |
10.1 Tunisia Inorganic salts Market Revenue Share, By Companies, 2025 |
10.2 Tunisia Inorganic salts Market Competitive Benchmarking, By Operating and Technical Parameters |
11 Company Profiles |
12 Recommendations |
13 Disclaimer |
Global Go To Market Strategy - 2030
Export potential enables firms to identify high-growth global markets with greater confidence by combining advanced trade intelligence with a structured quantitative methodology. The framework analyzes emerging demand trends and country-level import patterns while integrating macroeconomic and trade datasets such as GDP and population forecasts, bilateral import–export flows, tariff structures, elasticity differentials between developed and developing economies, geographic distance, and import demand projections. Using weighted trade values from 2020–2024 as the base period to project country-to-country export potential for 2030, these inputs are operationalized through calculated drivers such as gravity model parameters, tariff impact factors, and projected GDP per-capita growth. Through an analysis of hidden potentials, demand hotspots, and market conditions that are most favorable to success, this method enables firms to focus on target countries, maximize returns, and global expansion with data, backed by accuracy.
By factoring in the projected importer demand gap that is currently unmet and could be potential opportunity, it identifies the potential for the Exporter (Country) among 190 countries, against the general trade analysis, which identifies the biggest importer or exporter.
To discover high-growth global markets and optimize your business strategy:
Click Here
Pricing
- Single User License$ 1,995
- Department License$ 2,400
- Site License$ 3,120
- Global License$ 3,795

Leadership Perspectives from Industry Events
Search
Thought Leadership and Analyst Meet


Our Clients
6WResearch In News
- India Air Conditioner Market Set for Strong Rebound in 2026 After Weather-Led Correction and GST-Driven Recovery: 6Wresearch
- ADAS in India: How Automatic Emergency Braking, Blind Spot Detection & Driver Monitoring are Transforming Road Safety
- Doha a strategic location for EV manufacturing hub: IPA Qatar
- Demand for luxury TVs surging in the GCC, says Samsung
- Empowering Growth: The Thriving Journey of Bangladesh’s Cable Industry
- Demand for luxury TVs surging in the GCC, says Samsung
Latest Reports
- Nicaragua RPG Gaming Market (2026-2032)
- New Zealand RPG Gaming Market (2026-2032)
- Netherlands RPG Gaming Market (2026-2032)
- Nauru RPG Gaming Market (2026-2032)
- Namibia RPG Gaming Market (2026-2032)
- Mozambique RPG Gaming Market (2026-2032)
- Montenegro RPG Gaming Market (2026-2032)
- Mongolia RPG Gaming Market (2026-2032)
- Monaco RPG Gaming Market (2026-2032)
- Micronesia RPG Gaming Market (2026-2032)
Industry Events and Analyst Meet

EV India Expo 2026

HIMTEX 2026

India Refining Summit 2026

India EV Show 2026

EV tech India Expo 2026
Whitepaper
- Middle East & Africa Commercial Security Market Click here to view more.
- Middle East & Africa Fire Safety Systems & Equipment Market Click here to view more.
- GCC Drone Market Click here to view more.
- Middle East Lighting Fixture Market Click here to view more.
- GCC Physical & Perimeter Security Market Click here to view more.