Tunisia Power Bank Market (2026-2032) | Trends, Forecast, Industry, Size, Analysis, Share, Outlook, Companies, Growth, Value & Revenue
Market Forecast By Capacity Range (Up to 3,000 mAh, 3,001 mAh-8,000 mAh, 8,001 mAh-20,000 mAh, Above 20,000 mAh), By Energy Source (Electric, Solar), By Battery Type (Lithium-ion, Lithium Polymer), By Distribution Channel (E-commerce, Brick and Mortar) And Competitive Landscape
| Product Code: ETC012194 | Publication Date: Oct 2020 | Updated Date: Jun 2026 | Product Type: Report | |
| Publisher: 6Wresearch | Author: Ravi Bhandari | No. of Pages: 70 | No. of Figures: 35 | No. of Tables: 5 |
Tunisia Power Bank Market Summary
The tunisia power bank market was estimated at USD 487 Million in 2025 and is projected to reach USD 645 Million by 2032, growing at a CAGR of 4.5% from 2026 to 2032.
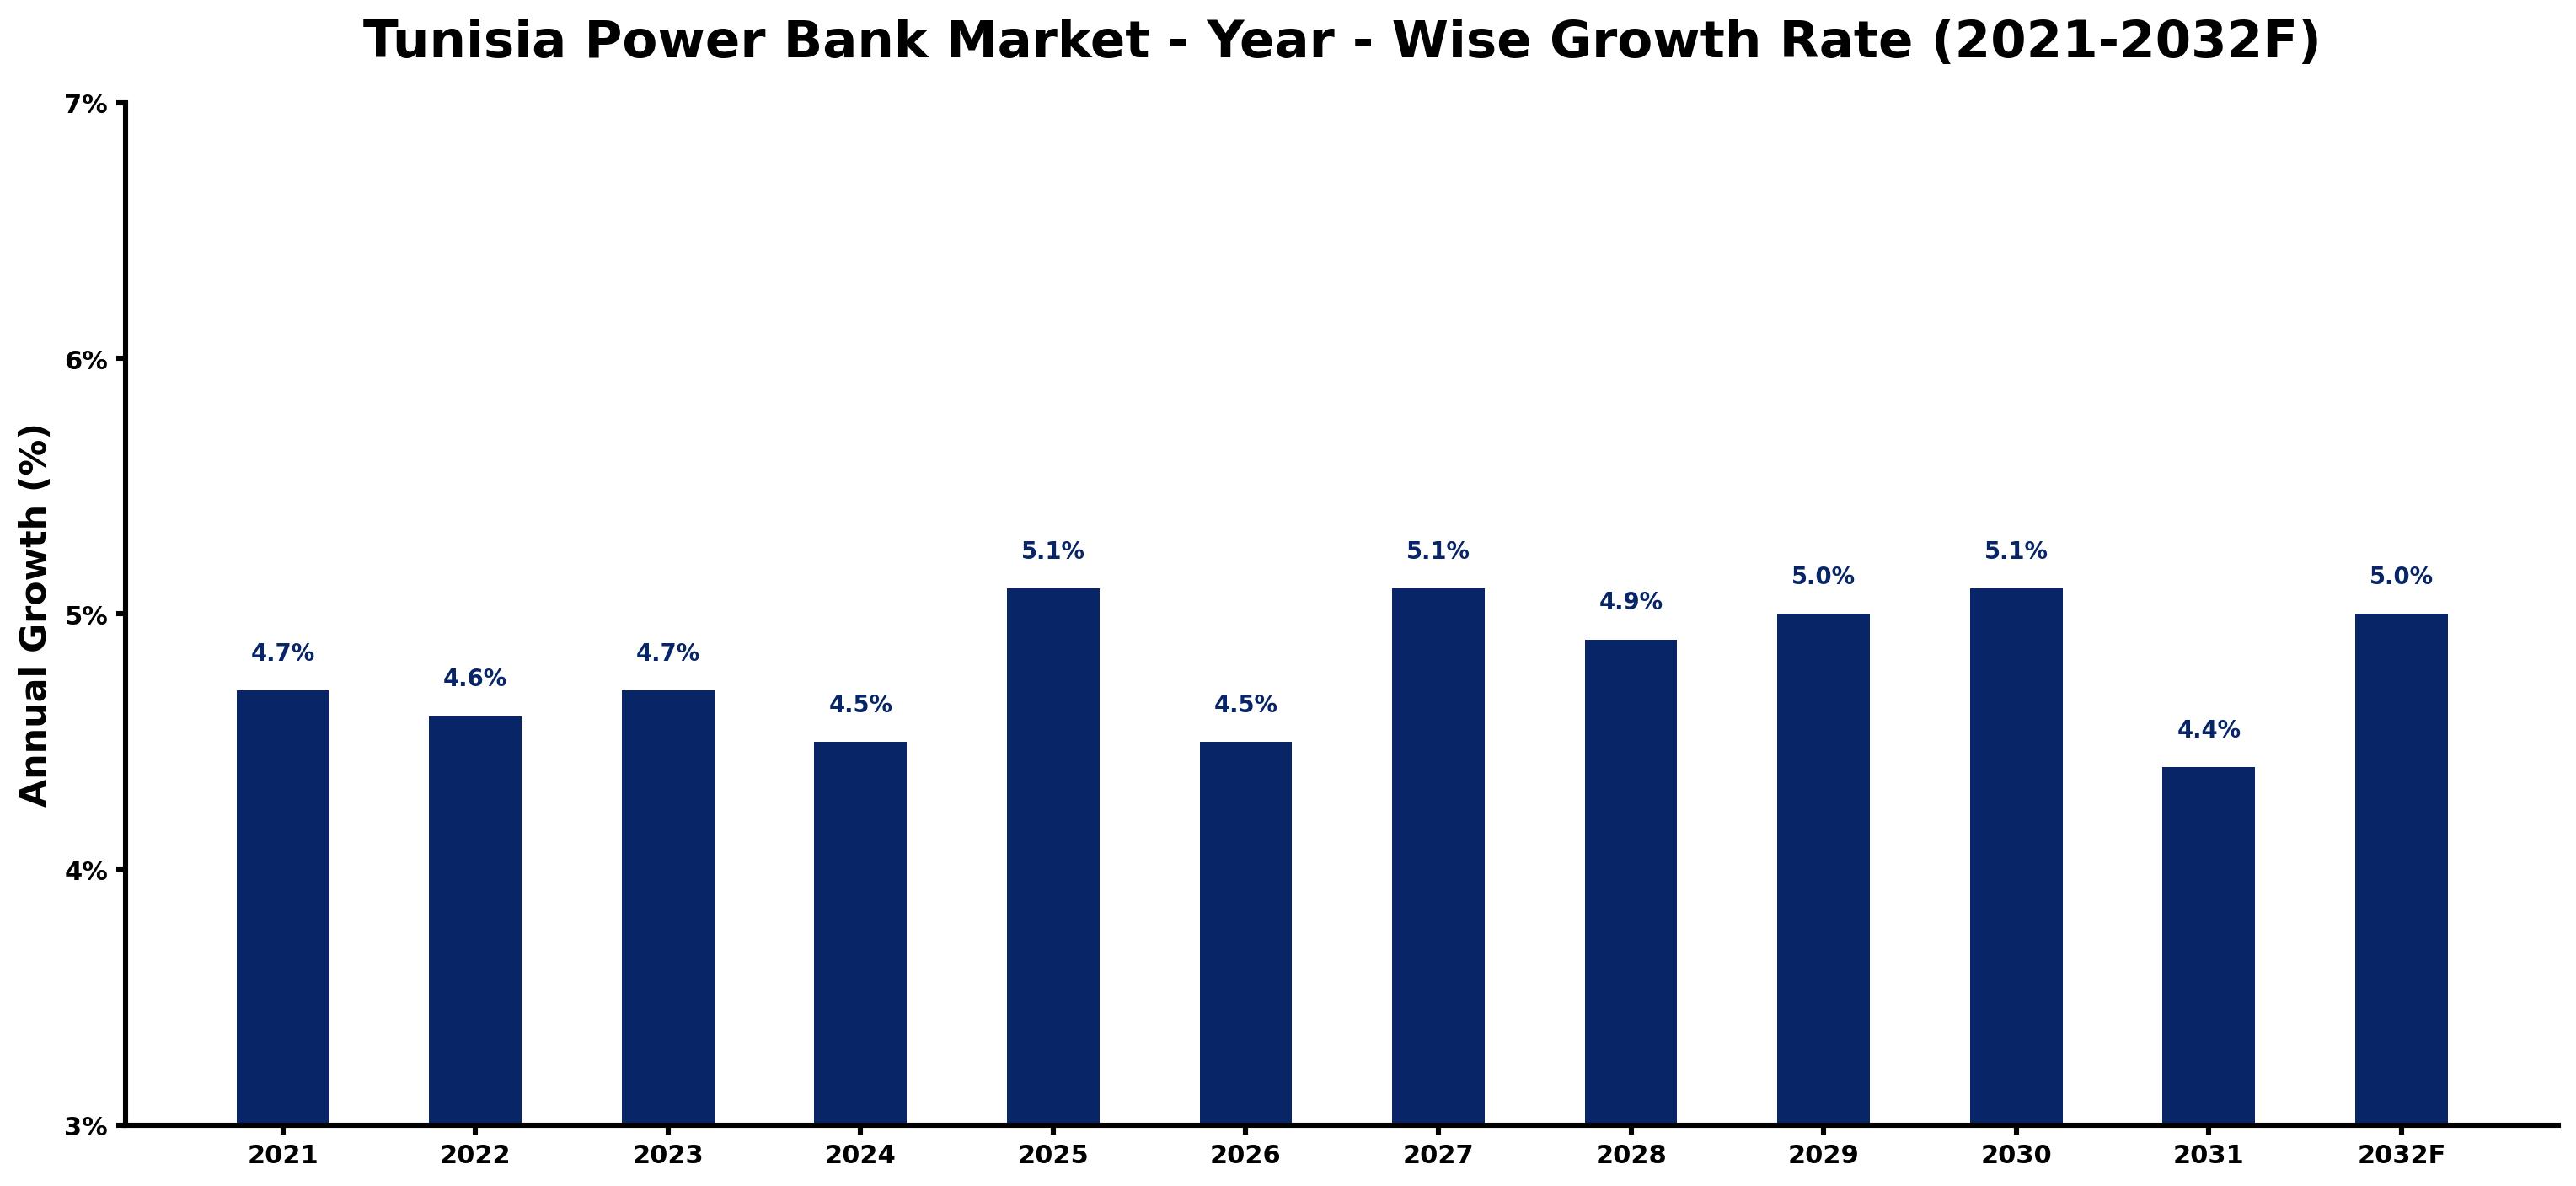
Tunisia Power Bank Market Growth Rate Analysis (2021-2032)
The Tunisia Power Bank market has shown a stable growth trend over the past few years, with yearly increases of 4.7% in 2021, slightly dipping to 4.6% in 2022, but rebounding to 4.7% in 2023. This stability is driven by rising consumer demand for portable charging solutions paired with ongoing digitalization and an expanding mobile device user base. The market is expected to grow further, with projections of 5.1% growth in 2025 and again in 2027, fueled by increased investments in energy transition technologies and improved infrastructure. However, fluctuations such as the dip to 4.4% in 2031 may reflect temporary market saturation or shifts in consumer preferences.
Tunisia Power Bank Market Year-wise Growth Rate and Key Drivers
This graph highlights how the Tunisia Power Bank Market has steadily grown over the past five years, supported by major growth factors.
The table below presents the year wise growth rates along with the key drivers influencing the market
| Year | Growth Rate | Major Drivers |
| 2021 | 4.7% | Consumer reliance on mobile devices surged due to remote work and online learning. |
| 2022 | 4.6% | Retail channels expanded, increasing power bank visibility in urban and rural areas. |
| 2023 | 4.7% | Emergence of affordable products enhanced access for middle-class consumers across Tunisia. |
| 2024 | 4.5% | Local manufacturers began producing power banks, reducing dependency on imports significantly. |
| 2025 | 5.1% | Smartphone penetration reached unprecedented levels, fueling continuous demand for portable charging. |
| 2026 | 4.5% | Outdoor activities gained popularity, driving interest in durable and high-capacity power banks. |
| 2027 | 5.1% | Increased travel as pandemic restrictions eased contributed to higher mobile charging needs. |
| 2028 | 4.9% | Electric vehicle adoption prompted development of compatible charging solutions in the market. |
| 2029 | 5.0% | Technological collaborations between brands improved power bank efficiency and charging speeds. |
| 2030 | 5.1% | Sustainable consumer trends led to a demand for eco-friendly power bank alternatives. |
| 2031 | 4.4% | E-commerce platforms enhanced accessibility, making it easier for consumers to purchase devices. |
| 2032 | 5.0% | Integration with smart home devices created new opportunities for power bank applications. |
Note - Market size estimations and growth projections presented in this report are based on 6Wresearch's advanced forecasting approach, validated with industry datasets as of June 2026.
Tunisia Power Bank Market Synopsis
The Tunisia Power Bank Market is projected to reach 4.5% and witness significant growth during the forecast period (2026-2032). This growth is primarily driven by the increasing proliferation of mobile devices in the country and the rising demand for portable charging solutions among consumers. The integration of advanced technologies within power banks, coupled with the escalating penetration of smartphones, shapes the market dynamics significantly.
Tunisia Power Bank Market Growth Drivers
Several factors are instrumental in driving the Tunisia Power Bank Market. First and foremost is the surge in smartphone usage, with more consumers relying on mobile devices for communication, work, and entertainment. This reliance necessitates the availability of charging solutions that are both efficient and convenient.
- The increasing travel and outdoor activities among consumers have heightened the demand for portable power solutions, making power banks essential accessories for users on the move.
- Technological advancements in battery technology are improving the capacity, efficiency, and design of power banks, enhancing user experience and satisfaction.
- Consumer preferences are shifting towards compact and lightweight power bank designs, thereby driving innovation and competition among manufacturers to meet these demands.
- The growing awareness of the importance of staying charged in a connected world fosters a culture of continuous product use, further propelling market growth.
- Increased online shopping and digital payment methods also contribute to the proliferation of mobile devices, creating a consistent demand for portable charging solutions.
Tunisia Power Bank Market Challenges and Restraints
While the Tunisia Power Bank Market is poised for growth, it faces several challenges that could hinder its momentum. One significant concern is the rapid pace of technological advancements in battery life and efficiency, which manufacturers must match to maintain a competitive edge.
- The demand for longer-lasting and faster-charging power banks requires continuous investment in research and development, which can strain resources for some companies.
- Consumer preferences for ultra-portable and lightweight power bank designs complicate the manufacturing process and require innovative engineering solutions.
- Regulatory compliance regarding safety certifications and standards adds complexity to market entry and the product development process, potentially delaying new offerings.
- Price sensitivity among consumers can lead to challenges in distinguishing premium products in the market, impacting overall margins for manufacturers.
- The market remains vulnerable to economic fluctuations that could affect consumer spending, especially during periods of economic downturn.
Tunisia Power Bank Market Government Investment and Initiatives
The Tunisian government recognizes the importance of portable charging solutions within the broader context of sustainable energy and consumer safety. Policies that emphasize consumer safety standards include stringent certification requirements for both imported and domestically produced power banks.
- The government encourages investments in sustainable energy solutions, promoting a shift towards renewable energy sources and portable power products.
- Public spending initiatives are designed to support local manufacturers in overcoming barriers to entry and compliance with international safety standards.
- Incentives for research and development in energy-efficient technologies are being integrated into government agendas to foster innovation in the power bank market.
- Regulatory frameworks are being developed to streamline the certification and approval processes, thus enhancing market accessibility for new entrants.
- The government is actively participating in international dialogues to align domestic policies with global standards for power bank safety and efficiency.
Tunisia Power Bank Market Latest Developments (May 2025 - June 2026)
In the period from May 2025 to June 2026, the Tunisia Power Bank Market has witnessed notable developments that reflect the evolving landscape of consumer electronics. Innovations in battery technology have prompted manufacturers to introduce products with improved charging speeds and capacities, meeting the growing expectations of consumers.
- There has been a marked increase in collaborations among technology firms aimed at integrating advanced charging technologies, enhancing overall product performance.
- Consumer awareness campaigns have been instrumental in educating users about the benefits of using certified power banks, contributing to an increased market demand.
- Trends towards eco-friendly designs and sustainable materials have gained traction, prompting manufacturers to pivot towards more environmentally responsible production methods.
- The growth of e-commerce platforms has facilitated greater accessibility of power bank products, driving online sales significantly during this period.
- Overall market dynamics have shifted towards enhanced user experience, with a focus on product durability and technical performance, aligning with consumer expectations.
Tunisia Power Bank Market - Key Attractiveness of the Report
- 10 Years of Market Numbers
- Historical Data Starting from 2022 to 2025
- Base Year: 2025
- Forecast Data until 2032
- Key Performance Indicators Impacting the Market
- Major Upcoming Developments and Projects
Key Highlights of the Report:
- Tunisia Power Bank Market Outlook
- Market Size of Tunisia Power Bank Market, 2025
- Forecast of Tunisia Power Bank Market, 2032
- Historical Data and Forecast of Tunisia Power Bank Revenues & Volume for the Period 2022-2032F
- Tunisia Power Bank Market Trend Evolution
- Tunisia Power Bank Market Drivers and Challenges
- Tunisia Power Bank Price Trends
- Tunisia Power Bank Porter's Five Forces
- Tunisia Power Bank Industry Life Cycle
- Historical Data and Forecast of Tunisia Power Bank Market Revenues & Volume By Capacity Range for the Period 2022-2032F
- Historical Data and Forecast of Tunisia Power Bank Market Revenues & Volume By Up to 3,000 mAh for the Period 2022-2032F
- Historical Data and Forecast of Tunisia Power Bank Market Revenues & Volume By 3,001 mAh-8,000 mAh for the Period 2022-2032F
- Historical Data and Forecast of Tunisia Power Bank Market Revenues & Volume By 8,001 mAh-20,000 mAh for the Period 2022-2032F
- Historical Data and Forecast of Tunisia Power Bank Market Revenues & Volume By Above 20,000 mAh for the Period 2022-2032F
- Historical Data and Forecast of Tunisia Power Bank Market Revenues & Volume By Energy Source for the Period 2022-2032F
- Historical Data and Forecast of Tunisia Power Bank Market Revenues & Volume By Electric for the Period 2022-2032F
- Historical Data and Forecast of Tunisia Power Bank Market Revenues & Volume By Solar for the Period 2022-2032F
- Historical Data and Forecast of Tunisia Power Bank Market Revenues & Volume By Battery Type for the Period 2022-2032F
- Historical Data and Forecast of Tunisia Power Bank Market Revenues & Volume By Lithium-ion for the Period 2022-2032F
- Historical Data and Forecast of Tunisia Power Bank Market Revenues & Volume By Lithium Polymer for the Period 2022-2032F
- Historical Data and Forecast of Tunisia Power Bank Market Revenues & Volume By Distribution Channel for the Period 2022-2032F
- Historical Data and Forecast of Tunisia Power Bank Market Revenues & Volume By E-commerce for the Period 2022-2032F
- Historical Data and Forecast of Tunisia Power Bank Market Revenues & Volume By Brick and Mortar for the Period 2022-2032F
- Tunisia Power Bank Import Export Trade Statistics
- Market Opportunity Assessment By Capacity Range
- Market Opportunity Assessment By Energy Source
- Market Opportunity Assessment By Battery Type
- Market Opportunity Assessment By Distribution Channel
- Tunisia Power Bank Top Companies Market Share
- Tunisia Power Bank Competitive Benchmarking By Technical and Operational Parameters
- Tunisia Power Bank Company Profiles
- Tunisia Power Bank Key Strategic Recommendations
Frequently Asked Questions About the Market Study (FAQs):
The growth is primarily driven by the rising smartphone penetration, increased travel activities, and a growing consumer demand for portable charging solutions.
Challenges include rapid advancements in battery technology, the need for compact designs, regulatory compliance, and consumer price sensitivity.
The government promotes consumer safety standards, provides incentives for R&D, and supports local manufacturers to enhance market accessibility.
Current trends include a focus on eco-friendly designs, technological innovations in battery efficiency, and increased consumer awareness of certified products.
6Wresearch actively monitors the Tunisia Power Bank Market and publishes its comprehensive annual report, highlighting emerging trends, growth drivers, revenue analysis, and forecast outlook. Our insights help businesses to make data-backed strategic decisions with ongoing market dynamics. Our analysts track relevent industries related to the Tunisia Power Bank Market, allowing our clients with actionable intelligence and reliable forecasts tailored to emerging regional needs.
Yes, we provide customisation as per your requirements. To learn more, feel free to contact us on sales@6wresearch.com
1 Executive Summary |
2 Introduction |
2.1 Key Highlights of the Report |
2.2 Report Description |
2.3 Market Scope & Segmentation |
2.4 Research Methodology |
2.5 Assumptions |
3 Tunisia Power Bank Market Overview |
3.1 Tunisia Country Macro Economic Indicators |
3.2 Tunisia Power Bank Market Revenues & Volume, 2022 & 2032F |
3.3 Tunisia Power Bank Market - Industry Life Cycle |
3.4 Tunisia Power Bank Market - Porter's Five Forces |
3.5 Tunisia Power Bank Market Revenues & Volume Share, By Capacity Range , 2022 & 2032F |
3.6 Tunisia Power Bank Market Revenues & Volume Share, By Energy Source, 2022 & 2032F |
3.7 Tunisia Power Bank Market Revenues & Volume Share, By Battery Type, 2022 & 2032F |
3.8 Tunisia Power Bank Market Revenues & Volume Share, By Distribution Channel, 2022 & 2032F |
4 Tunisia Power Bank Market Dynamics |
4.1 Impact Analysis |
4.2 Market Drivers |
4.3 Market Restraints |
5 Tunisia Power Bank Market Trends |
6 Tunisia Power Bank Market, By Types |
6.1 Tunisia Power Bank Market, By Capacity Range |
6.1.1 Overview and Analysis |
6.1.2 Tunisia Power Bank Market Revenues & Volume, By Capacity Range , 2022-2032F |
6.1.3 Tunisia Power Bank Market Revenues & Volume, By Up to 3,000 mAh, 2022-2032F |
6.1.4 Tunisia Power Bank Market Revenues & Volume, By 3,001 mAh-8,000 mAh, 2022-2032F |
6.1.5 Tunisia Power Bank Market Revenues & Volume, By 8,001 mAh-20,000 mAh, 2022-2032F |
6.1.6 Tunisia Power Bank Market Revenues & Volume, By Above 20,000 mAh, 2022-2032F |
6.2 Tunisia Power Bank Market, By Energy Source |
6.2.1 Overview and Analysis |
6.2.2 Tunisia Power Bank Market Revenues & Volume, By Electric, 2022-2032F |
6.2.3 Tunisia Power Bank Market Revenues & Volume, By Solar, 2022-2032F |
6.3 Tunisia Power Bank Market, By Battery Type |
6.3.1 Overview and Analysis |
6.3.2 Tunisia Power Bank Market Revenues & Volume, By Lithium-ion, 2022-2032F |
6.3.3 Tunisia Power Bank Market Revenues & Volume, By Lithium Polymer, 2022-2032F |
6.4 Tunisia Power Bank Market, By Distribution Channel |
6.4.1 Overview and Analysis |
6.4.2 Tunisia Power Bank Market Revenues & Volume, By E-commerce, 2022-2032F |
6.4.3 Tunisia Power Bank Market Revenues & Volume, By Brick and Mortar, 2022-2032F |
7 Tunisia Power Bank Market Import-Export Trade Statistics |
7.1 Tunisia Power Bank Market Export to Major Countries |
7.2 Tunisia Power Bank Market Imports from Major Countries |
8 Tunisia Power Bank Market Key Performance Indicators |
9 Tunisia Power Bank Market - Opportunity Assessment |
9.1 Tunisia Power Bank Market Opportunity Assessment, By Capacity Range , 2022 & 2032F |
9.2 Tunisia Power Bank Market Opportunity Assessment, By Energy Source, 2022 & 2032F |
9.3 Tunisia Power Bank Market Opportunity Assessment, By Battery Type, 2022 & 2032F |
9.4 Tunisia Power Bank Market Opportunity Assessment, By Distribution Channel, 2022 & 2032F |
10 Tunisia Power Bank Market - Competitive Landscape |
10.1 Tunisia Power Bank Market Revenue Share, By Companies, 2025 |
10.2 Tunisia Power Bank Market Competitive Benchmarking, By Operating and Technical Parameters |
11 Company Profiles |
12 Recommendations |
13 Disclaimer |
Global Go To Market Strategy - 2030
Export potential enables firms to identify high-growth global markets with greater confidence by combining advanced trade intelligence with a structured quantitative methodology. The framework analyzes emerging demand trends and country-level import patterns while integrating macroeconomic and trade datasets such as GDP and population forecasts, bilateral import–export flows, tariff structures, elasticity differentials between developed and developing economies, geographic distance, and import demand projections. Using weighted trade values from 2020–2024 as the base period to project country-to-country export potential for 2030, these inputs are operationalized through calculated drivers such as gravity model parameters, tariff impact factors, and projected GDP per-capita growth. Through an analysis of hidden potentials, demand hotspots, and market conditions that are most favorable to success, this method enables firms to focus on target countries, maximize returns, and global expansion with data, backed by accuracy.
By factoring in the projected importer demand gap that is currently unmet and could be potential opportunity, it identifies the potential for the Exporter (Country) among 190 countries, against the general trade analysis, which identifies the biggest importer or exporter.
To discover high-growth global markets and optimize your business strategy:
Click Here
Pricing
- Single User License$ 1,995
- Department License$ 2,400
- Site License$ 3,120
- Global License$ 3,795

Leadership Perspectives from Industry Events
Search
Thought Leadership and Analyst Meet


Our Clients
6WResearch In News
- India Air Conditioner Market Set for Strong Rebound in 2026 After Weather-Led Correction and GST-Driven Recovery: 6Wresearch
- ADAS in India: How Automatic Emergency Braking, Blind Spot Detection & Driver Monitoring are Transforming Road Safety
- Doha a strategic location for EV manufacturing hub: IPA Qatar
- Demand for luxury TVs surging in the GCC, says Samsung
- Empowering Growth: The Thriving Journey of Bangladesh’s Cable Industry
- Demand for luxury TVs surging in the GCC, says Samsung
Latest Reports
- Nicaragua RPG Gaming Market (2026-2032)
- New Zealand RPG Gaming Market (2026-2032)
- Netherlands RPG Gaming Market (2026-2032)
- Nauru RPG Gaming Market (2026-2032)
- Namibia RPG Gaming Market (2026-2032)
- Mozambique RPG Gaming Market (2026-2032)
- Montenegro RPG Gaming Market (2026-2032)
- Mongolia RPG Gaming Market (2026-2032)
- Monaco RPG Gaming Market (2026-2032)
- Micronesia RPG Gaming Market (2026-2032)
Industry Events and Analyst Meet

EV India Expo 2026

HIMTEX 2026

India Refining Summit 2026

India EV Show 2026

EV tech India Expo 2026
Whitepaper
- Middle East & Africa Commercial Security Market Click here to view more.
- Middle East & Africa Fire Safety Systems & Equipment Market Click here to view more.
- GCC Drone Market Click here to view more.
- Middle East Lighting Fixture Market Click here to view more.
- GCC Physical & Perimeter Security Market Click here to view more.