Tunisia Solar Power Equipment Market (2026-2032) Outlook | Trends, Industry, Growth, Companies, Revenue, Analysis, Forecast, Share, Value & Size
Market Forecast By Equipment (Solar Panels, Mounting, Racking & Tracking System, Storage System, Others), By Application (Residential, Nonresidential, Utility) And Competitive Landscape
| Product Code: ETC271134 | Publication Date: Aug 2022 | Updated Date: Jul 2026 | Product Type: Market Research Report | |
| Publisher: 6Wresearch | Author: Ravi Bhandari | No. of Pages: 75 | No. of Figures: 35 | No. of Tables: 20 |
Tunisia Solar Power Equipment Market Size, Share & Growth Rate
The Tunisia Solar Power Equipment Market was estimated at USD 1150 Million in 2025 and is projected to reach USD 1928 Million by 2032, growing at a CAGR of 7.7% from 2026 to 2032. This growth is primarily driven by the government's ambitious renewable energy targets, specifically the aim to achieve 30% of total electricity generation from renewable sources by 2030. The increasing awareness around sustainability and the push to diversify energy sources are also contributing significantly to this upward trajectory.
Tunisia Solar Power Equipment Market Growth Rate Analysis (2021-2032)
The Tunisia solar power equipment market is experiencing robust growth, propelled by escalating consumer demand and significant government investment in renewable energy infrastructure. The market grew by 6.8% in 2021 and demonstrated an upward trend, reaching 7.2% in 2022. Continued advancements in solar technology and favorable policies contributed to a projected increase of 7.6% in 2023, with the growth rate anticipated to reach 10.0% by 2029. The government’s commitment to energy transition, coupled with an increase in public awareness regarding sustainable practices, has spurred investments across the sector. As Tunisia moves toward a greener future, the solar equipment market is poised for expansion, with growth rates expected to peak at 11.2% by 2032.
Tunisia Solar Power Equipment Market Year-wise Growth Rate and Key Drivers
This graph highlights how the Tunisia Solar Power Equipment Market has steadily grown over the years, supported by major growth factors.
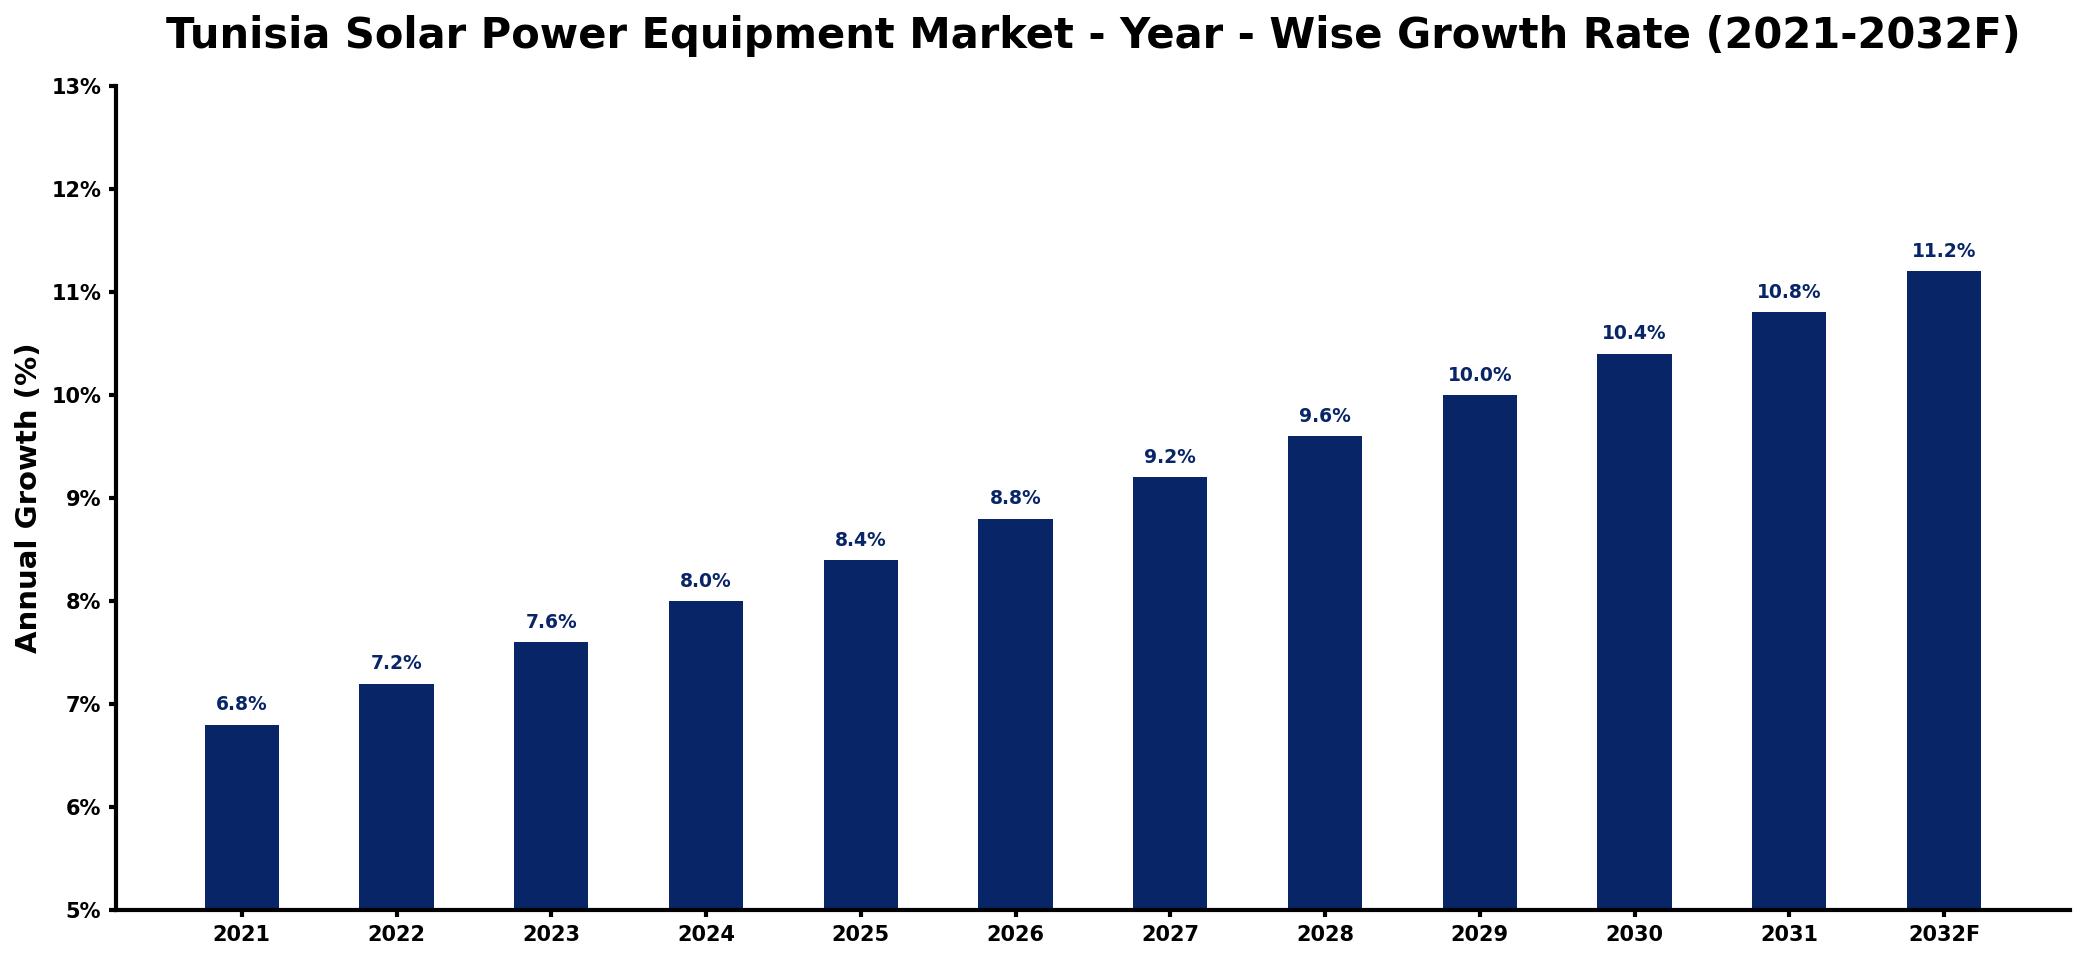
The table below presents the year‑wise growth rates along with the key drivers influencing the market
| Year | Growth Rate | Major Drivers |
| 2021 | 6.8% | Increased residential adoption rates |
| 2022 | 7.2% | Government incentives for installations |
| 2023 | 7.6% | Rising energy costs drive interest |
| 2024 | 8.0% | Growing industrial sector investments |
| 2025 | 8.4% | Enhanced grid integration initiatives |
| 2026 | 8.8% | Expanding commercial sector utilization |
| 2027 | 9.2% | Innovative financing options emerge |
| 2028 | 9.6% | Increased awareness of sustainability |
| 2029 | 10.0% | Rising demand for clean alternatives |
| 2030 | 10.4% | Strengthened regional trade partnerships |
| 2031 | 10.8% | Technological advancements attract investments |
| 2032 | 11.2% | Higher consumer preference for renewables |
Note: Market size estimations and growth projections presented in this report are based on 6Wresearch's proprietary forecasting methodology, utilizing the latest available industry data, government publications, and primary research inputs.
Tunisia Solar Power Equipment Market Synopsis
A notable aspect of the Tunisia Solar Power Equipment Market is the rising demand for solar panels, inverters, and battery storage solutions across various sectors. As businesses and households increasingly seek to reduce energy costs and carbon footprints, the adoption of solar technology is accelerating.
Furthermore, the investment landscape is becoming more vibrant, with both local and international companies showing interest in solar projects. This influx of capital is likely to enhance the innovation and availability of solar products and services, catering to the growing consumer base.
Tunisia Solar Power Equipment Market Key Takeaways
- Strong government policies are facilitating the expansion of solar energy solutions in Tunisia.
- The shift towards renewable energy is creating a competitive market for solar equipment.
- Investments in advanced solar technologies are making solar power more accessible to diverse consumers.
- Growing environmental awareness is influencing consumer choices towards sustainable energy options.
- The market is expected to see a surge in projects and investments, driven by favorable regulatory frameworks.
Evaluation of Restraints in Tunisia Solar Power Equipment Market
Despite the promising outlook, the Tunisia Solar Power Equipment Market faces several constraints that could impede its growth trajectory. Regulatory inconsistencies and uncertain policy environments create risks for potential investors, deterring capital flow into the sector. Additionally, the high initial costs associated with solar installations can be a significant barrier for small enterprises and residential consumers. A further concern is the limited availability of skilled labor, which is essential for the development and maintenance of solar energy projects, impacting the overall efficiency and reliability of the market.
Tunisia Solar Power Equipment Market Trends
Emerging trends in the Tunisia Solar Power Equipment Market include a marked shift towards more efficient solar technologies. Innovations in photovoltaic cells are paving the way for products that deliver higher energy outputs at lower costs. In addition, the integration of energy storage solutions is becoming increasingly popular, allowing for a more reliable power supply despite the intermittent nature of solar energy. Public awareness campaigns are also playing a crucial role in fostering the adoption of solar solutions across different demographics.
Tunisia Solar Power Equipment Market Opportunities
The market presents numerous investment opportunities, particularly in solar panel manufacturing and installation services. With the governments incentives enhancing market viability, investors can leverage the high sunlight exposure in Tunisia to develop solar projects that not only fulfill local energy needs but can also contribute to energy exports in the region. Collaborations with local enterprises can further enhance market penetration, ensuring that investments yield significant returns as the sector grows.
Government Initiatives in the Tunisia Solar Power Equipment Market
The Tunisian government has launched several initiatives aimed at bolstering the solar power equipment market. The National Renewable Energy Action Plan is a cornerstone policy, outlining ambitious goals to increase renewable energy share to 30% by 2030. Furthermore, attractive incentives such as feed-in tariffs and tax benefits encourage both domestic and foreign investment in solar projects. These initiatives are essential in creating a conducive environment for sustainable energy practices in Tunisia.
Future Insights of the Tunisia Solar Power Equipment Market
Looking ahead, the Tunisia Solar Power Equipment Market is positioned for robust growth from 2026 to 2032. The government's commitment to renewable energy, coupled with declining technology costs, is expected to drive accelerated adoption of solar solutions. As public and private entities ramp up their investments in solar infrastructure, the market will likely expand, making Tunisia a key player in the regional renewable energy landscape.
Tunisia Solar Power Equipment Market Latest Developments (2025 - 2026)
In recent months, various initiatives aimed at enhancing solar infrastructure have been announced, signaling a proactive approach towards boosting the market. Development projects focusing on large-scale solar farms have gained traction, complemented by community awareness campaigns encouraging solar adoption. Moreover, discussions surrounding new public-private partnerships have intensified, indicating a robust framework for future project developments.
Tunisia Solar Power Equipment Market - Key Attractiveness of the Report
- 10 Years of Market Numbers
- Historical Data Starting from 2022 to 2025
- Base Year: 2025
- Forecast Data until 2032
- Key Performance Indicators Impacting the Market
- Major Upcoming Developments and Projects
Key Highlights of the Report:
- Tunisia Solar Power Equipment Market Outlook
- Market Size of Tunisia Solar Power Equipment Market, 2025
- Forecast of Tunisia Solar Power Equipment Market, 2032
- Historical Data and Forecast of Tunisia Solar Power Equipment Revenues & Volume for the Period 2022-2032F
- Tunisia Solar Power Equipment Market Trend Evolution
- Tunisia Solar Power Equipment Market Drivers and Challenges
- Tunisia Solar Power Equipment Price Trends
- Tunisia Solar Power Equipment Porter's Five Forces
- Tunisia Solar Power Equipment Industry Life Cycle
- Historical Data and Forecast of Tunisia Solar Power Equipment Market Revenues & Volume By Equipment for the Period 2022-2032F
- Historical Data and Forecast of Tunisia Solar Power Equipment Market Revenues & Volume By Solar Panels for the Period 2022-2032F
- Historical Data and Forecast of Tunisia Solar Power Equipment Market Revenues & Volume By Mounting, Racking & Tracking System for the Period 2022-2032F
- Historical Data and Forecast of Tunisia Solar Power Equipment Market Revenues & Volume By Storage System for the Period 2022-2032F
- Historical Data and Forecast of Tunisia Solar Power Equipment Market Revenues & Volume By Others for the Period 2022-2032F
- Historical Data and Forecast of Tunisia Solar Power Equipment Market Revenues & Volume By Application for the Period 2022-2032F
- Historical Data and Forecast of Tunisia Solar Power Equipment Market Revenues & Volume By Residential for the Period 2022-2032F
- Historical Data and Forecast of Tunisia Solar Power Equipment Market Revenues & Volume By Nonresidential for the Period 2022-2032F
- Historical Data and Forecast of Tunisia Solar Power Equipment Market Revenues & Volume By Utility for the Period 2022-2032F
- Tunisia Solar Power Equipment Import Export Trade Statistics
- Market Opportunity Assessment By Equipment
- Market Opportunity Assessment By Application
- Tunisia Solar Power Equipment Top Companies Market Share
- Tunisia Solar Power Equipment Competitive Benchmarking By Technical and Operational Parameters
- Tunisia Solar Power Equipment Company Profiles
- Tunisia Solar Power Equipment Key Strategic Recommendations
Frequently Asked Questions About the Market Study (FAQs):
The market is estimated to reach USD 1928 Million by 2032, starting from USD 1150 Million in 2025, reflecting a CAGR of 7.7% from 2026 to 2032.
Government policies, such as the National Renewable Energy Action Plan, are critical in promoting solar energy through incentives and defined targets, creating a favorable environment for investments.
There is a notable demand for solar panels, inverters, and energy storage systems as various sectors move towards adopting solar energy solutions for economic and environmental benefits.
Investors encounter challenges such as regulatory uncertainties and high initial setup costs, which can affect project viability and long-term returns.
The outlook is optimistic, driven by governmental support, technological advancements, and growing public interest in sustainable energy, positioning the market for significant growth in the coming years.
6Wresearch actively monitors the Tunisia Solar Power Equipment Market and publishes its comprehensive annual report, highlighting emerging trends, growth drivers, revenue analysis, and forecast outlook. Our insights help businesses to make data-backed strategic decisions with ongoing market dynamics. Our analysts track relevent industries related to the Tunisia Solar Power Equipment Market, allowing our clients with actionable intelligence and reliable forecasts tailored to emerging regional needs.
Yes, we provide customisation as per your requirements. To learn more, feel free to contact us on sales@6wresearch.com
1 Executive Summary |
2 Introduction |
2.1 Key Highlights of the Report |
2.2 Report Description |
2.3 Market Scope & Segmentation |
2.4 Research Methodology |
2.5 Assumptions |
3 Tunisia Solar Power Equipment Market Overview |
3.1 Tunisia Country Macro Economic Indicators |
3.2 Tunisia Solar Power Equipment Market Revenues & Volume, 2022 & 2032F |
3.3 Tunisia Solar Power Equipment Market - Industry Life Cycle |
3.4 Tunisia Solar Power Equipment Market - Porter's Five Forces |
3.5 Tunisia Solar Power Equipment Market Revenues & Volume Share, By Equipment, 2022 & 2032F |
3.6 Tunisia Solar Power Equipment Market Revenues & Volume Share, By Application, 2022 & 2032F |
4 Tunisia Solar Power Equipment Market Dynamics |
4.1 Impact Analysis |
4.2 Market Drivers |
4.2.1 Increasing government support and incentives for solar power projects in Tunisia |
4.2.2 Growing awareness and adoption of renewable energy sources |
4.2.3 Rising demand for clean energy solutions to reduce carbon footprint |
4.3 Market Restraints |
4.3.1 High initial investment costs for solar power equipment |
4.3.2 Lack of skilled workforce for solar power projects in Tunisia |
4.3.3 Limited grid infrastructure and storage solutions for solar power |
5 Tunisia Solar Power Equipment Market Trends |
6 Tunisia Solar Power Equipment Market, By Types |
6.1 Tunisia Solar Power Equipment Market, By Equipment |
6.1.1 Overview and Analysis |
6.1.2 Tunisia Solar Power Equipment Market Revenues & Volume, By Equipment, 2022-2032F |
6.1.3 Tunisia Solar Power Equipment Market Revenues & Volume, By Solar Panels, 2022-2032F |
6.1.4 Tunisia Solar Power Equipment Market Revenues & Volume, By Mounting, Racking & Tracking System, 2022-2032F |
6.1.5 Tunisia Solar Power Equipment Market Revenues & Volume, By Storage System, 2022-2032F |
6.1.6 Tunisia Solar Power Equipment Market Revenues & Volume, By Others, 2022-2032F |
6.2 Tunisia Solar Power Equipment Market, By Application |
6.2.1 Overview and Analysis |
6.2.2 Tunisia Solar Power Equipment Market Revenues & Volume, By Residential, 2022-2032F |
6.2.3 Tunisia Solar Power Equipment Market Revenues & Volume, By Nonresidential, 2022-2032F |
6.2.4 Tunisia Solar Power Equipment Market Revenues & Volume, By Utility, 2022-2032F |
7 Tunisia Solar Power Equipment Market Import-Export Trade Statistics |
7.1 Tunisia Solar Power Equipment Market Export to Major Countries |
7.2 Tunisia Solar Power Equipment Market Imports from Major Countries |
8 Tunisia Solar Power Equipment Market Key Performance Indicators |
8.1 Average installation time for solar power projects in Tunisia |
8.2 Percentage of energy consumption from solar power sources |
8.3 Number of research and development initiatives focused on improving solar power technology in Tunisia |
9 Tunisia Solar Power Equipment Market - Opportunity Assessment |
9.1 Tunisia Solar Power Equipment Market Opportunity Assessment, By Equipment, 2022 & 2032F |
9.2 Tunisia Solar Power Equipment Market Opportunity Assessment, By Application, 2022 & 2032F |
10 Tunisia Solar Power Equipment Market - Competitive Landscape |
10.1 Tunisia Solar Power Equipment Market Revenue Share, By Companies, 2025 |
10.2 Tunisia Solar Power Equipment Market Competitive Benchmarking, By Operating and Technical Parameters |
11 Company Profiles |
12 Recommendations |
13 Disclaimer |
Global Go To Market Strategy - 2030
Export potential enables firms to identify high-growth global markets with greater confidence by combining advanced trade intelligence with a structured quantitative methodology. The framework analyzes emerging demand trends and country-level import patterns while integrating macroeconomic and trade datasets such as GDP and population forecasts, bilateral import–export flows, tariff structures, elasticity differentials between developed and developing economies, geographic distance, and import demand projections. Using weighted trade values from 2020–2024 as the base period to project country-to-country export potential for 2030, these inputs are operationalized through calculated drivers such as gravity model parameters, tariff impact factors, and projected GDP per-capita growth. Through an analysis of hidden potentials, demand hotspots, and market conditions that are most favorable to success, this method enables firms to focus on target countries, maximize returns, and global expansion with data, backed by accuracy.
By factoring in the projected importer demand gap that is currently unmet and could be potential opportunity, it identifies the potential for the Exporter (Country) among 190 countries, against the general trade analysis, which identifies the biggest importer or exporter.
To discover high-growth global markets and optimize your business strategy:
Click Here
Pricing
- Single User License$ 1,995
- Department License$ 2,400
- Site License$ 3,120
- Global License$ 3,795

Leadership Perspectives from Industry Events
Search
Thought Leadership and Analyst Meet


Our Clients
6WResearch In News
- India Air Conditioner Market Set for Strong Rebound in 2026 After Weather-Led Correction and GST-Driven Recovery: 6Wresearch
- ADAS in India: How Automatic Emergency Braking, Blind Spot Detection & Driver Monitoring are Transforming Road Safety
- Doha a strategic location for EV manufacturing hub: IPA Qatar
- Demand for luxury TVs surging in the GCC, says Samsung
- Empowering Growth: The Thriving Journey of Bangladesh’s Cable Industry
- Demand for luxury TVs surging in the GCC, says Samsung
Latest Reports
- Nicaragua RPG Gaming Market (2026-2032)
- New Zealand RPG Gaming Market (2026-2032)
- Netherlands RPG Gaming Market (2026-2032)
- Nauru RPG Gaming Market (2026-2032)
- Namibia RPG Gaming Market (2026-2032)
- Mozambique RPG Gaming Market (2026-2032)
- Montenegro RPG Gaming Market (2026-2032)
- Mongolia RPG Gaming Market (2026-2032)
- Monaco RPG Gaming Market (2026-2032)
- Micronesia RPG Gaming Market (2026-2032)
Industry Events and Analyst Meet

EV India Expo 2026

HIMTEX 2026

India Refining Summit 2026

India EV Show 2026

EV tech India Expo 2026
Whitepaper
- Middle East & Africa Commercial Security Market Click here to view more.
- Middle East & Africa Fire Safety Systems & Equipment Market Click here to view more.
- GCC Drone Market Click here to view more.
- Middle East Lighting Fixture Market Click here to view more.
- GCC Physical & Perimeter Security Market Click here to view more.