Turkey Power Supply Market (2026-2032) | Growth, Analysis, Share, Outlook, Companies, Forecast, Industry, Value, Trends, Size & Revenue
Market Forecast By Output Power (Power Supply With Low Output (500 W and Below), Power Supply With Medium Output (500–1,000 W), Power Supply With High Output (More Than 1,000 W)), By Type (AC-DC Power Supply, DC-DC Power Supply), By Vertical (Medical & Healthcare, Military & Aerospace, Telecommunications, Consumer Electronics, Transportation, Lighting, Food & Beverages, Industrial) And Competitive Landscape
| Product Code: ETC014218 | Publication Date: Oct 2020 | Updated Date: Jun 2026 | Product Type: Report | |
| Publisher: 6Wresearch | Author: Ravi Bhandari | No. of Pages: 70 | No. of Figures: 35 | No. of Tables: 5 |
Turkey Power Supply Market Summary
The turkey power supply market was estimated at USD 260 Million in 2025 and is projected to reach USD 355 Million by 2032, growing at a CAGR of 5.1% from 2026 to 2032.
Turkey Power Supply Market Growth Rate Analysis (2021-2032)
The Turkey power supply market has shown stable growth, characterized by a yearly increase of 5.7% in 2021, followed by 5.1% in 2022. This growth can be attributed to rising consumer demand and significant investments in renewable energy infrastructure, which are essential for Turkey's energy transition strategy. In 2023, growth returned to 5.6%, reflecting ongoing technological advancements that improve efficiency in power generation. Although the growth rate dipped slightly to 5.1% in 2024, it stabilized around 5.2%-5.3% through 2028. Continued government support for sustainable energy initiatives and digitalization efforts are expected to maintain this upward trend, reinforcing Turkey's commitment to enhancing its power supply landscape.
Turkey Power Supply Market Year-wise Growth Rate and Key Drivers
This graph highlights how the Turkey Power Supply Market has steadily grown over the past five years, supported by major growth factors.
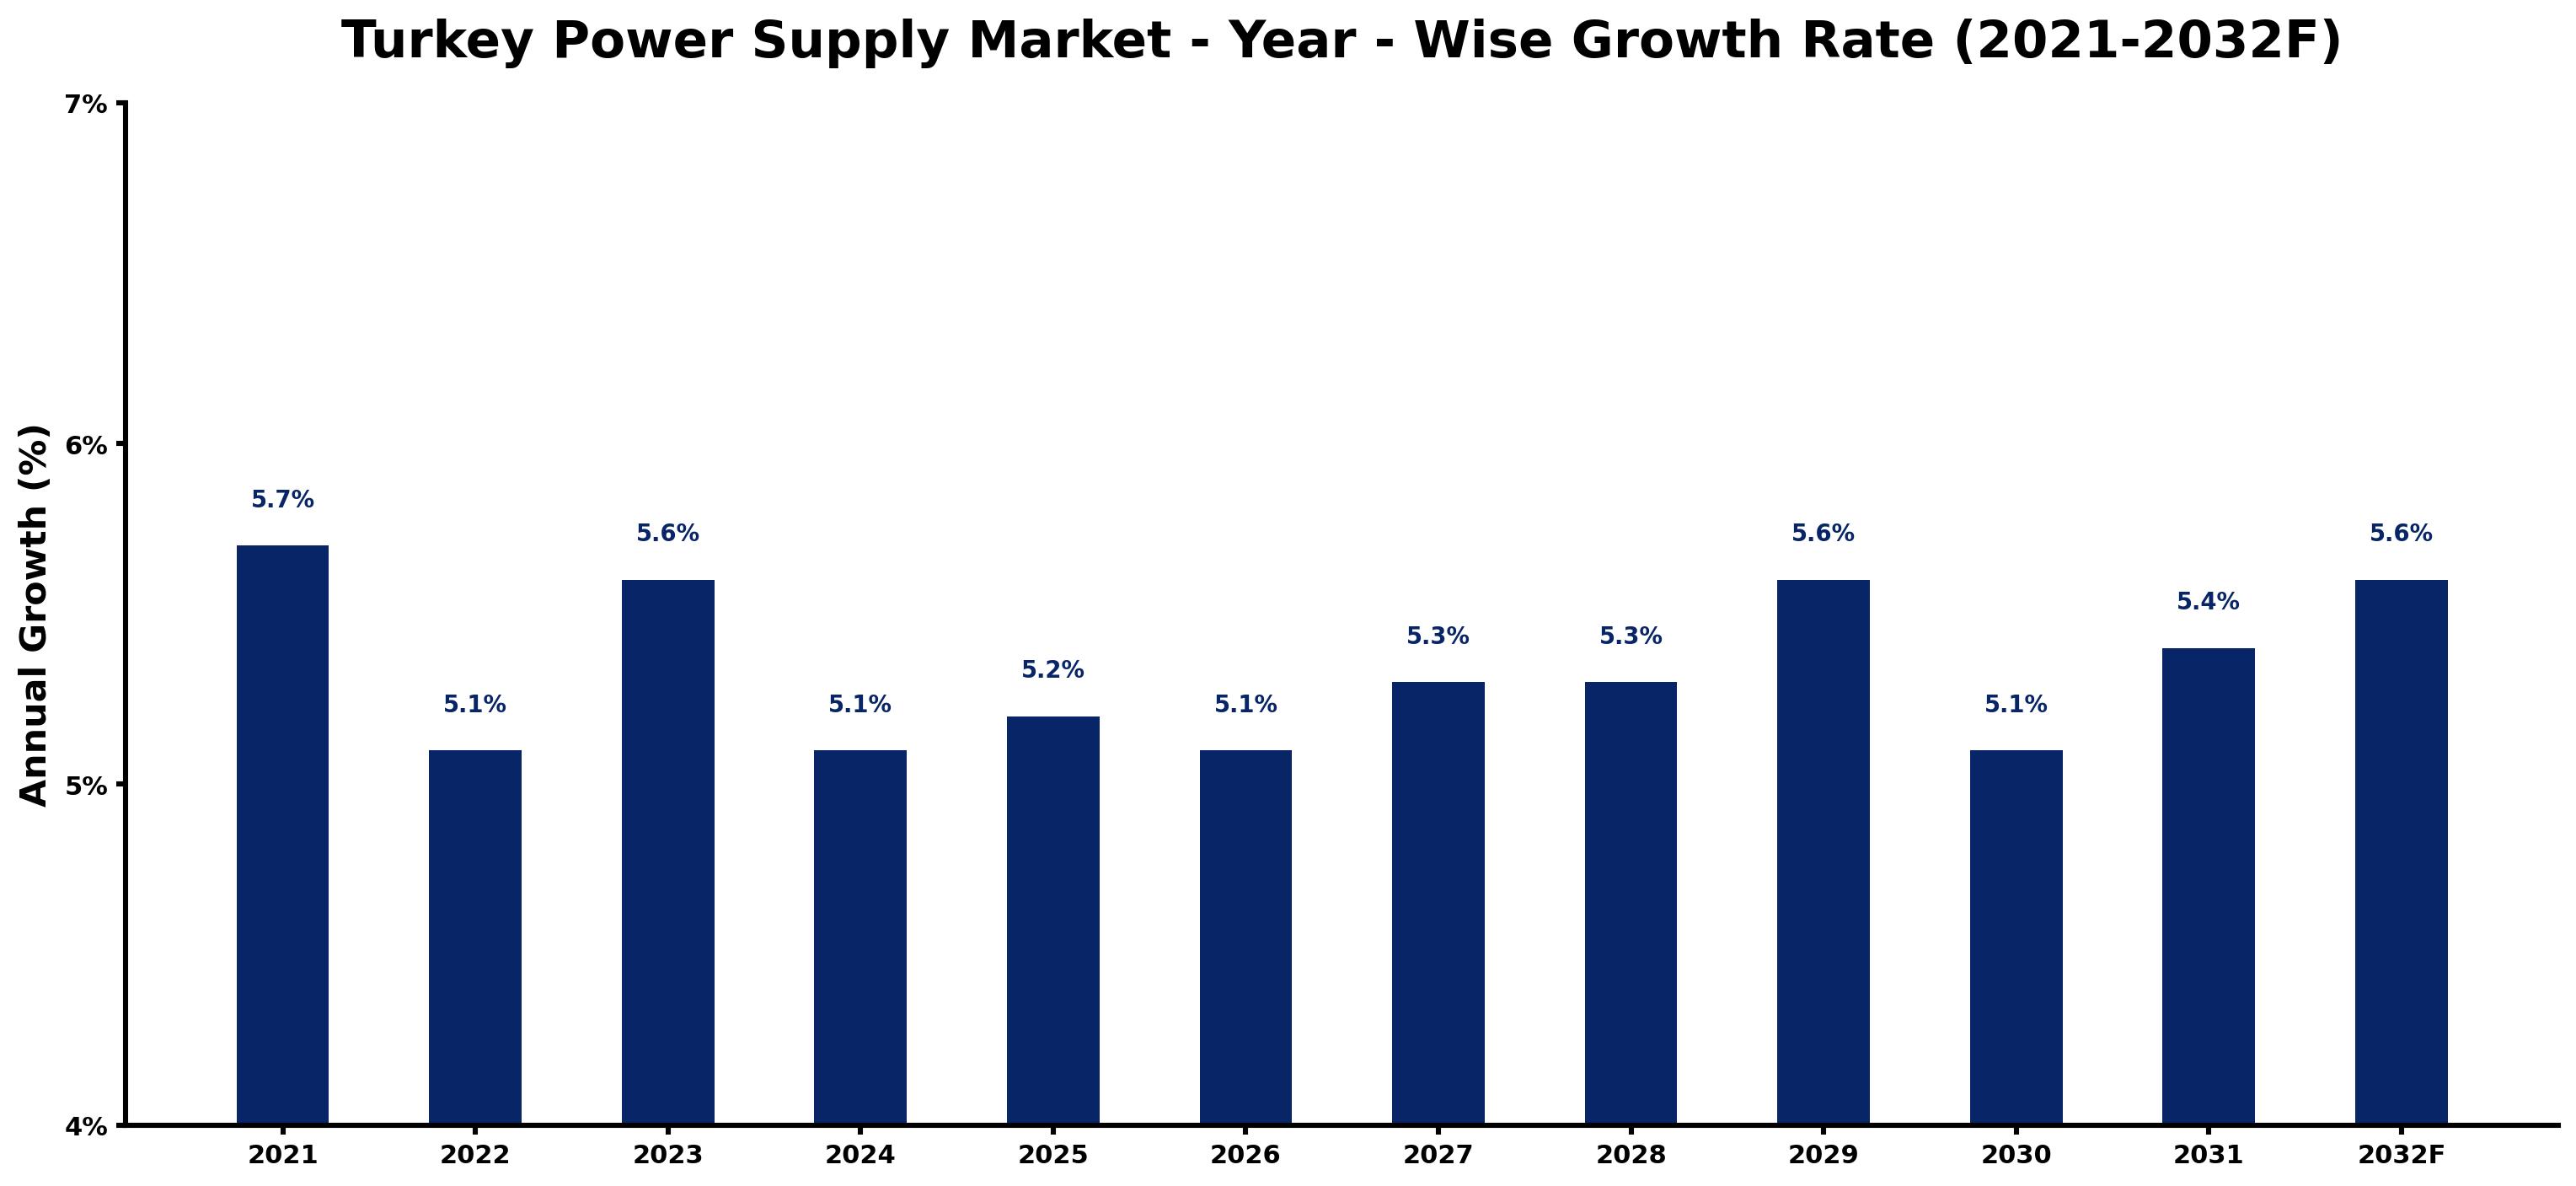
The table below presents the year wise growth rates along with the key drivers influencing the market
| Year | Growth Rate | Major Drivers |
| 2021 | 5.7% | Post-pandemic recovery saw a spike in energy consumption across sectors. |
| 2022 | 5.1% | Urbanization trends led to greater electricity needs in metropolitan regions. |
| 2023 | 5.6% | Technological investments in renewables began reshaping energy supply dynamics. |
| 2024 | 5.1% | Inertia in legacy infrastructure prompted modernization efforts across utility companies. |
| 2025 | 5.2% | Increased industrial activity bolstered energy requirements, particularly in manufacturing. |
| 2026 | 5.1% | Public-private partnerships emerged, enhancing investment in energy efficiency projects. |
| 2027 | 5.3% | The construction sector flourished, escalating demand for reliable power sources. |
| 2028 | 5.3% | Smart grid technologies started gaining traction, improving overall network reliability. |
| 2029 | 5.6% | Rural electrification initiatives expanded, connecting underserved communities to the grid. |
| 2030 | 5.1% | Consumer preferences shifted toward sustainable energy sources, driving market evolution. |
| 2031 | 5.4% | Regional cooperation facilitated cross-border energy trade, optimizing supply chains. |
| 2032 | 5.6% | Emerging start-ups focused on energy innovation began disrupting traditional markets. |
Note - Market size estimations and growth projections presented in this report are based on 6Wresearch's advanced forecasting approach, validated with industry datasets as of June 2026.
Turkey Power Supply Market Synopsis
The Turkey Power Supply Market is projected to reach 5.1% and witness significant growth during the forecast period (2026-2032). The burgeoning demand for efficient and reliable power solutions across diverse sectors, including electronics, telecommunications, and industrial automation, is shaping the landscape of power supplies in the region. As technological advancements and the proliferation of smart devices and IoT applications continue, the necessity for robust power management solutions becomes increasingly evident. Moreover, Turkey's governmental initiatives aimed at bolstering the nation's energy infrastructure and promoting renewable energy sources further stimulate demand for advanced power supply systems.
Turkey Power Supply Market Growth Drivers
The Turkey Power Supply Market is primarily driven by several key factors that enhance its growth trajectory. The following points illustrate the main drivers of this emerging market:
- The extensive application of power supplies in the electronics sector, facilitating the conversion and regulation of electrical energy to meet a wide range of device requirements, significantly contributes to market growth.
- Telecommunications advancements boost demand for reliable power supplies to ensure uninterrupted service, especially with the growing reliance on mobile data and connectivity.
- The industrial automation sector's evolution necessitates innovative power management solutions, driving the need for energy-efficient power supplies that integrate seamlessly with automated systems.
- The increasing installation of renewable energy sources, such as solar and wind power, requires sophisticated power conversion and management systems that adhere to modern efficiency standards.
- Government initiatives aimed at modernizing energy infrastructure encourage investments in power supply technologies, further enhancing efficiency and reliability in electricity delivery.
Turkey Power Supply Market Challenges and Restraints
Despite its potential, the Turkey Power Supply Market encounters significant challenges that could hinder its growth. Key issues include:
- The requirement for consistent and stable power delivery is threatened by grid instability and voltage fluctuations that can disrupt service and affect equipment efficiency.
- Rapid technological advancements necessitate substantial investment in quality assurance and compliance testing, adding financial and operational pressures for manufacturers.
- Adhering to strict regulatory compliance standards regarding safety and electromagnetic compatibility complicates product certification, thus deterring new entrants into the market.
- The volatility in economic factors can impact industrial investments and consumer electronics demand, leading to unpredictable market conditions and profitability challenges.
- Intensifying global competition and potential supply chain disruptions may create hurdles in market penetration and product availability, affecting overall growth rates.
Turkey Power Supply Market Government Investment and Initiatives
The Turkish government is actively investing in initiatives that promote the growth of the power supply market. Policies focusing on energy sector liberalization and tax incentives for renewable energy projects underscore an intent to attract both local and foreign investments.
Additionally, substantial public spending on grid infrastructure improvements aims to enhance the reliability of electricity supply across the country. These policies not only facilitate the integration of renewable energy sources into the national grid but also encourage the development of energy storage solutions, which are essential for managing the supply-demand balance. Such governmental engagements create an environment conducive to technological advancements in power supply systems that prioritize efficiency and reliability.
Turkey Power Supply Market Latest Developments (May 2025 - June 2026)
Recent industry developments from May 2025 to June 2026 highlight a series of strategic movements within the Turkey Power Supply Market. Companies are increasingly focused on enhancing energy efficiency through innovative technology solutions, particularly in response to both domestic needs and international competitive pressures.
Moreover, the ongoing investments in smart grid technologies are fostering a more reliable and resilient power supply infrastructure, which is critical considering the rising complexity of energy demands. Efforts to streamline regulatory processes for renewable energy integrations signify a proactive approach to attract investments in clean technologies. These developments indicate a robust trajectory of advancement as the market prepares for future challenges and opportunities.
Turkey Power Supply Market - Key Attractiveness of the Report
- 10 Years of Market Numbers
- Historical Data Starting from 2022 to 2025
- Base Year: 2025
- Forecast Data until 2032
- Key Performance Indicators Impacting the Market
- Major Upcoming Developments and Projects
Key Highlights of the Report:
- Turkey Power Supply Market Outlook
- Market Size of Turkey Power Supply Market, 2025
- Forecast of Turkey Power Supply Market, 2032
- Historical Data and Forecast of Turkey Power Supply Revenues & Volume for the Period 2022-2032F
- Turkey Power Supply Market Trend Evolution
- Turkey Power Supply Market Drivers and Challenges
- Turkey Power Supply Price Trends
- Turkey Power Supply Porter's Five Forces
- Turkey Power Supply Industry Life Cycle
- Historical Data and Forecast of Turkey Power Supply Market Revenues & Volume By Output Power for the Period 2022-2032F
- Historical Data and Forecast of Turkey Power Supply Market Revenues & Volume By Power Supply With Low Output (500 W and Below) for the Period 2022-2032F
- Historical Data and Forecast of Turkey Power Supply Market Revenues & Volume By Power Supply With Medium Output (500?1,000 W) for the Period 2022-2032F
- Historical Data and Forecast of Turkey Power Supply Market Revenues & Volume By Power Supply With High Output (More Than 1,000 W) for the Period 2022-2032F
- Historical Data and Forecast of Turkey Power Supply Market Revenues & Volume By Type for the Period 2022-2032F
- Historical Data and Forecast of Turkey Power Supply Market Revenues & Volume By AC-DC Power Supply for the Period 2022-2032F
- Historical Data and Forecast of Turkey Power Supply Market Revenues & Volume By DC-DC Power Supply for the Period 2022-2032F
- Historical Data and Forecast of Turkey Power Supply Market Revenues & Volume By Vertical for the Period 2022-2032F
- Historical Data and Forecast of Turkey Power Supply Market Revenues & Volume By Medical & Healthcare for the Period 2022-2032F
- Historical Data and Forecast of Turkey Power Supply Market Revenues & Volume By Military & Aerospace for the Period 2022-2032F
- Historical Data and Forecast of Turkey Power Supply Market Revenues & Volume By Telecommunications for the Period 2022-2032F
- Historical Data and Forecast of Turkey Power Supply Market Revenues & Volume By Consumer Electronics for the Period 2022-2032F
- Historical Data and Forecast of Turkey Power Supply Market Revenues & Volume By Transportation for the Period 2022-2032F
- Historical Data and Forecast of Turkey Power Supply Market Revenues & Volume By Lighting for the Period 2022-2032F
- Historical Data and Forecast of Turkey Power Supply Market Revenues & Volume By Food & Beverages for the Period 2022-2032F
- Historical Data and Forecast of Turkey Power Supply Market Revenues & Volume By Industrial for the Period 2022-2032F
- Turkey Power Supply Import Export Trade Statistics
- Market Opportunity Assessment By Output Power
- Market Opportunity Assessment By Type
- Market Opportunity Assessment By Vertical
- Turkey Power Supply Top Companies Market Share
- Turkey Power Supply Competitive Benchmarking By Technical and Operational Parameters
- Turkey Power Supply Company Profiles
- Turkey Power Supply Key Strategic Recommendations
Frequently Asked Questions About the Market Study (FAQs):
The market's growth is primarily driven by increasing demand for reliable power solutions in electronics, telecommunications, and industrial automation, alongside governmental initiatives promoting renewable energy.
The market faces challenges related to grid instability, regulatory compliance, and competition from global suppliers, which can impact reliability and profitability.
The government supports the sector through policies aimed at liberalizing the energy market, investing in infrastructure, and promoting renewable energy initiatives.
Key trends include advancements in smart grid technologies and energy-efficient systems that cater to the demands of modern electronic and industrial applications.
6Wresearch actively monitors the Turkey Power Supply Market and publishes its comprehensive annual report, highlighting emerging trends, growth drivers, revenue analysis, and forecast outlook. Our insights help businesses to make data-backed strategic decisions with ongoing market dynamics. Our analysts track relevent industries related to the Turkey Power Supply Market, allowing our clients with actionable intelligence and reliable forecasts tailored to emerging regional needs.
Yes, we provide customisation as per your requirements. To learn more, feel free to contact us on sales@6wresearch.com
1 Executive Summary |
2 Introduction |
2.1 Key Highlights of the Report |
2.2 Report Description |
2.3 Market Scope & Segmentation |
2.4 Research Methodology |
2.5 Assumptions |
3 Turkey Power Supply Market Overview |
3.1 Turkey Country Macro Economic Indicators |
3.2 Turkey Power Supply Market Revenues & Volume, 2022 & 2032F |
3.3 Turkey Power Supply Market - Industry Life Cycle |
3.4 Turkey Power Supply Market - Porter's Five Forces |
3.5 Turkey Power Supply Market Revenues & Volume Share, By Output Power, 2022 & 2032F |
3.6 Turkey Power Supply Market Revenues & Volume Share, By Type, 2022 & 2032F |
3.7 Turkey Power Supply Market Revenues & Volume Share, By Vertical, 2022 & 2032F |
4 Turkey Power Supply Market Dynamics |
4.1 Impact Analysis |
4.2 Market Drivers |
4.2.1 Increasing demand for electricity due to population growth and urbanization. |
4.2.2 Government initiatives to promote renewable energy sources in the power supply mix. |
4.2.3 Technological advancements leading to more efficient power generation and distribution systems. |
4.3 Market Restraints |
4.3.1 High initial investment costs for renewable energy infrastructure. |
4.3.2 Regulatory challenges and policy uncertainty impacting market growth. |
4.3.3 Dependence on imported energy resources leading to vulnerability to price fluctuations. |
5 Turkey Power Supply Market Trends |
6 Turkey Power Supply Market, By Types |
6.1 Turkey Power Supply Market, By Output Power |
6.1.1 Overview and Analysis |
6.1.2 Turkey Power Supply Market Revenues & Volume, By Output Power, 2022-2032F |
6.1.3 Turkey Power Supply Market Revenues & Volume, By Power Supply With Low Output (500 W and Below), 2022-2032F |
6.1.4 Turkey Power Supply Market Revenues & Volume, By Power Supply With Medium Output (500?1,000 W), 2022-2032F |
6.1.5 Turkey Power Supply Market Revenues & Volume, By Power Supply With High Output (More Than 1,000 W), 2022-2032F |
6.2 Turkey Power Supply Market, By Type |
6.2.1 Overview and Analysis |
6.2.2 Turkey Power Supply Market Revenues & Volume, By AC-DC Power Supply, 2022-2032F |
6.2.3 Turkey Power Supply Market Revenues & Volume, By DC-DC Power Supply, 2022-2032F |
6.3 Turkey Power Supply Market, By Vertical |
6.3.1 Overview and Analysis |
6.3.2 Turkey Power Supply Market Revenues & Volume, By Medical & Healthcare, 2022-2032F |
6.3.3 Turkey Power Supply Market Revenues & Volume, By Military & Aerospace, 2022-2032F |
6.3.4 Turkey Power Supply Market Revenues & Volume, By Telecommunications, 2022-2032F |
6.3.5 Turkey Power Supply Market Revenues & Volume, By Consumer Electronics, 2022-2032F |
6.3.6 Turkey Power Supply Market Revenues & Volume, By Transportation, 2022-2032F |
6.3.7 Turkey Power Supply Market Revenues & Volume, By Lighting, 2022-2032F |
6.3.8 Turkey Power Supply Market Revenues & Volume, By Industrial, 2022-2032F |
6.3.9 Turkey Power Supply Market Revenues & Volume, By Industrial, 2022-2032F |
7 Turkey Power Supply Market Import-Export Trade Statistics |
7.1 Turkey Power Supply Market Export to Major Countries |
7.2 Turkey Power Supply Market Imports from Major Countries |
8 Turkey Power Supply Market Key Performance Indicators |
8.1 Percentage of electricity generated from renewable sources. |
8.2 Average electricity consumption per capita. |
8.3 Investment in research and development for energy technologies. |
8.4 Percentage of households with access to reliable electricity supply. |
8.5 Energy efficiency improvements in power generation and distribution systems. |
9 Turkey Power Supply Market - Opportunity Assessment |
9.1 Turkey Power Supply Market Opportunity Assessment, By Output Power, 2022 & 2032F |
9.2 Turkey Power Supply Market Opportunity Assessment, By Type, 2022 & 2032F |
9.3 Turkey Power Supply Market Opportunity Assessment, By Vertical, 2022 & 2032F |
10 Turkey Power Supply Market - Competitive Landscape |
10.1 Turkey Power Supply Market Revenue Share, By Companies, 2025 |
10.2 Turkey Power Supply Market Competitive Benchmarking, By Operating and Technical Parameters |
11 Company Profiles |
12 Recommendations |
13 Disclaimer |
Global Go To Market Strategy - 2030
Export potential enables firms to identify high-growth global markets with greater confidence by combining advanced trade intelligence with a structured quantitative methodology. The framework analyzes emerging demand trends and country-level import patterns while integrating macroeconomic and trade datasets such as GDP and population forecasts, bilateral import–export flows, tariff structures, elasticity differentials between developed and developing economies, geographic distance, and import demand projections. Using weighted trade values from 2020–2024 as the base period to project country-to-country export potential for 2030, these inputs are operationalized through calculated drivers such as gravity model parameters, tariff impact factors, and projected GDP per-capita growth. Through an analysis of hidden potentials, demand hotspots, and market conditions that are most favorable to success, this method enables firms to focus on target countries, maximize returns, and global expansion with data, backed by accuracy.
By factoring in the projected importer demand gap that is currently unmet and could be potential opportunity, it identifies the potential for the Exporter (Country) among 190 countries, against the general trade analysis, which identifies the biggest importer or exporter.
To discover high-growth global markets and optimize your business strategy:
Click Here
Pricing
- Single User License$ 1,995
- Department License$ 2,400
- Site License$ 3,120
- Global License$ 3,795

Leadership Perspectives from Industry Events
Search
Thought Leadership and Analyst Meet


Our Clients
6WResearch In News
- India Air Conditioner Market Set for Strong Rebound in 2026 After Weather-Led Correction and GST-Driven Recovery: 6Wresearch
- ADAS in India: How Automatic Emergency Braking, Blind Spot Detection & Driver Monitoring are Transforming Road Safety
- Doha a strategic location for EV manufacturing hub: IPA Qatar
- Demand for luxury TVs surging in the GCC, says Samsung
- Empowering Growth: The Thriving Journey of Bangladesh’s Cable Industry
- Demand for luxury TVs surging in the GCC, says Samsung
Latest Reports
- Nicaragua RPG Gaming Market (2026-2032)
- New Zealand RPG Gaming Market (2026-2032)
- Netherlands RPG Gaming Market (2026-2032)
- Nauru RPG Gaming Market (2026-2032)
- Namibia RPG Gaming Market (2026-2032)
- Mozambique RPG Gaming Market (2026-2032)
- Montenegro RPG Gaming Market (2026-2032)
- Mongolia RPG Gaming Market (2026-2032)
- Monaco RPG Gaming Market (2026-2032)
- Micronesia RPG Gaming Market (2026-2032)
Industry Events and Analyst Meet

HIMTEX 2026

India Refining Summit 2026

India EV Show 2026

EV tech India Expo 2026

Auto Tech Asia 2026
Whitepaper
- Middle East & Africa Commercial Security Market Click here to view more.
- Middle East & Africa Fire Safety Systems & Equipment Market Click here to view more.
- GCC Drone Market Click here to view more.
- Middle East Lighting Fixture Market Click here to view more.
- GCC Physical & Perimeter Security Market Click here to view more.