Armenia Power Supply Market (2026-2032) | Industry, Share, Segmentation, Value, Companies, Forecast, Size, Revenue, Outlook, Trends, Analysis & Growth
Market Forecast By Output Power (Power Supply With Low Output (500 W and Below), Power Supply With Medium Output (500‚œ1,000 W), Power Supply With High Output (More Than 1,000 W)), By Type (AC-DC Power Supply, DC-DC Power Supply), By Vertical (Medical & Healthcare, Military & Aerospace, Telecommunications, Consumer Electronics, Transportation, Lighting, Food & Beverages, Industrial) And Competitive Landscape
| Product Code: ETC4800367 | Publication Date: Nov 2023 | Updated Date: Mar 2026 | Product Type: Market Research Report | |
| Publisher: 6Wresearch | Author: Sachin Kumar Rai | No. of Pages: 60 | No. of Figures: 30 | No. of Tables: 5 |
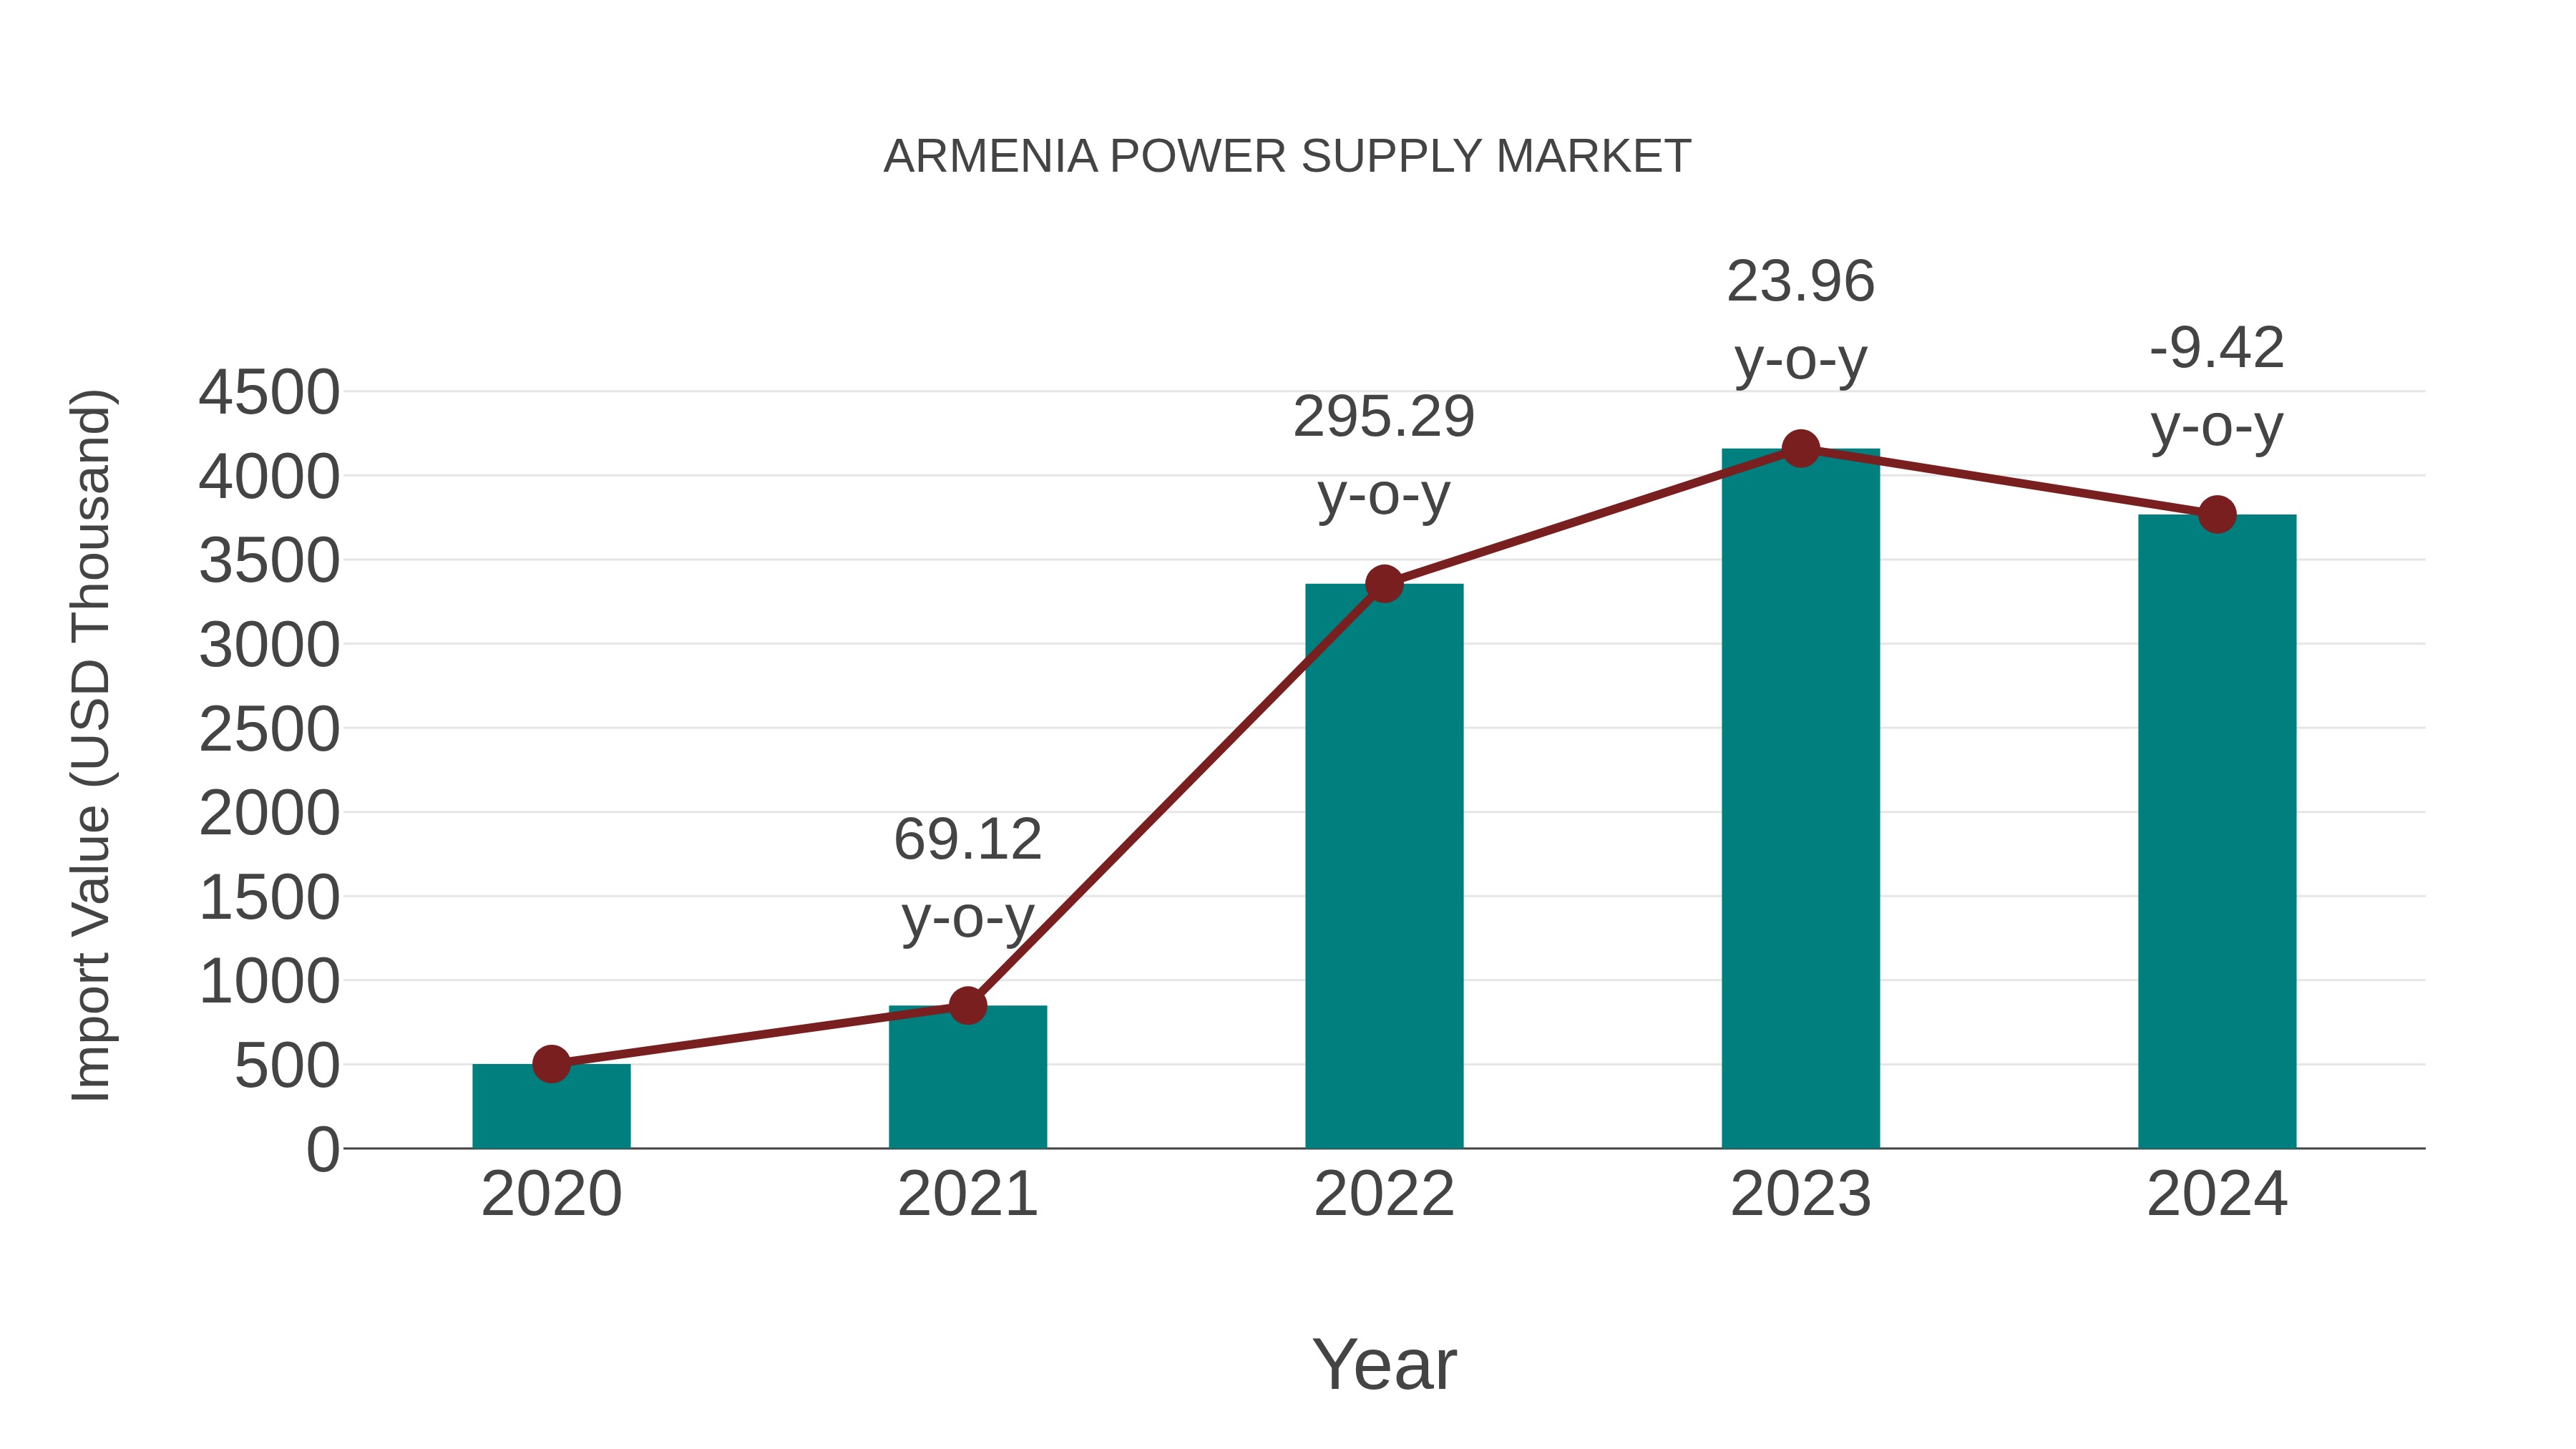
Armenia Power Supply Market: Import Trend Analysis
During 2020-2024, the Armenia power supply market witnessed a significant increase in imports, with a Compound Annual Growth Rate (CAGR) of 65.52%. In 2023-2024, the year-on-year growth rate was -9.42%, indicating a slight decline compared to previous years. Despite this decrease in 2024, the overall trend showed a substantial rise in imports over the period.
Armenia Power Supply Market Overview
Armenia`s power supply market offers transformers, switchgear, and distribution equipment for delivering reliable electricity to residential, commercial, and industrial consumers. Power supply solutions focus on grid stability, load management, and renewable energy integration.
Drivers of the market
The power supply market in Armenia is driven by the need for reliable and efficient power solutions in various applications, such as industrial, commercial, and residential sectors. Power supplies are essential for converting and regulating electrical power to meet the specific requirements of different devices and systems. The increasing focus on energy efficiency and system reliability fuels the market. Additionally, the growth of the electronics and telecommunications industries, where power supplies play a crucial role, supports the demand. Technological advancements in power supply design and the development of more efficient and compact solutions further enhance market growth.
Challenges of the market
The Power Supply market in Armenia faces challenges such as ensuring grid reliability and resilience against power disruptions, optimizing supply-demand balance for electricity generation, and addressing energy import dependency. Innovating in renewable energy integration and promoting energy storage solutions are critical for achieving energy independence and sustainable power supply in Armenia.
Government Policy of the market
Armenian government policies concerning the power supply market emphasize regulatory frameworks, infrastructure development, and consumer protection. Policies aim to ensure reliable power supply, promote energy efficiency, and support investments in sustainable energy infrastructure.
Key Highlights of the Report:
- Armenia Power Supply Market Outlook
- Market Size of Armenia Power Supply Market, 2025
- Forecast of Armenia Power Supply Market, 2032
- Historical Data and Forecast of Armenia Power Supply Revenues & Volume for the Period 2022-2032F
- Armenia Power Supply Market Trend Evolution
- Armenia Power Supply Market Drivers and Challenges
- Armenia Power Supply Price Trends
- Armenia Power Supply Porter`s Five Forces
- Armenia Power Supply Industry Life Cycle
- Historical Data and Forecast of Armenia Power Supply Market Revenues & Volume By Output Power for the Period 2022-2032F
- Historical Data and Forecast of Armenia Power Supply Market Revenues & Volume By Power Supply With Low Output (500 W and Below) for the Period 2022-2032F
- Historical Data and Forecast of Armenia Power Supply Market Revenues & Volume By Power Supply With Medium Output (500???1,000 W) for the Period 2022-2032F
- Historical Data and Forecast of Armenia Power Supply Market Revenues & Volume By Power Supply With High Output (More Than 1,000 W) for the Period 2022-2032F
- Historical Data and Forecast of Armenia Power Supply Market Revenues & Volume By Type for the Period 2022-2032F
- Historical Data and Forecast of Armenia Power Supply Market Revenues & Volume By AC-DC Power Supply for the Period 2022-2032F
- Historical Data and Forecast of Armenia Power Supply Market Revenues & Volume By DC-DC Power Supply for the Period 2022-2032F
- Historical Data and Forecast of Armenia Power Supply Market Revenues & Volume By Vertical for the Period 2022-2032F
- Historical Data and Forecast of Armenia Power Supply Market Revenues & Volume By Medical & Healthcare for the Period 2022-2032F
- Historical Data and Forecast of Armenia Power Supply Market Revenues & Volume By Military & Aerospace for the Period 2022-2032F
- Historical Data and Forecast of Armenia Power Supply Market Revenues & Volume By Telecommunications for the Period 2022-2032F
- Historical Data and Forecast of Armenia Power Supply Market Revenues & Volume By Consumer Electronics for the Period 2022-2032F
- Historical Data and Forecast of Armenia Power Supply Market Revenues & Volume By Transportation for the Period 2022-2032F
- Historical Data and Forecast of Armenia Power Supply Market Revenues & Volume By Lighting for the Period 2022-2032F
- Historical Data and Forecast of Armenia Power Supply Market Revenues & Volume By Food & Beverages for the Period 2022-2032F
- Historical Data and Forecast of Armenia Power Supply Market Revenues & Volume By Industrial for the Period 2022-2032F
- Armenia Power Supply Import Export Trade Statistics
- Market Opportunity Assessment By Output Power
- Market Opportunity Assessment By Type
- Market Opportunity Assessment By Vertical
- Armenia Power Supply Top Companies Market Share
- Armenia Power Supply Competitive Benchmarking By Technical and Operational Parameters
- Armenia Power Supply Company Profiles
- Armenia Power Supply Key Strategic Recommendations
Armenia Power Supply Market (2026-2032): FAQs
6Wresearch actively monitors the Armenia Power Supply Market and publishes its comprehensive annual report, highlighting emerging trends, growth drivers, revenue analysis, and forecast outlook. Our insights help businesses to make data-backed strategic decisions with ongoing market dynamics. Our analysts track relevent industries related to the Armenia Power Supply Market, allowing our clients with actionable intelligence and reliable forecasts tailored to emerging regional needs.
Yes, we provide customisation as per your requirements. To learn more, feel free to contact us on sales@6wresearch.com
1 Executive Summary |
2 Introduction |
2.1 Key Highlights of the Report |
2.2 Report Description |
2.3 Market Scope & Segmentation |
2.4 Research Methodology |
2.5 Assumptions |
3 Armenia Power Supply Market Overview |
3.1 Armenia Country Macro Economic Indicators |
3.2 Armenia Power Supply Market Revenues & Volume, 2022 & 2032F |
3.3 Armenia Power Supply Market - Industry Life Cycle |
3.4 Armenia Power Supply Market - Porter's Five Forces |
3.5 Armenia Power Supply Market Revenues & Volume Share, By Output Power, 2022 & 2032F |
3.6 Armenia Power Supply Market Revenues & Volume Share, By Type, 2022 & 2032F |
3.7 Armenia Power Supply Market Revenues & Volume Share, By Vertical, 2022 & 2032F |
4 Armenia Power Supply Market Dynamics |
4.1 Impact Analysis |
4.2 Market Drivers |
4.3 Market Restraints |
5 Armenia Power Supply Market Trends |
6 Armenia Power Supply Market Segmentations |
6.1 Armenia Power Supply Market, By Output Power |
6.1.1 Overview and Analysis |
6.1.2 Armenia Power Supply Market Revenues & Volume, By Power Supply With Low Output (500 W and Below), 2022-2032F |
6.1.3 Armenia Power Supply Market Revenues & Volume, By Power Supply With Medium Output (500? ??1,000 W), 2022-2032F |
6.1.4 Armenia Power Supply Market Revenues & Volume, By Power Supply With High Output (More Than 1,000 W), 2022-2032F |
6.2 Armenia Power Supply Market, By Type |
6.2.1 Overview and Analysis |
6.2.2 Armenia Power Supply Market Revenues & Volume, By AC-DC Power Supply, 2022-2032F |
6.2.3 Armenia Power Supply Market Revenues & Volume, By DC-DC Power Supply, 2022-2032F |
6.3 Armenia Power Supply Market, By Vertical |
6.3.1 Overview and Analysis |
6.3.2 Armenia Power Supply Market Revenues & Volume, By Medical & Healthcare, 2022-2032F |
6.3.3 Armenia Power Supply Market Revenues & Volume, By Military & Aerospace, 2022-2032F |
6.3.4 Armenia Power Supply Market Revenues & Volume, By Telecommunications, 2022-2032F |
6.3.5 Armenia Power Supply Market Revenues & Volume, By Consumer Electronics, 2022-2032F |
6.3.6 Armenia Power Supply Market Revenues & Volume, By Transportation, 2022-2032F |
6.3.7 Armenia Power Supply Market Revenues & Volume, By Lighting, 2022-2032F |
6.3.8 Armenia Power Supply Market Revenues & Volume, By Industrial, 2022-2032F |
6.3.9 Armenia Power Supply Market Revenues & Volume, By Industrial, 2022-2032F |
7 Armenia Power Supply Market Import-Export Trade Statistics |
7.1 Armenia Power Supply Market Export to Major Countries |
7.2 Armenia Power Supply Market Imports from Major Countries |
8 Armenia Power Supply Market Key Performance Indicators |
9 Armenia Power Supply Market - Opportunity Assessment |
9.1 Armenia Power Supply Market Opportunity Assessment, By Output Power, 2022 & 2032F |
9.2 Armenia Power Supply Market Opportunity Assessment, By Type, 2022 & 2032F |
9.3 Armenia Power Supply Market Opportunity Assessment, By Vertical, 2022 & 2032F |
10 Armenia Power Supply Market - Competitive Landscape |
10.1 Armenia Power Supply Market Revenue Share, By Companies, 2025 |
10.2 Armenia Power Supply Market Competitive Benchmarking, By Operating and Technical Parameters |
11 Company Profiles |
12 Recommendations | 13 Disclaimer |
Global Go To Market Strategy - 2030
Export potential enables firms to identify high-growth global markets with greater confidence by combining advanced trade intelligence with a structured quantitative methodology. The framework analyzes emerging demand trends and country-level import patterns while integrating macroeconomic and trade datasets such as GDP and population forecasts, bilateral import–export flows, tariff structures, elasticity differentials between developed and developing economies, geographic distance, and import demand projections. Using weighted trade values from 2020–2024 as the base period to project country-to-country export potential for 2030, these inputs are operationalized through calculated drivers such as gravity model parameters, tariff impact factors, and projected GDP per-capita growth. Through an analysis of hidden potentials, demand hotspots, and market conditions that are most favorable to success, this method enables firms to focus on target countries, maximize returns, and global expansion with data, backed by accuracy.
By factoring in the projected importer demand gap that is currently unmet and could be potential opportunity, it identifies the potential for the Exporter (Country) among 190 countries, against the general trade analysis, which identifies the biggest importer or exporter.
To discover high-growth global markets and optimize your business strategy:
Click Here
Pricing
- Single User License$ 1,995
- Department License$ 2,400
- Site License$ 3,120
- Global License$ 3,795

Leadership Perspectives from Industry Events
Search
Thought Leadership and Analyst Meet


Our Clients
6WResearch In News
- India Export Attractiveness Tracker 2026
- India Air Conditioner Market Set for Strong Rebound in 2026 After Weather-Led Correction and GST-Driven Recovery: 6Wresearch
- ADAS in India: How Automatic Emergency Braking, Blind Spot Detection & Driver Monitoring are Transforming Road Safety
- Doha a strategic location for EV manufacturing hub: IPA Qatar
- Demand for luxury TVs surging in the GCC, says Samsung
- Empowering Growth: The Thriving Journey of Bangladesh’s Cable Industry
Latest Reports
- Nicaragua RPG Gaming Market (2026-2032)
- New Zealand RPG Gaming Market (2026-2032)
- Netherlands RPG Gaming Market (2026-2032)
- Nauru RPG Gaming Market (2026-2032)
- Namibia RPG Gaming Market (2026-2032)
- Mozambique RPG Gaming Market (2026-2032)
- Montenegro RPG Gaming Market (2026-2032)
- Mongolia RPG Gaming Market (2026-2032)
- Monaco RPG Gaming Market (2026-2032)
- Micronesia RPG Gaming Market (2026-2032)
Industry Events and Analyst Meet

EV India Expo 2026

HIMTEX 2026

India Refining Summit 2026

India EV Show 2026

EV tech India Expo 2026
Whitepaper
- Middle East & Africa Commercial Security Market Click here to view more.
- Middle East & Africa Fire Safety Systems & Equipment Market Click here to view more.
- GCC Drone Market Click here to view more.
- Middle East Lighting Fixture Market Click here to view more.
- GCC Physical & Perimeter Security Market Click here to view more.