United Arab Emirates (UAE) Billiard tables Market (2026-2032) Outlook | Trends, Share, Companies, Value, Growth, Revenue, Size, Analysis, Forecast & Industry
Market Forecast By Product Type (Snooker Billiards, American Pool Table, English Pool Tables, European Pool Table), By Application (Professional Competition, Leisure and Entertainment) And Competitive Landscape
| Product Code: ETC096839 | Publication Date: Jun 2021 | Updated Date: Jun 2026 | Product Type: Report | |
| Publisher: 6Wresearch | Author: Ravi Bhandari | No. of Pages: 70 | No. of Figures: 35 | No. of Tables: 5 |
United Arab Emirates (UAE) Billiard tables Market Size, Share & Growth Rate
The United Arab Emirates (UAE) Billiard tables Market was estimated at USD 193 Million in 2025 and is projected to reach USD 259 Million by 2032, growing at a CAGR of 4.3% from 2026 to 2032. This growth trajectory is primarily fueled by the increasing integration of billiards into the entertainment offerings of hotels and leisure facilities, along with a growing interest in indoor recreational activities among the youth. The appeal of billiards as a social pastime continues to bolster its demand across various demographics in the region.
United Arab Emirates (UAE) Billiard tables Market Year-wise Growth Rate and Key Drivers
This graph highlights how the United Arab Emirates (UAE) Billiard tables Market has steadily grown over the years, supported by major growth factors.
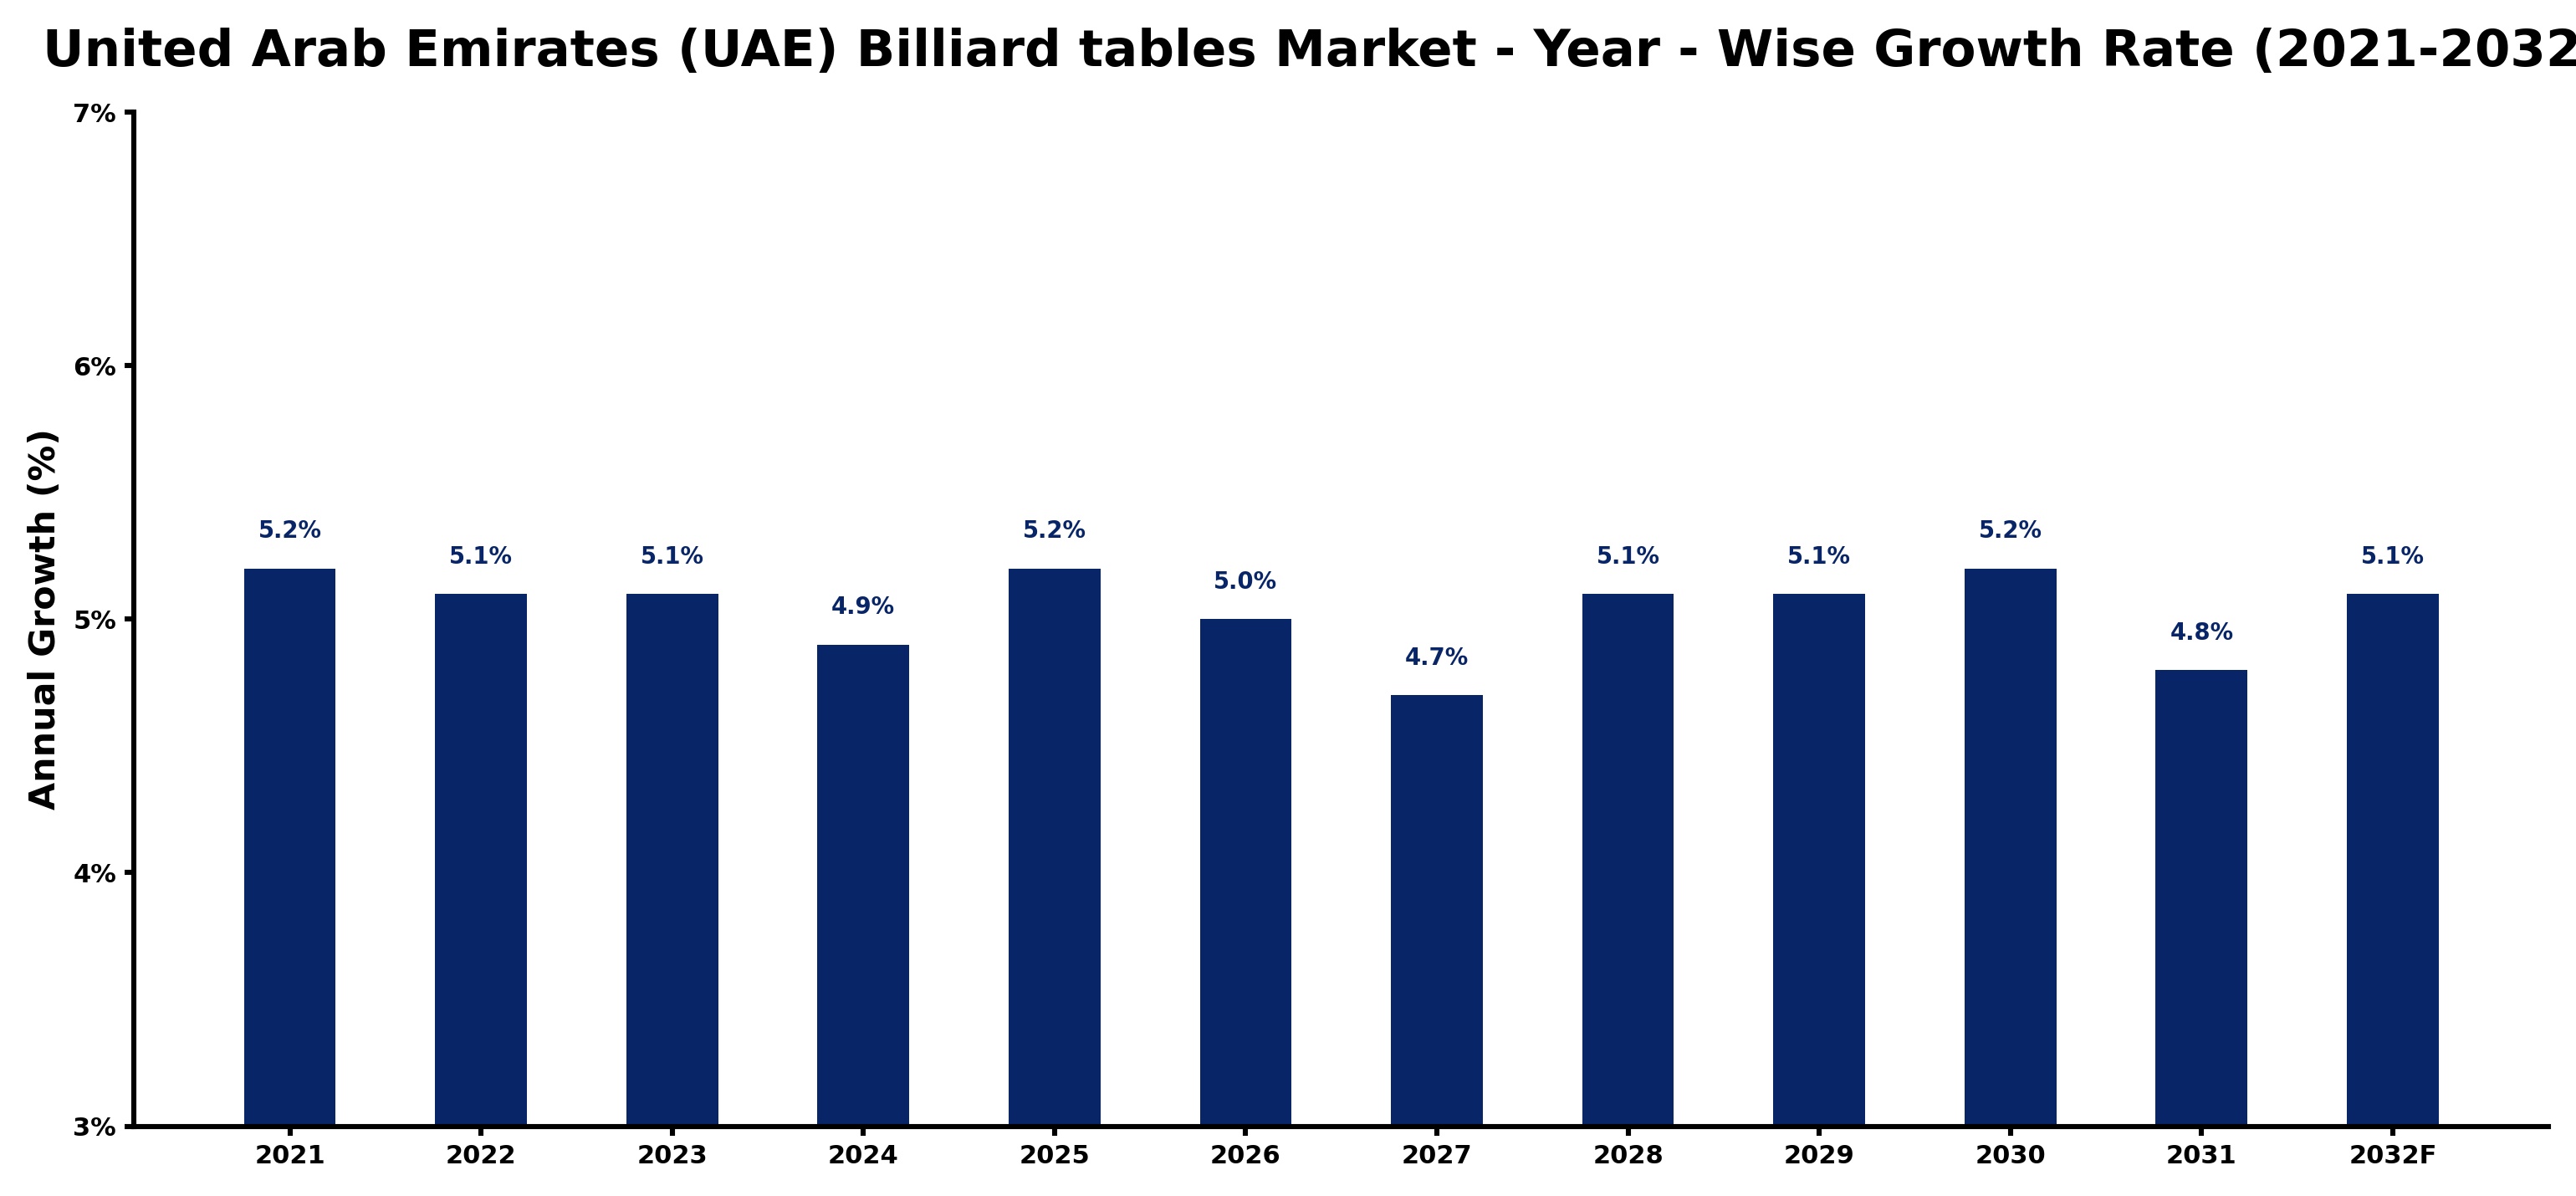
The table below presents the year‑wise growth rates along with the key drivers influencing the market
| Year | Growth Rate | Major Drivers |
| 2021 | 5.2% | Export driven demand for customized billiard tables boosts local production |
| 2022 | 5.1% | Domestic manufacturing investments boost high quality billiard table production |
| 2023 | 5.1% | Local craftsmanship innovations boosted high quality billiard table production |
| 2024 | 4.9% | Export driven investments boost local billiard table production capabilities |
| 2025 | 5.2% | Advanced CNC machining technology boosts precision in billiard table production |
| 2026 | 5.0% | Revived hospitality sector boosts billiard table manufacturing orders |
| 2027 | 4.7% | Advanced manufacturing technologies boost UAE billiard table production efficiency |
| 2028 | 5.1% | Local assembly of billiard tables boosts regional production capabilities |
| 2029 | 5.1% | Export driven demand boosts local billiard table production capabilities |
| 2030 | 5.2% | Domestic billiard table production expanded due to local craftsmanship investments |
| 2031 | 4.8% | New factory construction enhances billiard table production capacity |
| 2032 | 5.1% | Logistics upgrades enhance efficiency in billiard table distribution channels |
Note - Market size estimations and growth projections presented in this report are based on 6Wresearch’s advanced forecasting approach, validated with industry datasets as of June 2026.
United Arab Emirates (UAE) Billiard tables Market Synopsis
Currently, the most significant force shaping the UAE billiard tables market is the expansion of the hospitality and entertainment sectors. Establishments across the UAE are increasingly incorporating billiard tables to enhance guest experiences, making this once niche activity a mainstream entertainment option.
Additionally, the growing trend of leisure activities among the younger population is driving the demand for billiard tables not just in public venues but also within private homes. This shift towards home entertainment has further solidified billiards as a sought-after recreational choice.
United Arab Emirates (UAE) Billiard tables Market Key Takeaways
- The market is witnessing steady growth driven by the rising popularity of billiards as a social activity.
- Increasing investments in hospitality and entertainment sectors are enhancing market dynamics.
- There is a growing demand for billiard tables in private residences and community centers.
- The influx of tourists contributes significantly to the market, promoting billiards as a leisure activity.
- Innovative entertainment concepts incorporating billiards are emerging in the UAE's competitive landscape.
Evaluation of Restraints in United Arab Emirates (UAE) Billiard tables Market
While the UAE billiard tables market is on an upward trajectory, certain restraints could impede further growth. Competition from alternative recreational activities, including bowling, video gaming, and virtual reality experiences, presents a challenge for billiard establishments. They must innovate continually to differentiate themselves and engage customers effectively. Moreover, constraints related to physical space in urban venues may limit the installation of billiard tables, particularly in areas with high population density. This spatial limitation can hinder the ability of establishments to offer comprehensive gaming experiences.
United Arab Emirates (UAE) Billiard tables Market Trends
A significant trend in the UAE billiard tables market is the shift towards technological enhancements, such as smart billiard tables that integrate interactive features. Additionally, themed billiard lounges are gaining popularity, as they provide unique atmospheres that blend social interaction with immersive experiences. This trend is particularly appealing to younger demographics who value both leisure and social connectivity.
United Arab Emirates (UAE) Billiard tables Market Opportunities
The opportunities for growth in the UAE billiard tables market are abundant. Increased investment in recreational facilities and community centers offers a fertile ground for the expansion of billiard tables. Furthermore, with the rise of e-sports and competitive gaming, there lies an untapped potential to incorporate billiards into the broader gaming culture. Partnerships with local tournaments and events can also drive demand and elevate the profile of billiards in the entertainment sector.
Government Initiatives in the United Arab Emirates (UAE) Billiard tables Market
The UAE government has been actively promoting tourism and recreational activities through various initiatives aimed at enhancing the hospitality sector. Public spending on infrastructure, particularly in entertainment and leisure facilities, is expected to create an encouraging environment for the billiard tables market. Furthermore, government support for events and tournaments fosters community engagement and promotes billiards as a competitive sport.
Future Insights of the United Arab Emirates (UAE) Billiard tables Market
Looking ahead to 2026-2032, the UAE billiard tables market is poised for robust growth, driven by continuous developments in the hospitality sector and changing consumer preferences. As more venues integrate billiards into their entertainment offerings, the market is likely to witness a diversification of products catering to different consumer segments. The ongoing evolution of leisure activities will further enhance the appeal of billiards as a recreational choice for both residents and tourists.
United Arab Emirates (UAE) Billiard tables Market Latest Developments (May 2025 - June 2026)
Recently, there has been a notable trend towards integrating billiard tables into upscale leisure venues and entertainment centers, reflecting a growing demand for multifaceted recreational options. Industry players are focusing on the design and functionality of billiard tables, incorporating high-quality materials and innovative technology. Moreover, networking and marketing strategies around billiard tournaments and social leagues have gained momentum, stimulating interest and participation in cue sports throughout the region.
United Arab Emirates (UAE) Billiard tables Market - Key Attractiveness of the Report
- 10 Years of Market Numbers
- Historical Data Starting from 2022 to 2025
- Base Year: 2025
- Forecast Data until 2032
- Key Performance Indicators Impacting the Market
- Major Upcoming Developments and Projects
Key Highlights of the Report:
- United Arab Emirates (UAE) Billiard tables Market Outlook
- Market Size of United Arab Emirates (UAE) Billiard tables Market, 2025
- Forecast of United Arab Emirates (UAE) Billiard tables Market, 2032
- Historical Data and Forecast of United Arab Emirates (UAE) Billiard tables Revenues & Volume for the Period 2022-2032F
- United Arab Emirates (UAE) Billiard tables Market Trend Evolution
- United Arab Emirates (UAE) Billiard tables Market Drivers and Challenges
- United Arab Emirates (UAE) Billiard tables Price Trends
- United Arab Emirates (UAE) Billiard tables Porter's Five Forces
- United Arab Emirates (UAE) Billiard tables Industry Life Cycle
- Historical Data and Forecast of United Arab Emirates (UAE) Billiard tables Market Revenues & Volume By Product Type for the Period 2022-2032F
- Historical Data and Forecast of United Arab Emirates (UAE) Billiard tables Market Revenues & Volume By Snooker Billiards for the Period 2022-2032F
- Historical Data and Forecast of United Arab Emirates (UAE) Billiard tables Market Revenues & Volume By American Pool Table for the Period 2022-2032F
- Historical Data and Forecast of United Arab Emirates (UAE) Billiard tables Market Revenues & Volume By English Pool Tables for the Period 2022-2032F
- Historical Data and Forecast of United Arab Emirates (UAE) Billiard tables Market Revenues & Volume By European Pool Table for the Period 2022-2032F
- Historical Data and Forecast of United Arab Emirates (UAE) Billiard tables Market Revenues & Volume By Application for the Period 2022-2032F
- Historical Data and Forecast of United Arab Emirates (UAE) Billiard tables Market Revenues & Volume By Professional Competition for the Period 2022-2032F
- Historical Data and Forecast of United Arab Emirates (UAE) Billiard tables Market Revenues & Volume By Leisure and Entertainment for the Period 2022-2032F
- United Arab Emirates (UAE) Billiard tables Import Export Trade Statistics
- Market Opportunity Assessment By Product Type
- Market Opportunity Assessment By Application
- United Arab Emirates (UAE) Billiard tables Top Companies Market Share
- United Arab Emirates (UAE) Billiard tables Competitive Benchmarking By Technical and Operational Parameters
- United Arab Emirates (UAE) Billiard tables Company Profiles
- United Arab Emirates (UAE) Billiard tables Key Strategic Recommendations
United Arab Emirates (UAE) Billiard tables Market - Frequently Asked Questions
The market is estimated to grow from USD 193 Million in 2025 to USD 259 Million by 2032, reflecting a CAGR of 4.3% from 2026 to 2032.
The hospitality sector is a major driver, as hotels and entertainment centers increasingly incorporate billiard tables to enhance guest experiences and attract customers.
A notable increase in interest among the younger population, seeking indoor recreational activities, is significantly driving demand for billiard tables.
Yes, establishments face competition from various recreational activities and may experience spatial limitations in densely populated areas, affecting their ability to install billiard tables.
Emerging trends include technological advancements in billiard tables, such as interactive features, and the rise of themed billiard lounges that attract a diverse clientele.
6Wresearch actively monitors the United Arab Emirates (UAE) Billiard tables Market and publishes its comprehensive annual report, highlighting emerging trends, growth drivers, revenue analysis, and forecast outlook. Our insights help businesses to make data-backed strategic decisions with ongoing market dynamics. Our analysts track relevent industries related to the United Arab Emirates (UAE) Billiard tables Market, allowing our clients with actionable intelligence and reliable forecasts tailored to emerging regional needs.
Yes, we provide customisation as per your requirements. To learn more, feel free to contact us on sales@6wresearch.com
1 Executive Summary |
2 Introduction |
2.1 Key Highlights of the Report |
2.2 Report Description |
2.3 Market Scope & Segmentation |
2.4 Research Methodology |
2.5 Assumptions |
3 United Arab Emirates (UAE) Billiard tables Market Overview |
3.1 United Arab Emirates (UAE) Country Macro Economic Indicators |
3.2 United Arab Emirates (UAE) Billiard tables Market Revenues & Volume, 2022 & 2032F |
3.3 United Arab Emirates (UAE) Billiard tables Market - Industry Life Cycle |
3.4 United Arab Emirates (UAE) Billiard tables Market - Porter's Five Forces |
3.5 United Arab Emirates (UAE) Billiard tables Market Revenues & Volume Share, By Product Type, 2022 & 2032F |
3.6 United Arab Emirates (UAE) Billiard tables Market Revenues & Volume Share, By Application, 2022 & 2032F |
4 United Arab Emirates (UAE) Billiard tables Market Dynamics |
4.1 Impact Analysis |
4.2 Market Drivers |
4.2.1 Growing popularity of billiards and pool as recreational activities in the UAE |
4.2.2 Increase in disposable income and leisure spending among UAE residents |
4.2.3 Rising number of entertainment venues, hotels, and clubs offering billiard tables |
4.3 Market Restraints |
4.3.1 High cost associated with purchasing and maintaining billiard tables |
4.3.2 Limited space in residential properties for setting up billiard tables |
4.3.3 Competition from other recreational activities and gaming options |
5 United Arab Emirates (UAE) Billiard tables Market Trends |
6 United Arab Emirates (UAE) Billiard tables Market, By Types |
6.1 United Arab Emirates (UAE) Billiard tables Market, By Product Type |
6.1.1 Overview and Analysis |
6.1.2 United Arab Emirates (UAE) Billiard tables Market Revenues & Volume, By Product Type, 2022-2032F |
6.1.3 United Arab Emirates (UAE) Billiard tables Market Revenues & Volume, By Snooker Billiards, 2022-2032F |
6.1.4 United Arab Emirates (UAE) Billiard tables Market Revenues & Volume, By American Pool Table, 2022-2032F |
6.1.5 United Arab Emirates (UAE) Billiard tables Market Revenues & Volume, By English Pool Tables, 2022-2032F |
6.1.6 United Arab Emirates (UAE) Billiard tables Market Revenues & Volume, By European Pool Table, 2022-2032F |
6.2 United Arab Emirates (UAE) Billiard tables Market, By Application |
6.2.1 Overview and Analysis |
6.2.2 United Arab Emirates (UAE) Billiard tables Market Revenues & Volume, By Professional Competition, 2022-2032F |
6.2.3 United Arab Emirates (UAE) Billiard tables Market Revenues & Volume, By Leisure and Entertainment, 2022-2032F |
7 United Arab Emirates (UAE) Billiard tables Market Import-Export Trade Statistics |
7.1 United Arab Emirates (UAE) Billiard tables Market Export to Major Countries |
7.2 United Arab Emirates (UAE) Billiard tables Market Imports from Major Countries |
8 United Arab Emirates (UAE) Billiard tables Market Key Performance Indicators |
8.1 Number of billiard table installations in entertainment venues and clubs |
8.2 Frequency of billiard tournaments and events in the UAE |
8.3 Percentage of households with a billiard table for recreational purposes |
9 United Arab Emirates (UAE) Billiard tables Market - Opportunity Assessment |
9.1 United Arab Emirates (UAE) Billiard tables Market Opportunity Assessment, By Product Type, 2022 & 2032F |
9.2 United Arab Emirates (UAE) Billiard tables Market Opportunity Assessment, By Application, 2022 & 2032F |
10 United Arab Emirates (UAE) Billiard tables Market - Competitive Landscape |
10.1 United Arab Emirates (UAE) Billiard tables Market Revenue Share, By Companies, 2025 |
10.2 United Arab Emirates (UAE) Billiard tables Market Competitive Benchmarking, By Operating and Technical Parameters |
11 Company Profiles |
12 Recommendations |
13 Disclaimer |
Global Go To Market Strategy - 2030
Export potential enables firms to identify high-growth global markets with greater confidence by combining advanced trade intelligence with a structured quantitative methodology. The framework analyzes emerging demand trends and country-level import patterns while integrating macroeconomic and trade datasets such as GDP and population forecasts, bilateral import–export flows, tariff structures, elasticity differentials between developed and developing economies, geographic distance, and import demand projections. Using weighted trade values from 2020–2024 as the base period to project country-to-country export potential for 2030, these inputs are operationalized through calculated drivers such as gravity model parameters, tariff impact factors, and projected GDP per-capita growth. Through an analysis of hidden potentials, demand hotspots, and market conditions that are most favorable to success, this method enables firms to focus on target countries, maximize returns, and global expansion with data, backed by accuracy.
By factoring in the projected importer demand gap that is currently unmet and could be potential opportunity, it identifies the potential for the Exporter (Country) among 190 countries, against the general trade analysis, which identifies the biggest importer or exporter.
To discover high-growth global markets and optimize your business strategy:
Click Here
Pricing
- Single User License$ 1,995
- Department License$ 2,400
- Site License$ 3,120
- Global License$ 3,795

Leadership Perspectives from Industry Events
Search
Thought Leadership and Analyst Meet


Our Clients
6WResearch In News
- India Air Conditioner Market Set for Strong Rebound in 2026 After Weather-Led Correction and GST-Driven Recovery: 6Wresearch
- ADAS in India: How Automatic Emergency Braking, Blind Spot Detection & Driver Monitoring are Transforming Road Safety
- Doha a strategic location for EV manufacturing hub: IPA Qatar
- Demand for luxury TVs surging in the GCC, says Samsung
- Empowering Growth: The Thriving Journey of Bangladesh’s Cable Industry
- Demand for luxury TVs surging in the GCC, says Samsung
Latest Reports
- Nicaragua RPG Gaming Market (2026-2032)
- New Zealand RPG Gaming Market (2026-2032)
- Netherlands RPG Gaming Market (2026-2032)
- Nauru RPG Gaming Market (2026-2032)
- Namibia RPG Gaming Market (2026-2032)
- Mozambique RPG Gaming Market (2026-2032)
- Montenegro RPG Gaming Market (2026-2032)
- Mongolia RPG Gaming Market (2026-2032)
- Monaco RPG Gaming Market (2026-2032)
- Micronesia RPG Gaming Market (2026-2032)
Industry Events and Analyst Meet

EV India Expo 2026

HIMTEX 2026

India Refining Summit 2026

India EV Show 2026

EV tech India Expo 2026
Whitepaper
- Middle East & Africa Commercial Security Market Click here to view more.
- Middle East & Africa Fire Safety Systems & Equipment Market Click here to view more.
- GCC Drone Market Click here to view more.
- Middle East Lighting Fixture Market Click here to view more.
- GCC Physical & Perimeter Security Market Click here to view more.