United Arab Emirates (UAE) Electronic Navigational Charts Market (2026-2032) Outlook | Revenue, Trends, Forecast, Value, Share, Companies, Growth, Size, Industry & Analysis
Market Forecast By Component (Hardware, Software, Services), By Application (Aviation, Marine, Others) And Competitive Landscape
| Product Code: ETC211612 | Publication Date: May 2022 | Updated Date: Jul 2026 | Product Type: Market Research Report | |
| Publisher: 6Wresearch | Author: Ravi Bhandari | No. of Pages: 60 | No. of Figures: 40 | No. of Tables: 7 |
United Arab Emirates (UAE) Electronic Navigational Charts Market Size, Share & Growth Rate
The United Arab Emirates (UAE) Electronic Navigational Charts Market was estimated at USD 298 Million in 2025 and is projected to reach USD 414 Million by 2032, growing at a CAGR of 4.8% from 2026 to 2032. This upward trajectory is propelled by the UAE's status as a global maritime hub, where an increase in shipping activities necessitates advanced navigation solutions. Furthermore, the push for enhanced safety measures and adherence to international regulations adds to the demand for reliable electronic navigational charts in the region.
United Arab Emirates (UAE) Electronic Navigational Charts Market Year-wise Growth Rate and Key Drivers
This graph highlights how the United Arab Emirates (UAE) Electronic Navigational Charts Market has steadily grown over the years, supported by major growth factors.
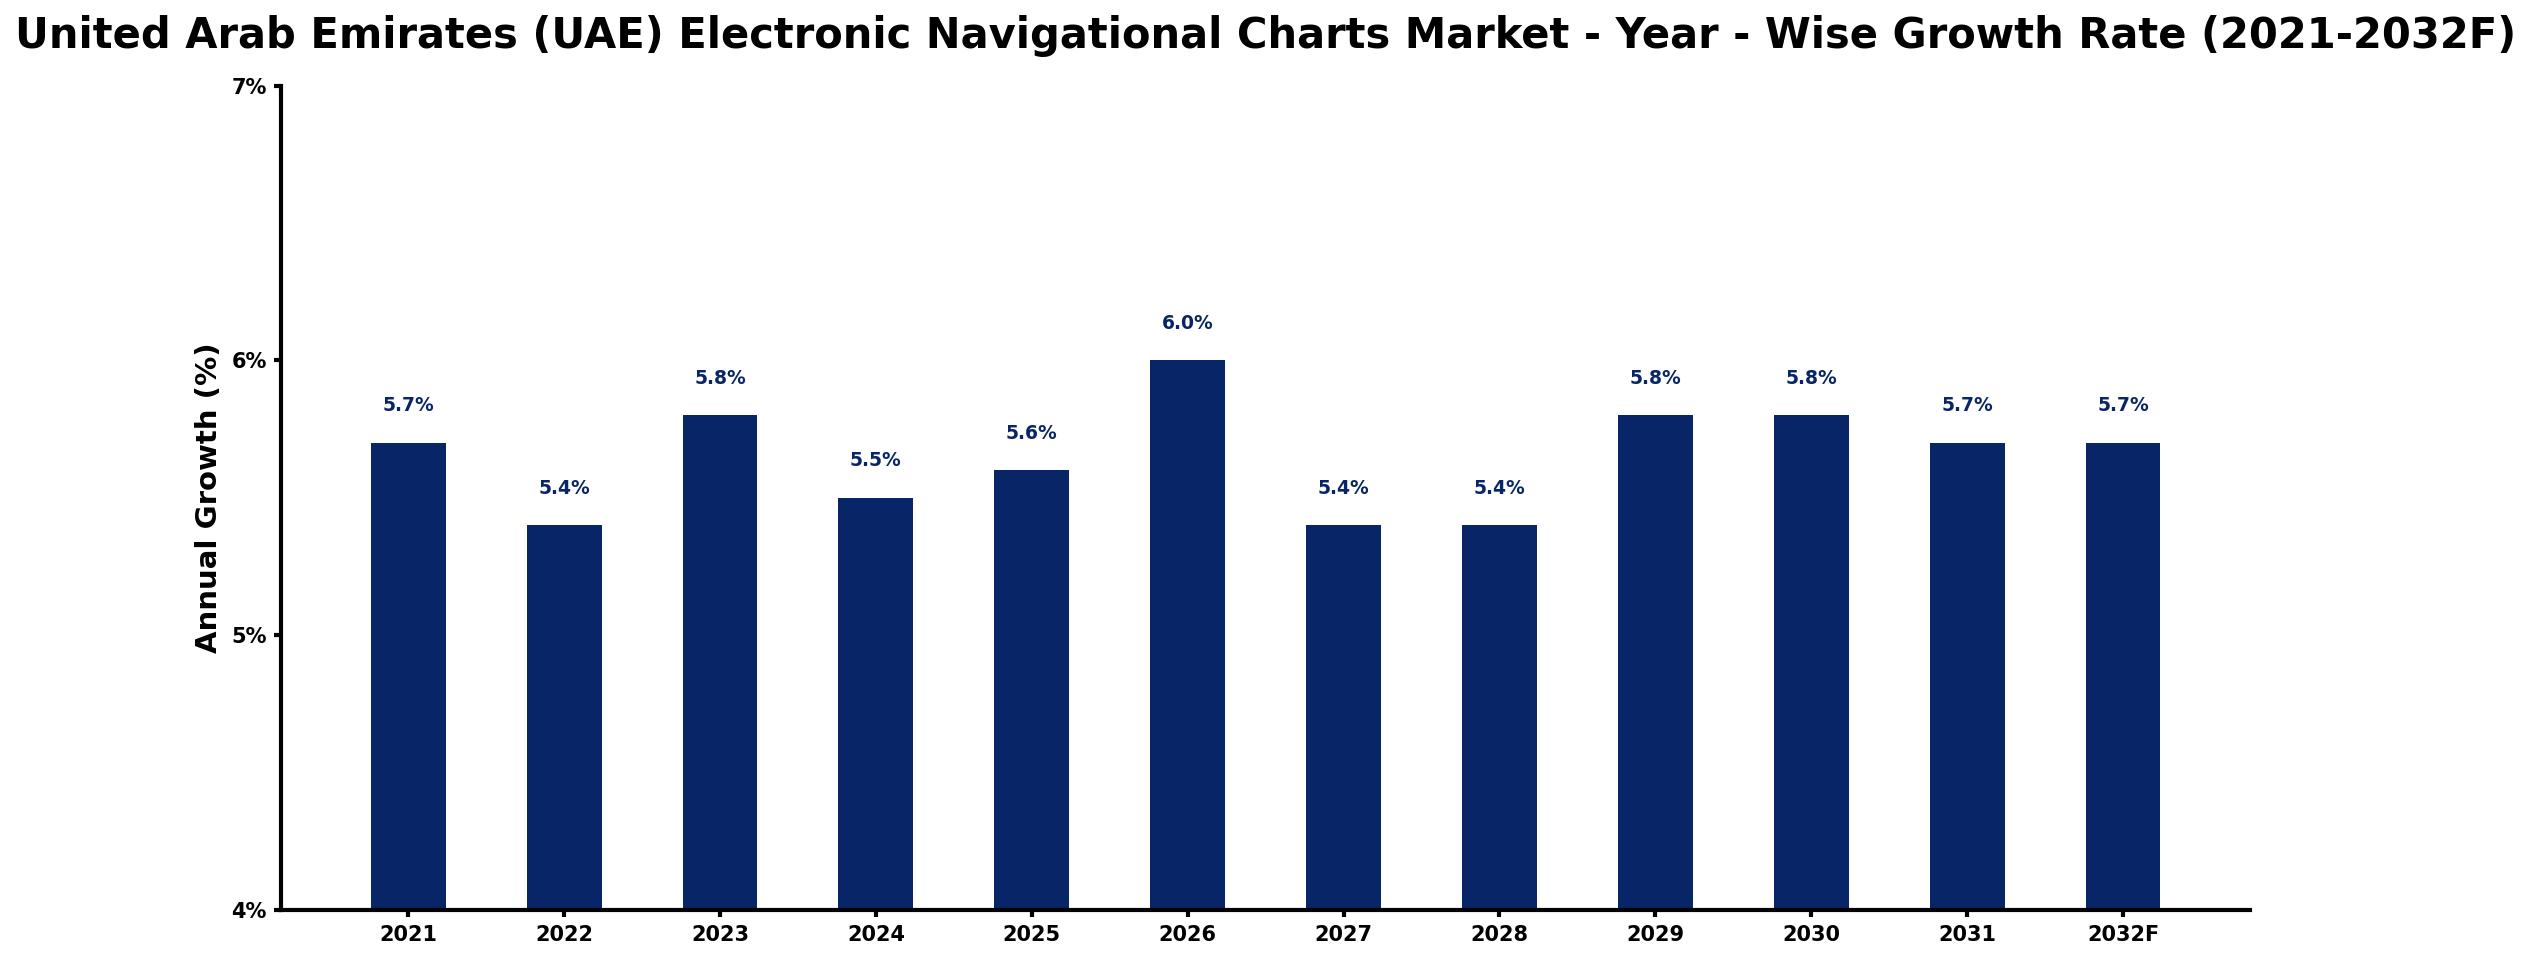
The table below presents the year‑wise growth rates along with the key drivers influencing the market
| Year | Growth Rate | Major Drivers |
| 2021 | 5.7% | Increased maritime safety regulations |
| 2022 | 5.4% | Expansion of shipping logistics operations |
| 2023 | 5.8% | Growth in recreational boating activities |
| 2024 | 5.5% | Rise in offshore oil exploration |
| 2025 | 5.6% | Investment in smart port technologies |
| 2026 | 6.0% | Advancements in marine data analytics |
| 2027 | 5.4% | stronger distribution network expansion |
| 2028 | 5.4% | Emergence of autonomous vessel technologies |
| 2029 | 5.8% | Development of marine environmental policies |
| 2030 | 5.8% | Integrating AI in maritime operations |
| 2031 | 5.7% | Collaboration among maritime stakeholders |
| 2032 | 5.7% | Increased focus on sustainable shipping |
Note: Market size estimations and growth projections presented in this report are based on 6Wresearch's proprietary forecasting methodology, utilizing the latest available industry data, government publications, and primary research inputs.
United Arab Emirates (UAE) Electronic Navigational Charts Market Synopsis
The adoption of Electronic Navigational Charts (ENCs) in the UAE reflects a broader trend towards digital transformation in maritime operations. These charts provide essential navigation data, enabling vessels to navigate the densely trafficked waters with increased safety and efficiency. The expansion of both commercial and recreational boating activities further drives the demand for these crucial navigational tools.
As the UAE government invests heavily in port infrastructure and maritime technology, the necessity for up-to-date and accurate electronic charts becomes even more apparent. The potential for integrating advanced technologies, such as artificial intelligence and machine learning, into ENCs signifies a promising avenue for enhancing navigational reliability and user experience.
United Arab Emirates (UAE) Electronic Navigational Charts Market Key Takeaways
- Robust growth driven by increasing maritime trade and technological advancements.
- Integration of digital navigation solutions is enhancing maritime safety and operational efficiency.
- The market's expansion is supported by compliance with international navigation standards.
- Investment in R&D is crucial for keeping pace with technological evolution.
- Ongoing developments are set to position the UAE as a leader in maritime navigation technologies.
Evaluation of Restraints in United Arab Emirates (UAE) Electronic Navigational Charts Market
While the UAE Electronic Navigational Charts market is on a promising growth path, it faces notable constraints. The rapid pace of technological advancements creates a challenge for companies striving to keep their offerings current and relevant. Additionally, ensuring the accuracy and reliability of navigational data requires rigorous quality control, which can be resource-intensive. Firms must navigate these issues effectively to maintain competitive advantages in a swiftly evolving landscape.
United Arab Emirates (UAE) Electronic Navigational Charts Market Trends
The trend towards digitization in the maritime sector is unmistakable. ENCs are increasingly being integrated with advanced technologies such as automated data updates and real-time navigation aids. Moreover, the rise in demand for environmentally sustainable navigation practices is prompting innovations aimed at optimizing routing and minimizing emissions. The adoption of cloud computing solutions is also enhancing the accessibility and functionality of electronic charts for operators.
United Arab Emirates (UAE) Electronic Navigational Charts Market Opportunities
The UAE's ongoing investment in maritime infrastructure and technology presents substantial opportunities for stakeholders in the ENCs market. Collaborations with tech firms to leverage innovations can enhance the accuracy and usability of navigational solutions. Additionally, as global shipping regulations continue to tighten, the need for compliant, up-to-date electronic charts will create new avenues for growth. Diversifying product offerings to include customizable navigation solutions can also capture a broader audience.
Government Initiatives in the United Arab Emirates (UAE) Electronic Navigational Charts Market
The UAE government has implemented various initiatives to enhance maritime safety and efficiency. There are ongoing programs aimed at modernizing port facilities and investing in advanced navigation technologies. By promoting compliance with international maritime standards, these policies are creating an environment that fosters the growth of electronic navigational chart solutions, encouraging both local and international investments in the sector.
Future Insights of the United Arab Emirates (UAE) Electronic Navigational Charts Market
Looking ahead to 2026-2032, the UAE Electronic Navigational Charts market is poised for significant advancements. A focus on enhanced integration of AI and big data analytics will likely transform navigation methodologies, allowing for unprecedented accuracy and efficiency. The evolution of user-centric digital platforms will also facilitate better engagement for ship operators, ultimately leading to safer and more efficient maritime operations. As the UAE continues to solidify its maritime leadership, the demand for sophisticated navigational solutions is set to grow.
United Arab Emirates (UAE) Electronic Navigational Charts Market Latest Developments (2025 - 2026)
In the recent months leading up to mid-2026, there has been a noteworthy emphasis on the integration of artificial intelligence into electronic navigational charts, aimed at improving predictive navigation capabilities. Additionally, collaboration between public and private sectors is facilitating the development of more comprehensive and user-friendly charting solutions. The drive toward implementing real-time data updates is also gaining momentum, with several initiatives launched to modernize existing navigation infrastructures.
United Arab Emirates (UAE) Electronic Navigational Charts Market - Key Attractiveness of the Report
- 10 Years of Market Numbers
- Historical Data Starting from 2022 to 2025
- Base Year: 2025
- Forecast Data until 2032
- Key Performance Indicators Impacting the Market
- Major Upcoming Developments and Projects
Key Highlights of the Report:
- United Arab Emirates (UAE) Electronic Navigational Charts Market Outlook
- Market Size of United Arab Emirates (UAE) Electronic Navigational Charts Market, 2025
- Forecast of United Arab Emirates (UAE) Electronic Navigational Charts Market, 2032
- Historical Data and Forecast of United Arab Emirates (UAE) Electronic Navigational Charts Revenues & Volume for the Period 2022-2032F
- United Arab Emirates (UAE) Electronic Navigational Charts Market Trend Evolution
- United Arab Emirates (UAE) Electronic Navigational Charts Market Drivers and Challenges
- United Arab Emirates (UAE) Electronic Navigational Charts Price Trends
- United Arab Emirates (UAE) Electronic Navigational Charts Porter's Five Forces
- United Arab Emirates (UAE) Electronic Navigational Charts Industry Life Cycle
- Historical Data and Forecast of United Arab Emirates (UAE) Electronic Navigational Charts Market Revenues & Volume By Component for the Period 2022-2032F
- Historical Data and Forecast of United Arab Emirates (UAE) Electronic Navigational Charts Market Revenues & Volume By Hardware for the Period 2022-2032F
- Historical Data and Forecast of United Arab Emirates (UAE) Electronic Navigational Charts Market Revenues & Volume By Software for the Period 2022-2032F
- Historical Data and Forecast of United Arab Emirates (UAE) Electronic Navigational Charts Market Revenues & Volume By Services for the Period 2022-2032F
- Historical Data and Forecast of United Arab Emirates (UAE) Electronic Navigational Charts Market Revenues & Volume By Application for the Period 2022-2032F
- Historical Data and Forecast of United Arab Emirates (UAE) Electronic Navigational Charts Market Revenues & Volume By Aviation for the Period 2022-2032F
- Historical Data and Forecast of United Arab Emirates (UAE) Electronic Navigational Charts Market Revenues & Volume By Marine for the Period 2022-2032F
- Historical Data and Forecast of United Arab Emirates (UAE) Electronic Navigational Charts Market Revenues & Volume By Others for the Period 2022-2032F
- United Arab Emirates (UAE) Electronic Navigational Charts Import Export Trade Statistics
- Market Opportunity Assessment By Component
- Market Opportunity Assessment By Application
- United Arab Emirates (UAE) Electronic Navigational Charts Top Companies Market Share
- United Arab Emirates (UAE) Electronic Navigational Charts Competitive Benchmarking By Technical and Operational Parameters
- United Arab Emirates (UAE) Electronic Navigational Charts Company Profiles
- United Arab Emirates (UAE) Electronic Navigational Charts Key Strategic Recommendations
Frequently Asked Questions About the Market Study (FAQs):
The market is primarily driven by increased maritime trade, stringent international regulations, and the need for enhanced navigational safety. The ongoing investment in port infrastructures further bolsters this growth.
The market was estimated at USD 298 Million in 2025, with projections indicating it will reach USD 414 Million by 2032, growing at a CAGR of 4.8% between 2026 and 2032.
Advances in AI, cloud computing, and real-time data integration are transforming how electronic charts are developed and utilized, enhancing both accuracy and user experience.
The government is actively investing in modernizing maritime infrastructure and encouraging compliance with international navigation standards, thus creating a favorable market environment.
The market is witnessing a trend towards digital integration, with a focus on sustainable navigation practices and the introduction of customizable chart solutions to meet specific user needs.
6Wresearch actively monitors the United Arab Emirates (UAE) Electronic Navigational Charts Market and publishes its comprehensive annual report, highlighting emerging trends, growth drivers, revenue analysis, and forecast outlook. Our insights help businesses to make data-backed strategic decisions with ongoing market dynamics. Our analysts track relevent industries related to the United Arab Emirates (UAE) Electronic Navigational Charts Market, allowing our clients with actionable intelligence and reliable forecasts tailored to emerging regional needs.
Yes, we provide customisation as per your requirements. To learn more, feel free to contact us on sales@6wresearch.com
1 Executive Summary |
2 Introduction |
2.1 Key Highlights of the Report |
2.2 Report Description |
2.3 Market Scope & Segmentation |
2.4 Research Methodology |
2.5 Assumptions |
3 United Arab Emirates (UAE) Electronic Navigational Charts Market Overview |
3.1 United Arab Emirates (UAE) Country Macro Economic Indicators |
3.2 United Arab Emirates (UAE) Electronic Navigational Charts Market Revenues & Volume, 2022 & 2032F |
3.3 United Arab Emirates (UAE) Electronic Navigational Charts Market - Industry Life Cycle |
3.4 United Arab Emirates (UAE) Electronic Navigational Charts Market - Porter's Five Forces |
3.5 United Arab Emirates (UAE) Electronic Navigational Charts Market Revenues & Volume Share, By Component, 2022 & 2032F |
3.6 United Arab Emirates (UAE) Electronic Navigational Charts Market Revenues & Volume Share, By Application, 2022 & 2032F |
4 United Arab Emirates (UAE) Electronic Navigational Charts Market Dynamics |
4.1 Impact Analysis |
4.2 Market Drivers |
4.2.1 Increasing maritime activities and trade in the UAE |
4.2.2 Government initiatives to enhance maritime safety and security |
4.2.3 Technological advancements in electronic navigational charts (ENCs) |
4.3 Market Restraints |
4.3.1 High initial setup costs for implementing electronic navigational charts |
4.3.2 Lack of awareness and training among maritime professionals |
4.3.3 Regulatory challenges and compliance issues |
5 United Arab Emirates (UAE) Electronic Navigational Charts Market Trends |
6 United Arab Emirates (UAE) Electronic Navigational Charts Market, By Types |
6.1 United Arab Emirates (UAE) Electronic Navigational Charts Market, By Component |
6.1.1 Overview and Analysis |
6.1.2 United Arab Emirates (UAE) Electronic Navigational Charts Market Revenues & Volume, By Component, 2022-2032F |
6.1.3 United Arab Emirates (UAE) Electronic Navigational Charts Market Revenues & Volume, By Hardware, 2022-2032F |
6.1.4 United Arab Emirates (UAE) Electronic Navigational Charts Market Revenues & Volume, By Software, 2022-2032F |
6.1.5 United Arab Emirates (UAE) Electronic Navigational Charts Market Revenues & Volume, By Services, 2022-2032F |
6.2 United Arab Emirates (UAE) Electronic Navigational Charts Market, By Application |
6.2.1 Overview and Analysis |
6.2.2 United Arab Emirates (UAE) Electronic Navigational Charts Market Revenues & Volume, By Aviation, 2022-2032F |
6.2.3 United Arab Emirates (UAE) Electronic Navigational Charts Market Revenues & Volume, By Marine, 2022-2032F |
6.2.4 United Arab Emirates (UAE) Electronic Navigational Charts Market Revenues & Volume, By Others, 2022-2032F |
7 United Arab Emirates (UAE) Electronic Navigational Charts Market Import-Export Trade Statistics |
7.1 United Arab Emirates (UAE) Electronic Navigational Charts Market Export to Major Countries |
7.2 United Arab Emirates (UAE) Electronic Navigational Charts Market Imports from Major Countries |
8 United Arab Emirates (UAE) Electronic Navigational Charts Market Key Performance Indicators |
8.1 Adoption rate of electronic navigational charts among UAE maritime stakeholders |
8.2 Rate of incidents or accidents in UAE waters before and after implementing ENCs |
8.3 Satisfaction level of maritime users with the accuracy and reliability of electronic navigational charts |
9 United Arab Emirates (UAE) Electronic Navigational Charts Market - Opportunity Assessment |
9.1 United Arab Emirates (UAE) Electronic Navigational Charts Market Opportunity Assessment, By Component, 2022 & 2032F |
9.2 United Arab Emirates (UAE) Electronic Navigational Charts Market Opportunity Assessment, By Application, 2022 & 2032F |
10 United Arab Emirates (UAE) Electronic Navigational Charts Market - Competitive Landscape |
10.1 United Arab Emirates (UAE) Electronic Navigational Charts Market Revenue Share, By Companies, 2025 |
10.2 United Arab Emirates (UAE) Electronic Navigational Charts Market Competitive Benchmarking, By Operating and Technical Parameters |
11 Company Profiles |
12 Recommendations |
13 Disclaimer |
Global Go To Market Strategy - 2030
Export potential enables firms to identify high-growth global markets with greater confidence by combining advanced trade intelligence with a structured quantitative methodology. The framework analyzes emerging demand trends and country-level import patterns while integrating macroeconomic and trade datasets such as GDP and population forecasts, bilateral import–export flows, tariff structures, elasticity differentials between developed and developing economies, geographic distance, and import demand projections. Using weighted trade values from 2020–2024 as the base period to project country-to-country export potential for 2030, these inputs are operationalized through calculated drivers such as gravity model parameters, tariff impact factors, and projected GDP per-capita growth. Through an analysis of hidden potentials, demand hotspots, and market conditions that are most favorable to success, this method enables firms to focus on target countries, maximize returns, and global expansion with data, backed by accuracy.
By factoring in the projected importer demand gap that is currently unmet and could be potential opportunity, it identifies the potential for the Exporter (Country) among 190 countries, against the general trade analysis, which identifies the biggest importer or exporter.
To discover high-growth global markets and optimize your business strategy:
Click Here
Pricing
- Single User License$ 1,995
- Department License$ 2,400
- Site License$ 3,120
- Global License$ 3,795

Leadership Perspectives from Industry Events
Search
Thought Leadership and Analyst Meet


Our Clients
6WResearch In News
- India Air Conditioner Market Set for Strong Rebound in 2026 After Weather-Led Correction and GST-Driven Recovery: 6Wresearch
- ADAS in India: How Automatic Emergency Braking, Blind Spot Detection & Driver Monitoring are Transforming Road Safety
- Doha a strategic location for EV manufacturing hub: IPA Qatar
- Demand for luxury TVs surging in the GCC, says Samsung
- Empowering Growth: The Thriving Journey of Bangladesh’s Cable Industry
- Demand for luxury TVs surging in the GCC, says Samsung
Latest Reports
- Nicaragua RPG Gaming Market (2026-2032)
- New Zealand RPG Gaming Market (2026-2032)
- Netherlands RPG Gaming Market (2026-2032)
- Nauru RPG Gaming Market (2026-2032)
- Namibia RPG Gaming Market (2026-2032)
- Mozambique RPG Gaming Market (2026-2032)
- Montenegro RPG Gaming Market (2026-2032)
- Mongolia RPG Gaming Market (2026-2032)
- Monaco RPG Gaming Market (2026-2032)
- Micronesia RPG Gaming Market (2026-2032)
Industry Events and Analyst Meet

EV India Expo 2026

HIMTEX 2026

India Refining Summit 2026

India EV Show 2026

EV tech India Expo 2026
Whitepaper
- Middle East & Africa Commercial Security Market Click here to view more.
- Middle East & Africa Fire Safety Systems & Equipment Market Click here to view more.
- GCC Drone Market Click here to view more.
- Middle East Lighting Fixture Market Click here to view more.
- GCC Physical & Perimeter Security Market Click here to view more.