United Kingdom Cast & Forged Market (2026-2032) | Growth, Analysis, Revenue, Forecast, Share, Outlook, Trends, Value, Companies, COVID-19 IMPACT, Size & Industry
Market Forecast By Product Types (Light Alloys, Copper Alloys, Iron Casting, Steel Casting, Miscellaneous), By Activity Types (Closed Die Forging, Open Die Forging, Rolled Ring Forging, Cold Forging, Non-ferrous Closed Die Forging), By Applications (Automotive, Aerospace, Oil & Gas, Construction, Agriculture, Industrial, Others) And Competitive Landscape
| Product Code: ETC004224 | Publication Date: Sep 2020 | Updated Date: Jun 2026 | Product Type: Report | |
| Publisher: 6Wresearch | Author: Ravi Bhandari | No. of Pages: 70 | No. of Figures: 35 | No. of Tables: 5 |
United Kingdom Cast & Forged Market Summary
The united kingdom cast & forged market was estimated at USD 297 Million in 2025 and is projected to reach USD 407 Million by 2032, growing at a CAGR of 5.3% from 2026 to 2032.
United Kingdom Cast & Forged Market Year-wise Growth Rate and Key Drivers
This graph highlights how the United Kingdom Cast & Forged Market has steadily grown over the past five years, supported by major growth factors.
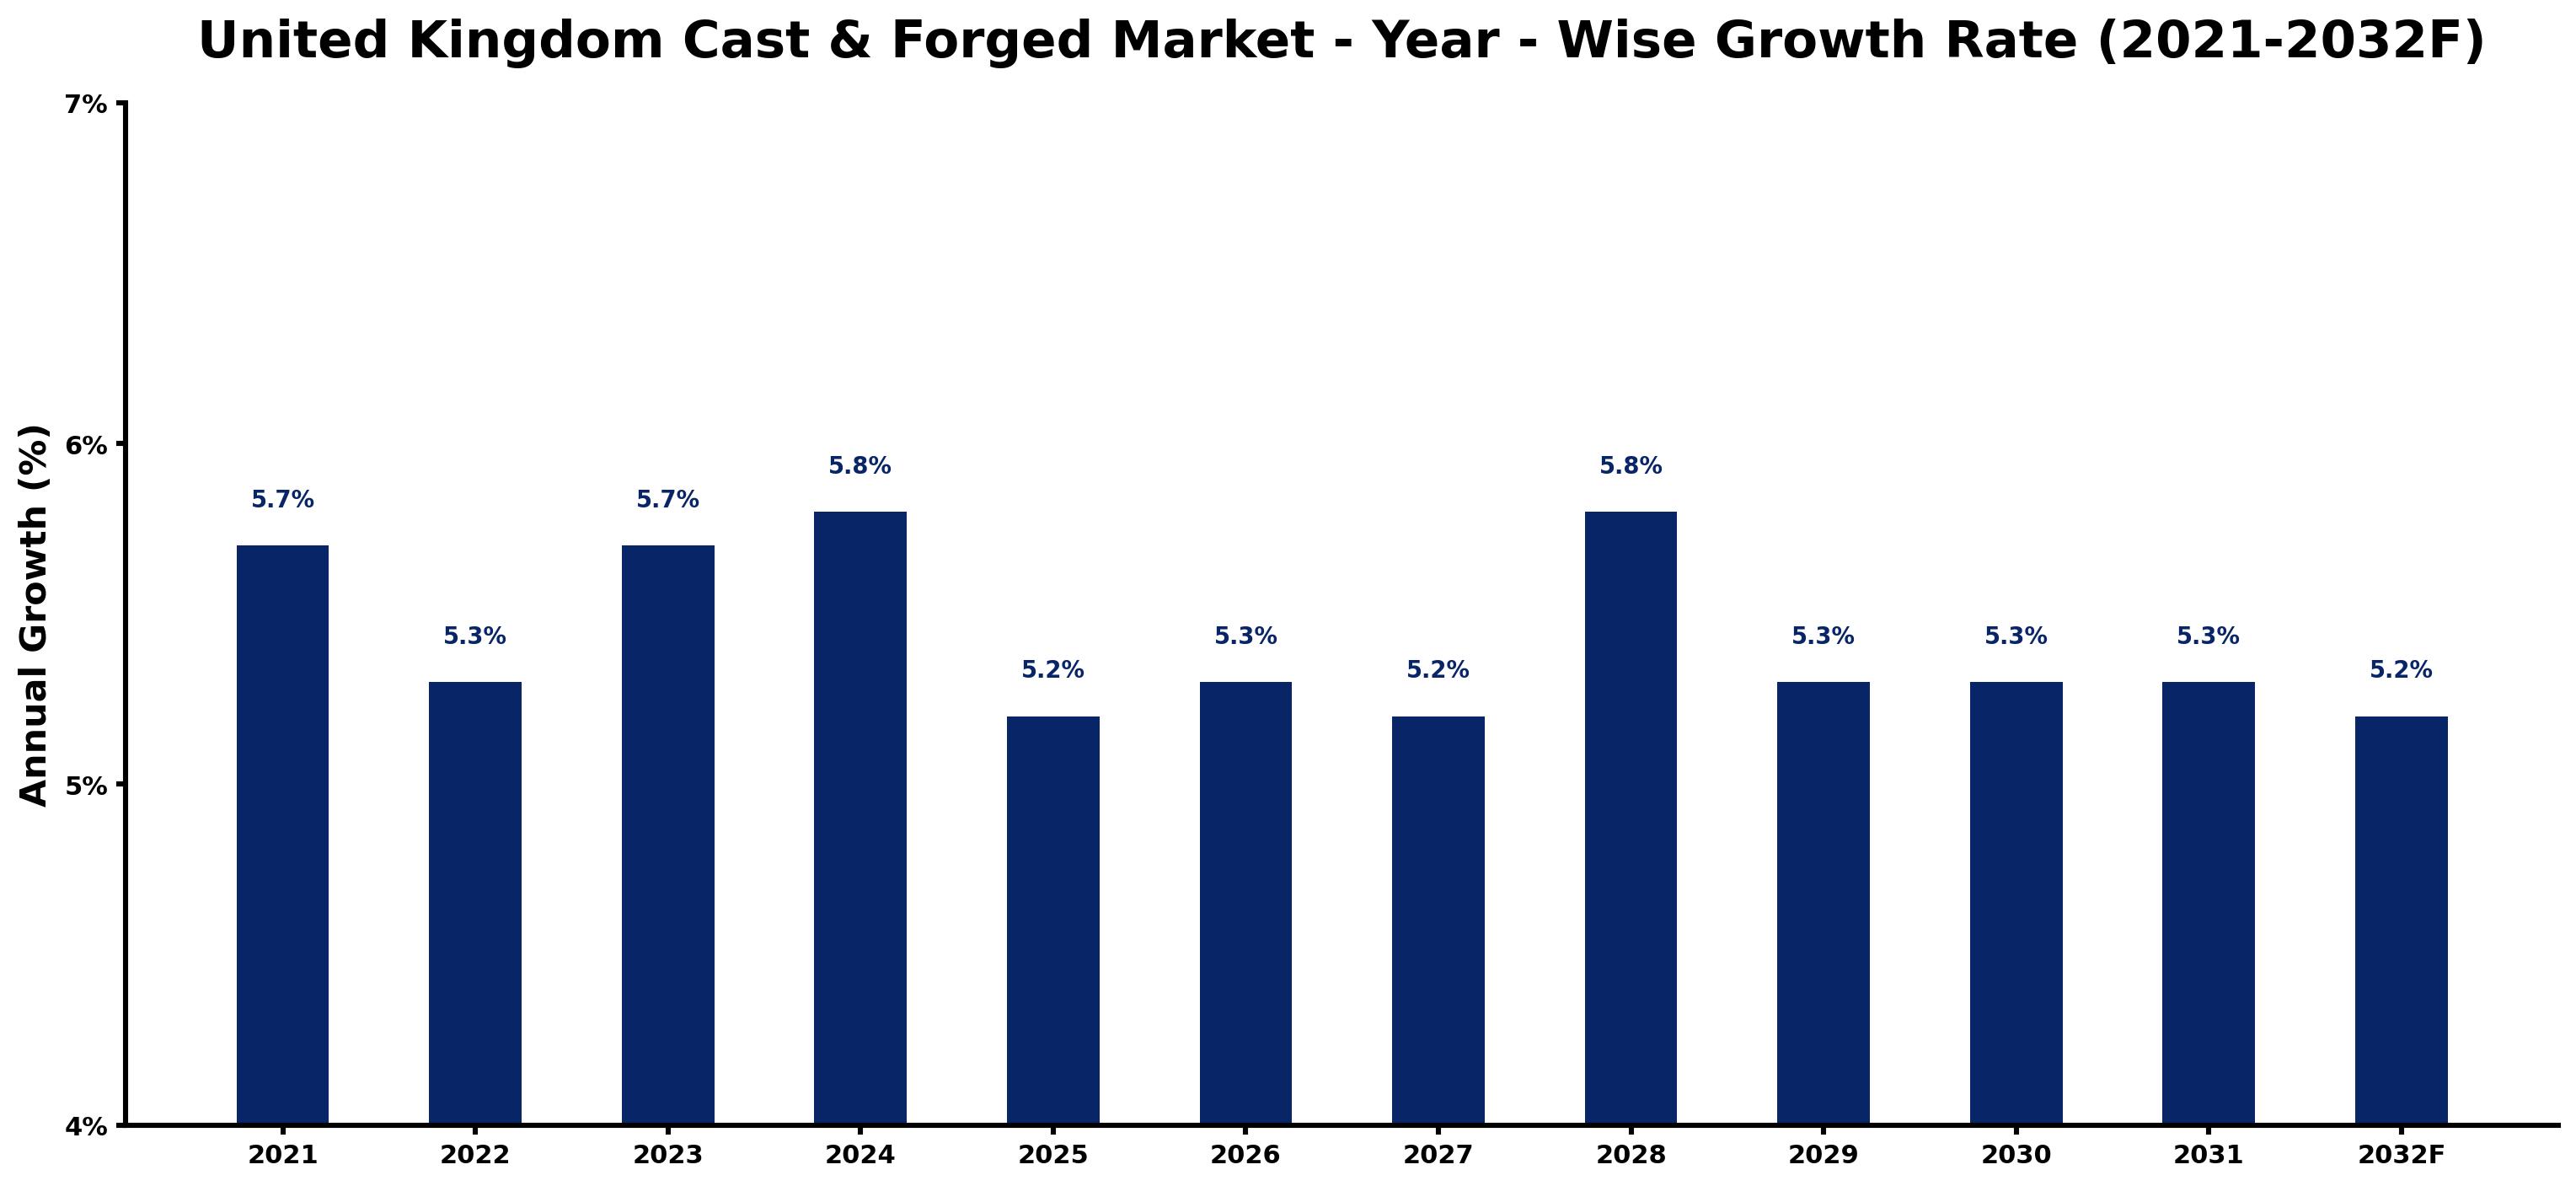
The table below presents the year wise growth rates along with the key drivers influencing the market
| Year | Growth Rate | Major Drivers |
| 2021 | 5.7% | Post-lockdown retail projects pushed demand for resilient cast and forged products. |
| 2022 | 5.3% | Infrastructure upgrades highlighted the importance of durability in construction materials. |
| 2023 | 5.7% | Sustainable manufacturing practices emerged, influencing industry players toward greener solutions. |
| 2024 | 5.8% | Rising automotive manufacturing in the UK increased the need for high-performance components. |
| 2025 | 5.2% | Innovations in alloy production revealed enhanced properties for specific applications in aerospace. |
| 2026 | 5.3% | Local sourcing initiatives gained traction, benefiting domestic cast and forged suppliers significantly. |
| 2027 | 5.2% | Urban development projects in major cities created opportunities for heavy-duty equipment needs. |
| 2028 | 5.8% | Technological advancements in forging processes drove efficiency and reduced waste across operations. |
| 2029 | 5.3% | Investment in renewable energy infrastructure generated a surge in demand for robust materials. |
| 2030 | 5.3% | Supply chain shifts towards nearshoring improved reliability for UK-based metal production. |
| 2031 | 5.3% | Environmental regulations prompted manufacturers to emphasize eco-friendly production methods. |
| 2032 | 5.2% | Collaborations between industries facilitated innovation, enhancing the market's competitive edge. |
Note - Market size estimations and growth projections presented in this report are based on 6Wresearch's advanced forecasting approach, validated with industry datasets as of June 2026.
Key Highlights of the Report:
- United Kingdom Cast & Forged Market Overview
- United Kingdom Cast & Forged Market Outlook
- Market Size of United Kingdom Cast & Forged Market, 2025
- Forecast of United Kingdom Cast & Forged Market, 2032F
- Historical Data and Forecast of United Kingdom Cast & Forged Revenues & Volume for the Period 2022-2032F
- United Kingdom Cast & Forged Market Trend Evolution
- United Kingdom Cast & Forged Market Drivers and Challenges
- United Kingdom Cast & Forged Price Trends
- United Kingdom Cast & Forged Porter’s Five Forces
- United Kingdom Cast & Forged Industry Life Cycle
- Historical Data and Forecast of United Kingdom Cast & Forged Market Revenues & Volume By Product Types for the Period 2022-2032F
- Historical Data and Forecast of United Kingdom Cast & Forged Market Revenues & Volume By Light Alloys for the Period 2022-2032F
- Historical Data and Forecast of United Kingdom Cast & Forged Market Revenues & Volume By Copper Alloys for the Period 2022-2032F
- Historical Data and Forecast of United Kingdom Cast & Forged Market Revenues & Volume By Iron Casting for the Period 2022-2032F
- Historical Data and Forecast of United Kingdom Cast & Forged Market Revenues & Volume By Steel Casting for the Period 2022-2032F
- Historical Data and Forecast of United Kingdom Cast & Forged Market Revenues & Volume By Miscellaneous for the Period 2022-2032F
- Historical Data and Forecast of United Kingdom Cast & Forged Market Revenues & Volume By Activity Types for the Period 2022-2032F
- Historical Data and Forecast of United Kingdom Cast & Forged Market Revenues & Volume By Closed Die Forging for the Period 2022-2032F
- Historical Data and Forecast of United Kingdom Cast & Forged Market Revenues & Volume By Open Die Forging for the Period 2022-2032F
- Historical Data and Forecast of United Kingdom Cast & Forged Market Revenues & Volume By Rolled Ring Forging for the Period 2022-2032F
- Historical Data and Forecast of United Kingdom Cast & Forged Market Revenues & Volume By Cold Forging for the Period 2022-2032F
- Historical Data and Forecast of United Kingdom Cast & Forged Market Revenues & Volume By Non-ferrous Closed Die Forging for the Period 2022-2032F
- Historical Data and Forecast of United Kingdom Cast & Forged Market Revenues & Volume By Applications for the Period 2022-2032F
- Historical Data and Forecast of United Kingdom Cast & Forged Market Revenues & Volume By Automotive for the Period 2022-2032F
- Historical Data and Forecast of United Kingdom Cast & Forged Market Revenues & Volume By Aerospace for the Period 2022-2032F
- Historical Data and Forecast of United Kingdom Cast & Forged Market Revenues & Volume By Oil & Gas for the Period 2022-2032F
- Historical Data and Forecast of United Kingdom Cast & Forged Market Revenues & Volume By Construction for the Period 2022-2032F
- Historical Data and Forecast of United Kingdom Cast & Forged Market Revenues & Volume By Agriculture for the Period 2022-2032F
- Historical Data and Forecast of United Kingdom Cast & Forged Market Revenues & Volume By Industrial for the Period 2022-2032F
- Historical Data and Forecast of United Kingdom Cast & Forged Market Revenues & Volume By Others for the Period 2022-2032F
- United Kingdom Cast & Forged Import Export Trade Statistics
- Market Opportunity Assessment By Product Types
- Market Opportunity Assessment By Activity Types
- Market Opportunity Assessment By Applications
- United Kingdom Cast & Forged Top Companies Market Share
- United Kingdom Cast & Forged Competitive Benchmarking By Technical and Operational Parameters
- United Kingdom Cast & Forged Company Profiles
- United Kingdom Cast & Forged Key Strategic Recommendations
Frequently Asked Questions About the Market Study (FAQs):
6Wresearch actively monitors the United Kingdom Cast & Forged Market and publishes its comprehensive annual report, highlighting emerging trends, growth drivers, revenue analysis, and forecast outlook. Our insights help businesses to make data-backed strategic decisions with ongoing market dynamics. Our analysts track relevent industries related to the United Kingdom Cast & Forged Market, allowing our clients with actionable intelligence and reliable forecasts tailored to emerging regional needs.
Yes, we provide customisation as per your requirements. To learn more, feel free to contact us on sales@6wresearch.com
| Table of Contents |
| 1. Executive Summary |
| 2. Introduction |
| 2.1. Key Highlights of the Report |
| 2.2. Report Description |
| 2.3. Market Scope & Segmentation |
| 2.4. Research Methodology |
| 2.5. Assumptions |
| 3. United Kingdom Cast & Forged Market Overview |
| 3.1. United Kingdom Country Macro Economic Indicators |
| 3.2. United Kingdom Cast & Forged Market Revenues & Volume, 2022 & 2032F |
| 3.3. United Kingdom Cast & Forged Market - Industry Life Cycle |
| 3.4. United Kingdom Cast & Forged Market - Porter's Five Forces |
| 3.5. United Kingdom Cast & Forged Market Revenues & Volume Share, By Product Types, 2022 & 2032F |
| 3.6. United Kingdom Cast & Forged Market Revenues & Volume Share, By Activity Types, 2022 & 2032F |
| 3.7. United Kingdom Cast & Forged Market Revenues & Volume Share, By Applications, 2022 & 2032F |
| 4. United Kingdom Cast & Forged Market Dynamics |
| 4.1. Impact Analysis |
| 4.2. Market Drivers |
| 4.2.1 Increasing demand for lightweight materials in automotive and aerospace industries |
| 4.2.2 Growing investments in infrastructure development projects |
| 4.2.3 Technological advancements in casting and forging processes |
| 4.3. Market Restraints |
| 4.3.1 Fluctuating raw material prices |
| 4.3.2 Environmental regulations impacting manufacturing processes |
| 4.3.3 Intense competition from alternative materials |
| 5. United Kingdom Cast & Forged Market Trends |
| 6. United Kingdom Cast & Forged Market, By Types |
| 6.1. United Kingdom Cast & Forged Market, By Product Types |
| 6.1.1 Overview and Analysis |
| 6.1.2. United Kingdom Cast & Forged Market Revenues & Volume, By Product Types, 2022-2032F |
| 6.1.3. United Kingdom Cast & Forged Market Revenues & Volume, By Light Alloys, 2022-2032F |
| 6.1.4. United Kingdom Cast & Forged Market Revenues & Volume, By Copper Alloys, 2022-2032F |
| 6.1.5. United Kingdom Cast & Forged Market Revenues & Volume, By Iron Casting, 2022-2032F |
| 6.1.6. United Kingdom Cast & Forged Market Revenues & Volume, By Steel Casting, 2022-2032F |
| 6.1.7. United Kingdom Cast & Forged Market Revenues & Volume, By Miscellaneous, 2022-2032F |
| 6.2. United Kingdom Cast & Forged Market, By Activity Types |
| 6.2.1. Overview and Analysis |
| 6.2.2. United Kingdom Cast & Forged Market Revenues & Volume, By Closed Die Forging, 2022-2032F |
| 6.2.3. United Kingdom Cast & Forged Market Revenues & Volume, By Open Die Forging, 2022-2032F |
| 6.2.4. United Kingdom Cast & Forged Market Revenues & Volume, By Rolled Ring Forging, 2022-2032F |
| 6.2.5. United Kingdom Cast & Forged Market Revenues & Volume, By Cold Forging, 2022-2032F |
| 6.2.6. United Kingdom Cast & Forged Market Revenues & Volume, By Non-ferrous Closed Die Forging, 2022-2032F |
| 6.3. United Kingdom Cast & Forged Market, By Applications |
| 6.3.1. Overview and Analysis |
| 6.3.2. United Kingdom Cast & Forged Market Revenues & Volume, By Automotive, 2022-2032F |
| 6.3.3 United Kingdom Cast & Forged Market Revenues & Volume, By Aerospace, 2022-2032F |
| 6.3.4. United Kingdom Cast & Forged Market Revenues & Volume, By Oil & Gas, 2022-2032F |
| 6.3.5. United Kingdom Cast & Forged Market Revenues & Volume, By Construction, 2022-2032F |
| 6.3.6. United Kingdom Cast & Forged Market Revenues & Volume, By Agriculture, 2022-2032F |
| 6.3.7. United Kingdom Cast & Forged Market Revenues & Volume, By Industrial, 2022-2032F |
| 7. United Kingdom Cast & Forged Market Import-Export Trade Statistics |
| 7.1. United Kingdom Cast & Forged Market Export to Major Countries |
| 7.2. United Kingdom Cast & Forged Market Imports from Major Countries |
| 8. United Kingdom Cast & Forged Market Key Performance Indicators |
| 8.1 Average production time per unit |
| 8.2 Percentage of materials wastage in casting and forging processes |
| 8.3 Percentage of defects in finished products |
| 8.4 Energy efficiency in production processes |
| 8.5 Adoption rate of automation and digitalization in manufacturing |
| 9. United Kingdom Cast & Forged Market - Opportunity Assessment |
| 9.1. United Kingdom Cast & Forged Market Opportunity Assessment, By Product Types, 2022 & 2032F |
| 9.2. United Kingdom Cast & Forged Market Opportunity Assessment, By Activity Types, 2022 & 2032F |
| 9.3. United Kingdom Cast & Forged Market Opportunity Assessment, By Applications, 2022 & 2032F |
| 10. United Kingdom Cast & Forged Market - Competitive Landscape |
| 10.1. United Kingdom Cast & Forged Market Revenue Share, By Companies, 2025 |
| 10.2. United Kingdom Cast & Forged Market Competitive Benchmarking, By Operating and Technical Parameters |
| 11. Company Profiles |
| 12. Recommendations |
| 13. Disclaimer |
Global Go To Market Strategy - 2030
Export potential enables firms to identify high-growth global markets with greater confidence by combining advanced trade intelligence with a structured quantitative methodology. The framework analyzes emerging demand trends and country-level import patterns while integrating macroeconomic and trade datasets such as GDP and population forecasts, bilateral import–export flows, tariff structures, elasticity differentials between developed and developing economies, geographic distance, and import demand projections. Using weighted trade values from 2020–2024 as the base period to project country-to-country export potential for 2030, these inputs are operationalized through calculated drivers such as gravity model parameters, tariff impact factors, and projected GDP per-capita growth. Through an analysis of hidden potentials, demand hotspots, and market conditions that are most favorable to success, this method enables firms to focus on target countries, maximize returns, and global expansion with data, backed by accuracy.
By factoring in the projected importer demand gap that is currently unmet and could be potential opportunity, it identifies the potential for the Exporter (Country) among 190 countries, against the general trade analysis, which identifies the biggest importer or exporter.
To discover high-growth global markets and optimize your business strategy:
Click Here
Pricing
- Single User License$ 1,995
- Department License$ 2,400
- Site License$ 3,120
- Global License$ 3,795

Leadership Perspectives from Industry Events
Search
Thought Leadership and Analyst Meet


Our Clients
6WResearch In News
- India Air Conditioner Market Set for Strong Rebound in 2026 After Weather-Led Correction and GST-Driven Recovery: 6Wresearch
- ADAS in India: How Automatic Emergency Braking, Blind Spot Detection & Driver Monitoring are Transforming Road Safety
- Doha a strategic location for EV manufacturing hub: IPA Qatar
- Demand for luxury TVs surging in the GCC, says Samsung
- Empowering Growth: The Thriving Journey of Bangladesh’s Cable Industry
- Demand for luxury TVs surging in the GCC, says Samsung
Latest Reports
- Nicaragua RPG Gaming Market (2026-2032)
- New Zealand RPG Gaming Market (2026-2032)
- Netherlands RPG Gaming Market (2026-2032)
- Nauru RPG Gaming Market (2026-2032)
- Namibia RPG Gaming Market (2026-2032)
- Mozambique RPG Gaming Market (2026-2032)
- Montenegro RPG Gaming Market (2026-2032)
- Mongolia RPG Gaming Market (2026-2032)
- Monaco RPG Gaming Market (2026-2032)
- Micronesia RPG Gaming Market (2026-2032)
Industry Events and Analyst Meet

EV India Expo 2026

HIMTEX 2026

India Refining Summit 2026

India EV Show 2026

EV tech India Expo 2026
Whitepaper
- Middle East & Africa Commercial Security Market Click here to view more.
- Middle East & Africa Fire Safety Systems & Equipment Market Click here to view more.
- GCC Drone Market Click here to view more.
- Middle East Lighting Fixture Market Click here to view more.
- GCC Physical & Perimeter Security Market Click here to view more.