United Kingdom (UK) Diatomite Market (2026-2032) Outlook | Size, Growth, Companies, Value, Analysis, Share, Revenue, Forecast, Industry & Trends
Market Forecast By Type (Natural, Calcined, Flux Calcined), By Application (Filter Aids, Filler, Absorbents, Construction Materials, Others) And Competitive Landscape
| Product Code: ETC251709 | Publication Date: Aug 2022 | Updated Date: Mar 2026 | Product Type: Market Research Report | |
| Publisher: 6Wresearch | Author: Ravi Bhandari | No. of Pages: 75 | No. of Figures: 35 | No. of Tables: 20 |
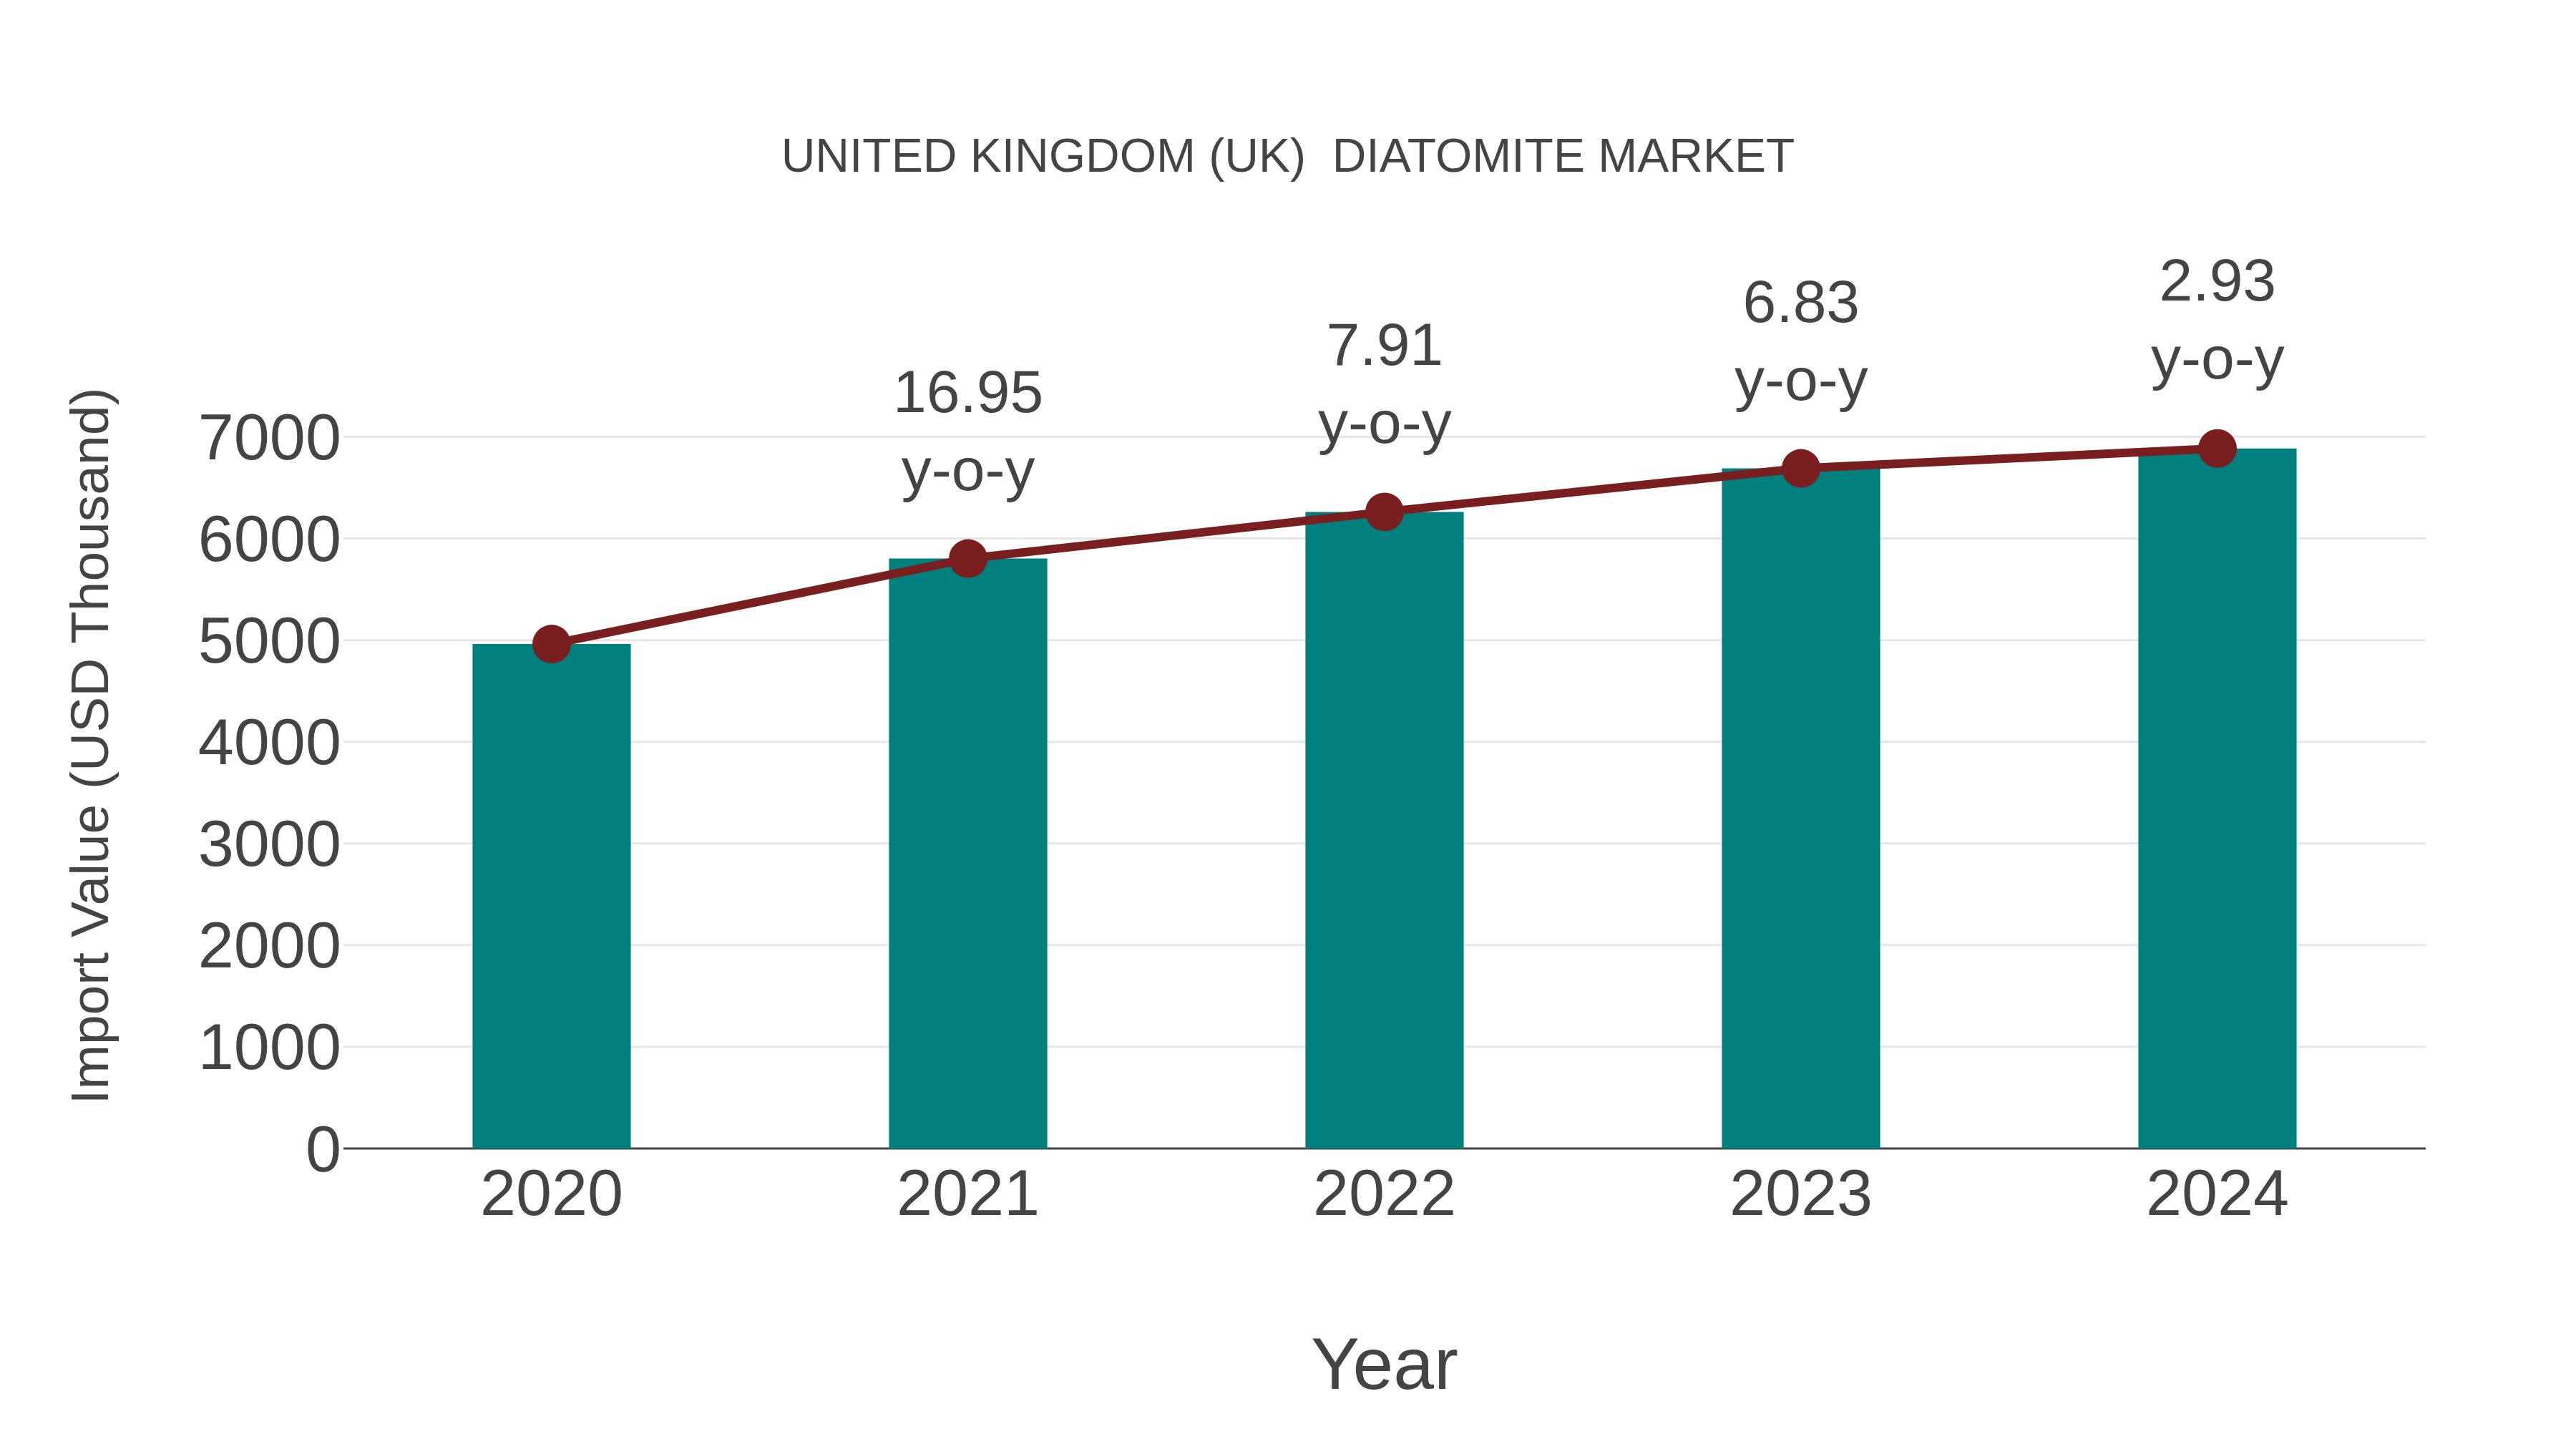
United Kingdom (UK) Diatomite Market: Import Trend Analysis
The United Kingdom import trend for diatomite in 2024 showed a growth rate of 2.93%, with a compound annual growth rate (CAGR) of 8.54% for the period 2020-2024. This increase in import momentum can be attributed to a consistent demand shift towards diatomite-based products in various industries, indicating market stability and sustained interest in this mineral resource.
United Kingdom (UK) Export Potential Assessment For Diatomite Market (Values in USD Thousand)
United Kingdom (UK) Diatomite Market Overview
The diatomite market in the UK is primarily driven by its increasing applications in filtration, agriculture, and industrial processes. Diatomite`s natural properties as a filter medium and its use in pest control products contribute significantly to its demand. The market growth is also influenced by ongoing innovations in extraction techniques and increasing awareness regarding its environmental benefits.
Drivers of the market
The UK diatomite market is primarily driven by increasing demand in filtration applications across various industries such as water treatment, pharmaceuticals, and food and beverage. The rising emphasis on sustainable and eco-friendly filtration materials further boosts market growth. Moreover, technological advancements in mining and processing techniques enhance the efficiency of diatomite extraction, supporting market expansion.
Challenges of the market
The UK diatomite market faces challenges primarily due to fluctuating raw material costs and environmental regulations impacting mining operations. Additionally, competition from alternative filter aids and substitutes poses a significant challenge to market growth.
Government Policy of the market
The UK diatomite market is regulated under environmental and mining policies aimed at sustainable extraction practices. Government initiatives prioritize environmental impact assessments and compliance with extraction regulations to ensure minimal ecological disturbance.
Key Highlights of the Report:
- United Kingdom (UK) Diatomite Market Outlook
- Market Size of United Kingdom (UK) Diatomite Market, 2025
- Forecast of United Kingdom (UK) Diatomite Market, 2032
- Historical Data and Forecast of United Kingdom (UK) Diatomite Revenues & Volume for the Period 2022-2032F
- United Kingdom (UK) Diatomite Market Trend Evolution
- United Kingdom (UK) Diatomite Market Drivers and Challenges
- United Kingdom (UK) Diatomite Price Trends
- United Kingdom (UK) Diatomite Porter's Five Forces
- United Kingdom (UK) Diatomite Industry Life Cycle
- Historical Data and Forecast of United Kingdom (UK) Diatomite Market Revenues & Volume By Type for the Period 2022-2032F
- Historical Data and Forecast of United Kingdom (UK) Diatomite Market Revenues & Volume By Natural for the Period 2022-2032F
- Historical Data and Forecast of United Kingdom (UK) Diatomite Market Revenues & Volume By Calcined for the Period 2022-2032F
- Historical Data and Forecast of United Kingdom (UK) Diatomite Market Revenues & Volume By Flux Calcined for the Period 2022-2032F
- Historical Data and Forecast of United Kingdom (UK) Diatomite Market Revenues & Volume By Application for the Period 2022-2032F
- Historical Data and Forecast of United Kingdom (UK) Diatomite Market Revenues & Volume By Filter Aids for the Period 2022-2032F
- Historical Data and Forecast of United Kingdom (UK) Diatomite Market Revenues & Volume By Filler for the Period 2022-2032F
- Historical Data and Forecast of United Kingdom (UK) Diatomite Market Revenues & Volume By Absorbents for the Period 2022-2032F
- Historical Data and Forecast of United Kingdom (UK) Diatomite Market Revenues & Volume By Construction Materials for the Period 2022-2032F
- Historical Data and Forecast of United Kingdom (UK) Diatomite Market Revenues & Volume By Others for the Period 2022-2032F
- United Kingdom (UK) Diatomite Import Export Trade Statistics
- Market Opportunity Assessment By Type
- Market Opportunity Assessment By Application
- United Kingdom (UK) Diatomite Top Companies Market Share
- United Kingdom (UK) Diatomite Competitive Benchmarking By Technical and Operational Parameters
- United Kingdom (UK) Diatomite Company Profiles
- United Kingdom (UK) Diatomite Key Strategic Recommendations
United Kingdom (UK) Diatomite Market (2026-2032): FAQs
6Wresearch actively monitors the United Kingdom (UK) Diatomite Market and publishes its comprehensive annual report, highlighting emerging trends, growth drivers, revenue analysis, and forecast outlook. Our insights help businesses to make data-backed strategic decisions with ongoing market dynamics. Our analysts track relevent industries related to the United Kingdom (UK) Diatomite Market, allowing our clients with actionable intelligence and reliable forecasts tailored to emerging regional needs.
Yes, we provide customisation as per your requirements. To learn more, feel free to contact us on sales@6wresearch.com
1 Executive Summary |
2 Introduction |
2.1 Key Highlights of the Report |
2.2 Report Description |
2.3 Market Scope & Segmentation |
2.4 Research Methodology |
2.5 Assumptions |
3 United Kingdom (UK) Diatomite Market Overview |
3.1 United Kingdom (UK) Country Macro Economic Indicators |
3.2 United Kingdom (UK) Diatomite Market Revenues & Volume, 2022 & 2032F |
3.3 United Kingdom (UK) Diatomite Market - Industry Life Cycle |
3.4 United Kingdom (UK) Diatomite Market - Porter's Five Forces |
3.5 United Kingdom (UK) Diatomite Market Revenues & Volume Share, By Type, 2022 & 2032F |
3.6 United Kingdom (UK) Diatomite Market Revenues & Volume Share, By Application, 2022 & 2032F |
4 United Kingdom (UK) Diatomite Market Dynamics |
4.1 Impact Analysis |
4.2 Market Drivers |
4.2.1 Increasing demand for diatomite in various end-use industries such as agriculture, filtration, and construction. |
4.2.2 Growing awareness about the benefits of diatomite in environmental applications due to its natural and sustainable properties. |
4.2.3 Rising investments in research and development activities to explore new applications and enhance the quality of diatomite products. |
4.3 Market Restraints |
4.3.1 Fluctuations in diatomite prices due to factors like supply chain disruptions, geopolitical tensions, and changes in regulatory policies. |
4.3.2 Competition from alternative materials that can serve similar purposes as diatomite, posing a threat to market growth. |
4.3.3 Environmental concerns related to diatomite mining and processing, leading to stricter regulations and compliance requirements. |
5 United Kingdom (UK) Diatomite Market Trends |
6 United Kingdom (UK) Diatomite Market, By Types |
6.1 United Kingdom (UK) Diatomite Market, By Type |
6.1.1 Overview and Analysis |
6.1.2 United Kingdom (UK) Diatomite Market Revenues & Volume, By Type, 2022-2032F |
6.1.3 United Kingdom (UK) Diatomite Market Revenues & Volume, By Natural, 2022-2032F |
6.1.4 United Kingdom (UK) Diatomite Market Revenues & Volume, By Calcined, 2022-2032F |
6.1.5 United Kingdom (UK) Diatomite Market Revenues & Volume, By Flux Calcined, 2022-2032F |
6.2 United Kingdom (UK) Diatomite Market, By Application |
6.2.1 Overview and Analysis |
6.2.2 United Kingdom (UK) Diatomite Market Revenues & Volume, By Filter Aids, 2022-2032F |
6.2.3 United Kingdom (UK) Diatomite Market Revenues & Volume, By Filler, 2022-2032F |
6.2.4 United Kingdom (UK) Diatomite Market Revenues & Volume, By Absorbents, 2022-2032F |
6.2.5 United Kingdom (UK) Diatomite Market Revenues & Volume, By Construction Materials, 2022-2032F |
6.2.6 United Kingdom (UK) Diatomite Market Revenues & Volume, By Others, 2022-2032F |
7 United Kingdom (UK) Diatomite Market Import-Export Trade Statistics |
7.1 United Kingdom (UK) Diatomite Market Export to Major Countries |
7.2 United Kingdom (UK) Diatomite Market Imports from Major Countries |
8 United Kingdom (UK) Diatomite Market Key Performance Indicators |
8.1 Environmental impact metrics related to sustainable mining practices and carbon footprint reduction efforts. |
8.2 Research and development investments in innovative diatomite applications and product development. |
8.3 Adoption rates of diatomite-based solutions in key industries such as agriculture, filtration, and construction. |
9 United Kingdom (UK) Diatomite Market - Opportunity Assessment |
9.1 United Kingdom (UK) Diatomite Market Opportunity Assessment, By Type, 2022 & 2032F |
9.2 United Kingdom (UK) Diatomite Market Opportunity Assessment, By Application, 2022 & 2032F |
10 United Kingdom (UK) Diatomite Market - Competitive Landscape |
10.1 United Kingdom (UK) Diatomite Market Revenue Share, By Companies, 2025 |
10.2 United Kingdom (UK) Diatomite Market Competitive Benchmarking, By Operating and Technical Parameters |
11 Company Profiles |
12 Recommendations |
13 Disclaimer |
Global Go To Market Strategy - 2030
Export potential enables firms to identify high-growth global markets with greater confidence by combining advanced trade intelligence with a structured quantitative methodology. The framework analyzes emerging demand trends and country-level import patterns while integrating macroeconomic and trade datasets such as GDP and population forecasts, bilateral import–export flows, tariff structures, elasticity differentials between developed and developing economies, geographic distance, and import demand projections. Using weighted trade values from 2020–2024 as the base period to project country-to-country export potential for 2030, these inputs are operationalized through calculated drivers such as gravity model parameters, tariff impact factors, and projected GDP per-capita growth. Through an analysis of hidden potentials, demand hotspots, and market conditions that are most favorable to success, this method enables firms to focus on target countries, maximize returns, and global expansion with data, backed by accuracy.
By factoring in the projected importer demand gap that is currently unmet and could be potential opportunity, it identifies the potential for the Exporter (Country) among 190 countries, against the general trade analysis, which identifies the biggest importer or exporter.
To discover high-growth global markets and optimize your business strategy:
Click Here
Pricing
- Single User License$ 1,995
- Department License$ 2,400
- Site License$ 3,120
- Global License$ 3,795

Leadership Perspectives from Industry Events
Search
Thought Leadership and Analyst Meet


Our Clients
6WResearch In News
- India Air Conditioner Market Set for Strong Rebound in 2026 After Weather-Led Correction and GST-Driven Recovery: 6Wresearch
- ADAS in India: How Automatic Emergency Braking, Blind Spot Detection & Driver Monitoring are Transforming Road Safety
- Doha a strategic location for EV manufacturing hub: IPA Qatar
- Demand for luxury TVs surging in the GCC, says Samsung
- Empowering Growth: The Thriving Journey of Bangladesh’s Cable Industry
- Demand for luxury TVs surging in the GCC, says Samsung
Latest Reports
- Nicaragua RPG Gaming Market (2026-2032)
- New Zealand RPG Gaming Market (2026-2032)
- Netherlands RPG Gaming Market (2026-2032)
- Nauru RPG Gaming Market (2026-2032)
- Namibia RPG Gaming Market (2026-2032)
- Mozambique RPG Gaming Market (2026-2032)
- Montenegro RPG Gaming Market (2026-2032)
- Mongolia RPG Gaming Market (2026-2032)
- Monaco RPG Gaming Market (2026-2032)
- Micronesia RPG Gaming Market (2026-2032)
Industry Events and Analyst Meet

EV India Expo 2026

HIMTEX 2026

India Refining Summit 2026

India EV Show 2026

EV tech India Expo 2026
Whitepaper
- Middle East & Africa Commercial Security Market Click here to view more.
- Middle East & Africa Fire Safety Systems & Equipment Market Click here to view more.
- GCC Drone Market Click here to view more.
- Middle East Lighting Fixture Market Click here to view more.
- GCC Physical & Perimeter Security Market Click here to view more.