United Kingdom (UK) Kaolin Market (2025-2031) Outlook | Share, Size, Industry, Value, Companies, Revenue, Analysis, Forecast, Growth & Trends
Market Forecast By Process (Water-washed, Airfloat, Calcined, Delaminated, Surface-modified & Unprocessed), By End-users (Ceramics & Sanitarywares, Fiberglass, Paints & Coatings, Rubber, Adhesives & Sealants, Plastics, Others) And Competitive Landscape
| Product Code: ETC087808 | Publication Date: Jun 2021 | Updated Date: Aug 2025 | Product Type: Report | |
| Publisher: 6Wresearch | Author: Ravi Bhandari | No. of Pages: 70 | No. of Figures: 35 | No. of Tables: 5 |
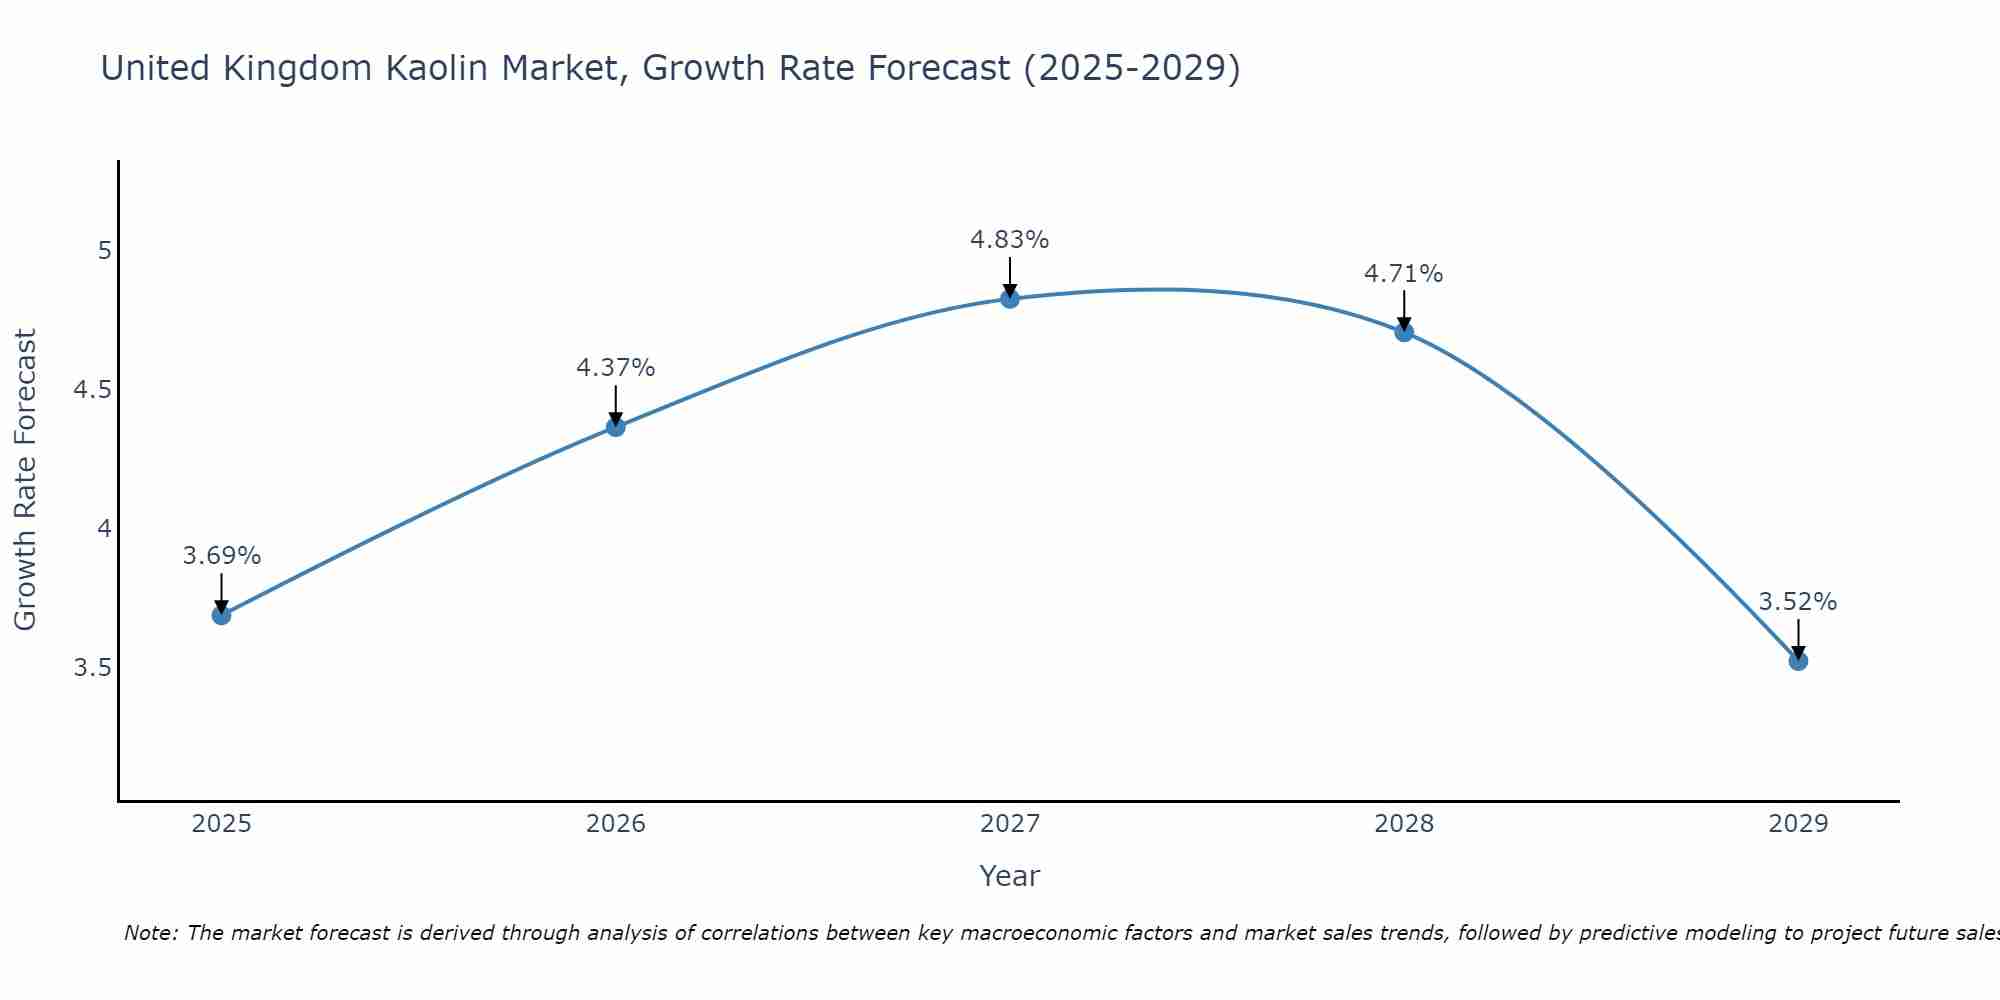
United Kingdom Kaolin Market Size Growth Rate
The United Kingdom Kaolin Market is projected to witness mixed growth rate patterns during 2025 to 2029. Starting at 3.69% in 2025, the market peaks at 4.83% in 2027, and settles at 3.52% by 2029.
United Kingdom (UK) Kaolin Market Overview
Kaolin, a versatile clay mineral, finds extensive use in the UK in industries such as ceramics, paper, cosmetics, and pharmaceuticals. The market is driven by its properties such as whiteness, fine particle size, and chemical inertness, making it indispensable in various applications.
Drivers of the market
The UK kaolin market is driven by its extensive use in the paper, ceramics, and construction industries. Rising construction activities and infrastructure development propel demand for kaolin in paints, coatings, and cement applications. Technological advancements in kaolin processing techniques and its eco-friendly properties also contribute to market growth.
Challenges of the market
The kaolin market in the UK encounters challenges such as fluctuating demand from end-use industries like ceramics, paper, and construction. Price volatility due to global supply dynamics and environmental regulations affecting mining and processing operations pose challenges for market players. Moreover, competition from alternative mineral fillers and additives necessitates strategic differentiation and product innovation to maintain market competitiveness and profitability.
Government Policy of the market
Government policies in the UK encourage responsible mining practices, environmental stewardship, and sustainable extraction of minerals like kaolin. Regulatory frameworks ensure compliance with environmental standards and community engagement in mining operations.
Key Highlights of the Report:
- United Kingdom (UK) Kaolin Market Outlook
- Market Size of United Kingdom (UK) Kaolin Market, 2024
- Forecast of United Kingdom (UK) Kaolin Market, 2031
- Historical Data and Forecast of United Kingdom (UK) Kaolin Revenues & Volume for the Period 2021-2031
- United Kingdom (UK) Kaolin Market Trend Evolution
- United Kingdom (UK) Kaolin Market Drivers and Challenges
- United Kingdom (UK) Kaolin Price Trends
- United Kingdom (UK) Kaolin Porter's Five Forces
- United Kingdom (UK) Kaolin Industry Life Cycle
- Historical Data and Forecast of United Kingdom (UK) Kaolin Market Revenues & Volume By Process for the Period 2021-2031
- Historical Data and Forecast of United Kingdom (UK) Kaolin Market Revenues & Volume By Water-washed for the Period 2021-2031
- Historical Data and Forecast of United Kingdom (UK) Kaolin Market Revenues & Volume By Airfloat for the Period 2021-2031
- Historical Data and Forecast of United Kingdom (UK) Kaolin Market Revenues & Volume By Calcined for the Period 2021-2031
- Historical Data and Forecast of United Kingdom (UK) Kaolin Market Revenues & Volume By Delaminated for the Period 2021-2031
- Historical Data and Forecast of United Kingdom (UK) Kaolin Market Revenues & Volume By Surface-modified & Unprocessed for the Period 2021-2031
- Historical Data and Forecast of United Kingdom (UK) Kaolin Market Revenues & Volume By End-users for the Period 2021-2031
- Historical Data and Forecast of United Kingdom (UK) Kaolin Market Revenues & Volume By Ceramics & Sanitarywares for the Period 2021-2031
- Historical Data and Forecast of United Kingdom (UK) Kaolin Market Revenues & Volume By Fiberglass for the Period 2021-2031
- Historical Data and Forecast of United Kingdom (UK) Kaolin Market Revenues & Volume By Paints & Coatings for the Period 2021-2031
- Historical Data and Forecast of United Kingdom (UK) Kaolin Market Revenues & Volume By Rubber for the Period 2021-2031
- Historical Data and Forecast of United Kingdom (UK) Kaolin Market Revenues & Volume By Adhesives & Sealants for the Period 2021-2031
- Historical Data and Forecast of United Kingdom (UK) Kaolin Market Revenues & Volume By Plastics for the Period 2021-2031
- Historical Data and Forecast of United Kingdom (UK) Kaolin Market Revenues & Volume By Others for the Period 2021-2031
- United Kingdom (UK) Kaolin Import Export Trade Statistics
- Market Opportunity Assessment By Process
- Market Opportunity Assessment By End-users
- United Kingdom (UK) Kaolin Top Companies Market Share
- United Kingdom (UK) Kaolin Competitive Benchmarking By Technical and Operational Parameters
- United Kingdom (UK) Kaolin Company Profiles
- United Kingdom (UK) Kaolin Key Strategic Recommendations
Frequently Asked Questions About the Market Study (FAQs):
6Wresearch actively monitors the United Kingdom (UK) Kaolin Market and publishes its comprehensive annual report, highlighting emerging trends, growth drivers, revenue analysis, and forecast outlook. Our insights help businesses to make data-backed strategic decisions with ongoing market dynamics. Our analysts track relevent industries related to the United Kingdom (UK) Kaolin Market, allowing our clients with actionable intelligence and reliable forecasts tailored to emerging regional needs.
Yes, we provide customisation as per your requirements. To learn more, feel free to contact us on sales@6wresearch.com
1 Executive Summary |
2 Introduction |
2.1 Key Highlights of the Report |
2.2 Report Description |
2.3 Market Scope & Segmentation |
2.4 Research Methodology |
2.5 Assumptions |
3 United Kingdom (UK) Kaolin Market Overview |
3.1 United Kingdom (UK) Country Macro Economic Indicators |
3.2 United Kingdom (UK) Kaolin Market Revenues & Volume, 2021 & 2031F |
3.3 United Kingdom (UK) Kaolin Market - Industry Life Cycle |
3.4 United Kingdom (UK) Kaolin Market - Porter's Five Forces |
3.5 United Kingdom (UK) Kaolin Market Revenues & Volume Share, By Process, 2021 & 2031F |
3.6 United Kingdom (UK) Kaolin Market Revenues & Volume Share, By End-users, 2021 & 2031F |
4 United Kingdom (UK) Kaolin Market Dynamics |
4.1 Impact Analysis |
4.2 Market Drivers |
4.2.1 Increasing demand for kaolin in the construction industry for manufacturing ceramics, paints, and coatings. |
4.2.2 Growing adoption of kaolin in the paper and packaging industry for improving print quality and reducing costs. |
4.2.3 Rising use of kaolin in the pharmaceutical and cosmetics sectors due to its properties as an ingredient in skincare products. |
4.3 Market Restraints |
4.3.1 Fluctuating prices of kaolin due to supply chain disruptions and raw material availability. |
4.3.2 Environmental concerns related to kaolin mining and processing, leading to stricter regulations and sustainability requirements. |
5 United Kingdom (UK) Kaolin Market Trends |
6 United Kingdom (UK) Kaolin Market, By Types |
6.1 United Kingdom (UK) Kaolin Market, By Process |
6.1.1 Overview and Analysis |
6.1.2 United Kingdom (UK) Kaolin Market Revenues & Volume, By Process, 2021-2031F |
6.1.3 United Kingdom (UK) Kaolin Market Revenues & Volume, By Water-washed, 2021-2031F |
6.1.4 United Kingdom (UK) Kaolin Market Revenues & Volume, By Airfloat, 2021-2031F |
6.1.5 United Kingdom (UK) Kaolin Market Revenues & Volume, By Calcined, 2021-2031F |
6.1.6 United Kingdom (UK) Kaolin Market Revenues & Volume, By Delaminated, 2021-2031F |
6.1.7 United Kingdom (UK) Kaolin Market Revenues & Volume, By Surface-modified & Unprocessed, 2021-2031F |
6.2 United Kingdom (UK) Kaolin Market, By End-users |
6.2.1 Overview and Analysis |
6.2.2 United Kingdom (UK) Kaolin Market Revenues & Volume, By Ceramics & Sanitarywares, 2021-2031F |
6.2.3 United Kingdom (UK) Kaolin Market Revenues & Volume, By Fiberglass, 2021-2031F |
6.2.4 United Kingdom (UK) Kaolin Market Revenues & Volume, By Paints & Coatings, 2021-2031F |
6.2.5 United Kingdom (UK) Kaolin Market Revenues & Volume, By Rubber, 2021-2031F |
6.2.6 United Kingdom (UK) Kaolin Market Revenues & Volume, By Adhesives & Sealants, 2021-2031F |
6.2.7 United Kingdom (UK) Kaolin Market Revenues & Volume, By Plastics, 2021-2031F |
7 United Kingdom (UK) Kaolin Market Import-Export Trade Statistics |
7.1 United Kingdom (UK) Kaolin Market Export to Major Countries |
7.2 United Kingdom (UK) Kaolin Market Imports from Major Countries |
8 United Kingdom (UK) Kaolin Market Key Performance Indicators |
8.1 Average selling price of kaolin products in the UK market. |
8.2 Number of new product developments or innovations using kaolin. |
8.3 Percentage of kaolin sourced from sustainable and environmentally friendly suppliers. |
9 United Kingdom (UK) Kaolin Market - Opportunity Assessment |
9.1 United Kingdom (UK) Kaolin Market Opportunity Assessment, By Process, 2021 & 2031F |
9.2 United Kingdom (UK) Kaolin Market Opportunity Assessment, By End-users, 2021 & 2031F |
10 United Kingdom (UK) Kaolin Market - Competitive Landscape |
10.1 United Kingdom (UK) Kaolin Market Revenue Share, By Companies, 2024 |
10.2 United Kingdom (UK) Kaolin Market Competitive Benchmarking, By Operating and Technical Parameters |
11 Company Profiles |
12 Recommendations |
13 Disclaimer |
Global Go To Market Strategy - 2030
Export potential enables firms to identify high-growth global markets with greater confidence by combining advanced trade intelligence with a structured quantitative methodology. The framework analyzes emerging demand trends and country-level import patterns while integrating macroeconomic and trade datasets such as GDP and population forecasts, bilateral import–export flows, tariff structures, elasticity differentials between developed and developing economies, geographic distance, and import demand projections. Using weighted trade values from 2020–2024 as the base period to project country-to-country export potential for 2030, these inputs are operationalized through calculated drivers such as gravity model parameters, tariff impact factors, and projected GDP per-capita growth. Through an analysis of hidden potentials, demand hotspots, and market conditions that are most favorable to success, this method enables firms to focus on target countries, maximize returns, and global expansion with data, backed by accuracy.
By factoring in the projected importer demand gap that is currently unmet and could be potential opportunity, it identifies the potential for the Exporter (Country) among 190 countries, against the general trade analysis, which identifies the biggest importer or exporter.
To discover high-growth global markets and optimize your business strategy:
Click Here
Pricing
- Single User License$ 1,995
- Department License$ 2,400
- Site License$ 3,120
- Global License$ 3,795

Leadership Perspectives from Industry Events
Search
Thought Leadership and Analyst Meet


Our Clients
6WResearch In News
- India Air Conditioner Market Set for Strong Rebound in 2026 After Weather-Led Correction and GST-Driven Recovery: 6Wresearch
- ADAS in India: How Automatic Emergency Braking, Blind Spot Detection & Driver Monitoring are Transforming Road Safety
- Doha a strategic location for EV manufacturing hub: IPA Qatar
- Demand for luxury TVs surging in the GCC, says Samsung
- Empowering Growth: The Thriving Journey of Bangladesh’s Cable Industry
- Demand for luxury TVs surging in the GCC, says Samsung
Latest Reports
- Nicaragua RPG Gaming Market (2026-2032)
- New Zealand RPG Gaming Market (2026-2032)
- Netherlands RPG Gaming Market (2026-2032)
- Nauru RPG Gaming Market (2026-2032)
- Namibia RPG Gaming Market (2026-2032)
- Mozambique RPG Gaming Market (2026-2032)
- Montenegro RPG Gaming Market (2026-2032)
- Mongolia RPG Gaming Market (2026-2032)
- Monaco RPG Gaming Market (2026-2032)
- Micronesia RPG Gaming Market (2026-2032)
Industry Events and Analyst Meet

EV India Expo 2026

HIMTEX 2026

India Refining Summit 2026

India EV Show 2026

EV tech India Expo 2026
Whitepaper
- Middle East & Africa Commercial Security Market Click here to view more.
- Middle East & Africa Fire Safety Systems & Equipment Market Click here to view more.
- GCC Drone Market Click here to view more.
- Middle East Lighting Fixture Market Click here to view more.
- GCC Physical & Perimeter Security Market Click here to view more.