United Kingdom (UK) N-propanol Market (2026-2032) Outlook | Size, Value, Share, Trends, Growth, Analysis, Industry, Companies, Revenue & Forecast
Market Forecast By Type (Ethylene Hydrogenation Method, Allyl Alcohol Hydrogenation Method, Other Compounds Byproduct Method), By Application (Coatings, Food Additive, Pharmaceutical, Cosmetics, Others) And Competitive Landscape
| Product Code: ETC335049 | Publication Date: Aug 2022 | Updated Date: Mar 2026 | Product Type: Market Research Report | |
| Publisher: 6Wresearch | Author: Shubham Padhi | No. of Pages: 75 | No. of Figures: 35 | No. of Tables: 20 |
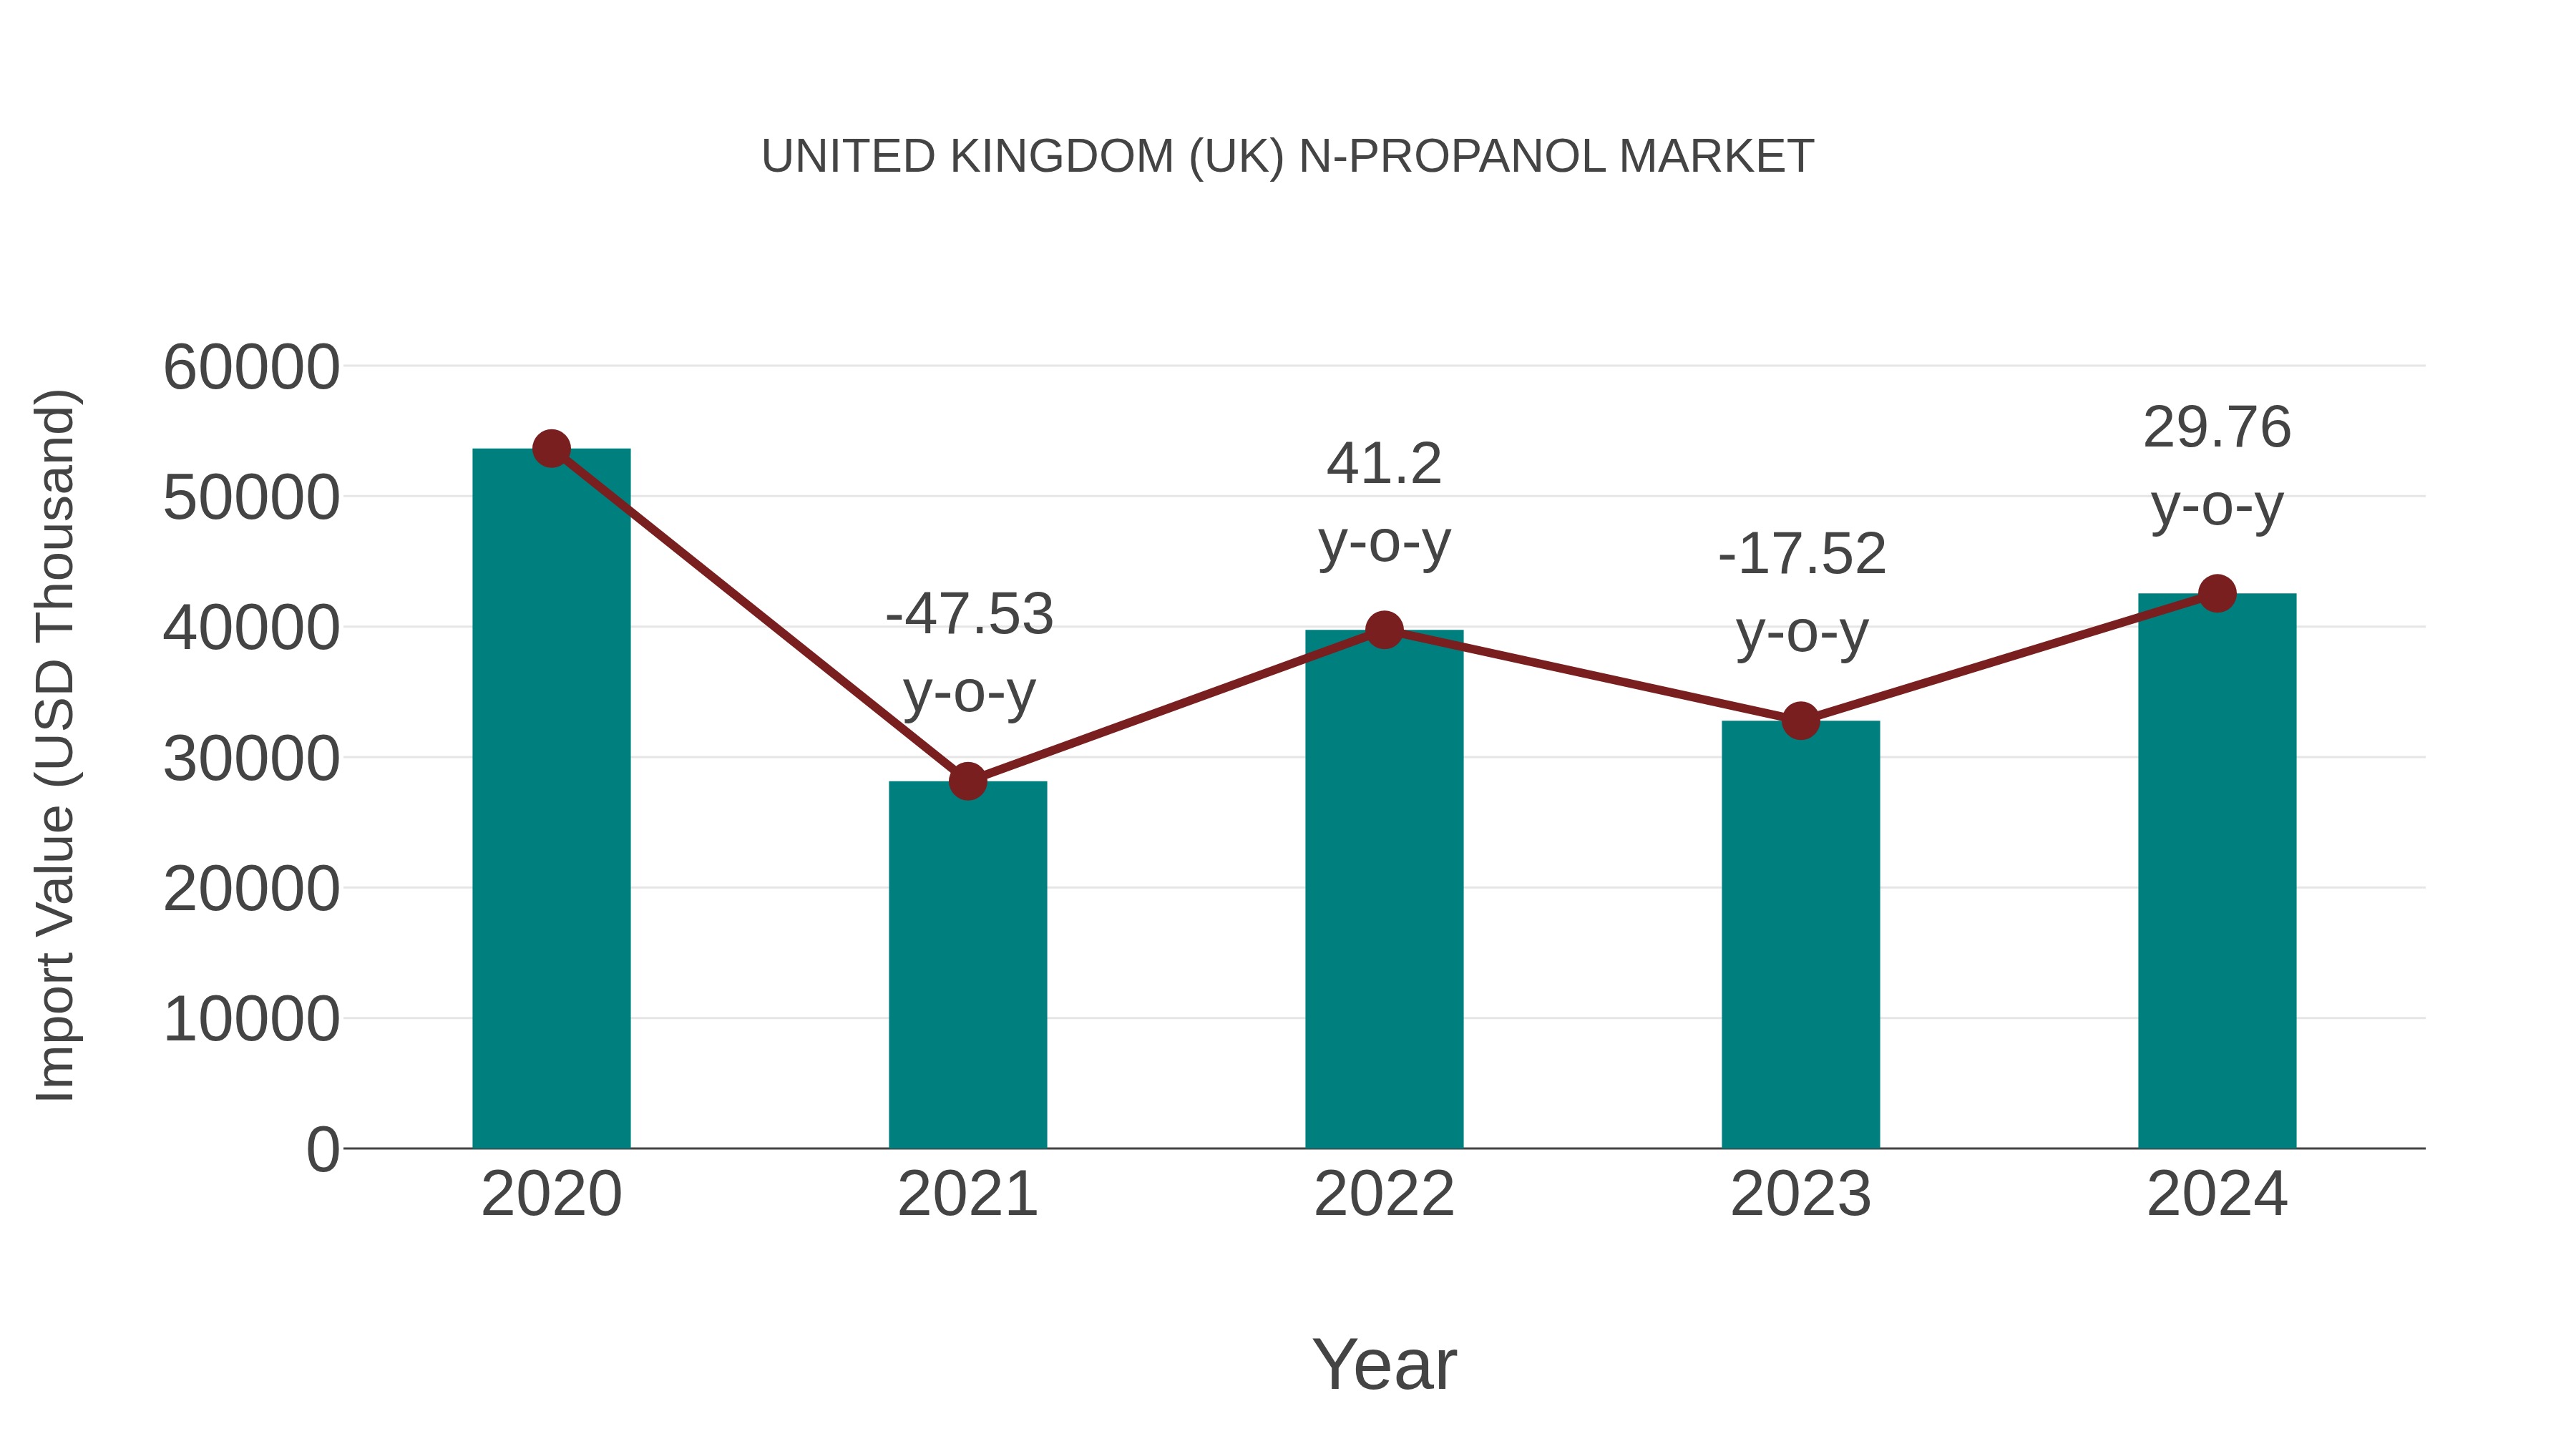
United Kingdom (UK) N-propanol Market: Import Trend Analysis
In 2024, the United Kingdom import trend for N-propanol showed a notable growth rate of 29.76% compared to the previous year. However, the compound annual growth rate (CAGR) for 2020-2024 was -5.64%, indicating a declining trend over the period. This decline could be attributed to shifting demand patterns or changes in trade policies affecting market stability.
United Kingdom (UK) N-propanol Market Overview
Used in pharmaceuticals, chemicals, and cosmetics, the UK N-propanol market supports solvent applications and chemical synthesis. Demand is driven by industrial processes requiring high purity solvents and chemical intermediates.
Drivers of the market
The N-propanol market in the UK is driven by its applications as a solvent, intermediate chemical, and additive in pharmaceuticals, coatings, and chemical manufacturing sectors. N-propanol`s properties such as high solvency power, low toxicity, and compatibility with diverse materials stimulate market demand. Growth in pharmaceutical production, surface coatings, and industrial cleaning processes bolster N-propanol consumption. Technological advancements in production processes and sustainable sourcing practices support market sustainability and regulatory compliance. Collaboration among chemical suppliers, end-user industries, and regulatory bodies fosters market growth and product innovation.
Challenges of the market
Challenges in the UK N-propanol market include fluctuating raw material prices and regulatory compliance with environmental standards. Meeting industrial demand for high-purity N-propanol while ensuring supply chain resilience and cost-effectiveness remains a critical challenge for manufacturers.
Government Policy of the market
The UK government regulates the N-propanol market through policies that ensure chemical safety and environmental protection. The government enforces strict standards for the production, storage, and transportation of N-propanol, minimizing risks to human health and the environment. Policies also promote sustainable manufacturing practices and encourage the use of safer alternatives where possible.
Key Highlights of the Report:
- United Kingdom (UK) N-propanol Market Outlook
- Market Size of United Kingdom (UK) N-propanol Market, 2025
- Forecast of United Kingdom (UK) N-propanol Market, 2032
- Historical Data and Forecast of United Kingdom (UK) N-propanol Revenues & Volume for the Period 2022-2032F
- United Kingdom (UK) N-propanol Market Trend Evolution
- United Kingdom (UK) N-propanol Market Drivers and Challenges
- United Kingdom (UK) N-propanol Price Trends
- United Kingdom (UK) N-propanol Porter's Five Forces
- United Kingdom (UK) N-propanol Industry Life Cycle
- Historical Data and Forecast of United Kingdom (UK) N-propanol Market Revenues & Volume By Type for the Period 2022-2032F
- Historical Data and Forecast of United Kingdom (UK) N-propanol Market Revenues & Volume By Ethylene Hydrogenation Method for the Period 2022-2032F
- Historical Data and Forecast of United Kingdom (UK) N-propanol Market Revenues & Volume By Allyl Alcohol Hydrogenation Method for the Period 2022-2032F
- Historical Data and Forecast of United Kingdom (UK) N-propanol Market Revenues & Volume By Other Compounds Byproduct Method for the Period 2022-2032F
- Historical Data and Forecast of United Kingdom (UK) N-propanol Market Revenues & Volume By Application for the Period 2022-2032F
- Historical Data and Forecast of United Kingdom (UK) N-propanol Market Revenues & Volume By Coatings for the Period 2022-2032F
- Historical Data and Forecast of United Kingdom (UK) N-propanol Market Revenues & Volume By Food Additive for the Period 2022-2032F
- Historical Data and Forecast of United Kingdom (UK) N-propanol Market Revenues & Volume By Pharmaceutical for the Period 2022-2032F
- Historical Data and Forecast of United Kingdom (UK) N-propanol Market Revenues & Volume By Cosmetics for the Period 2022-2032F
- Historical Data and Forecast of United Kingdom (UK) N-propanol Market Revenues & Volume By Others for the Period 2022-2032F
- United Kingdom (UK) N-propanol Import Export Trade Statistics
- Market Opportunity Assessment By Type
- Market Opportunity Assessment By Application
- United Kingdom (UK) N-propanol Top Companies Market Share
- United Kingdom (UK) N-propanol Competitive Benchmarking By Technical and Operational Parameters
- United Kingdom (UK) N-propanol Company Profiles
- United Kingdom (UK) N-propanol Key Strategic Recommendations
United Kingdom (UK) N-propanol Market (2026-2032): FAQs
6Wresearch actively monitors the United Kingdom (UK) N-propanol Market and publishes its comprehensive annual report, highlighting emerging trends, growth drivers, revenue analysis, and forecast outlook. Our insights help businesses to make data-backed strategic decisions with ongoing market dynamics. Our analysts track relevent industries related to the United Kingdom (UK) N-propanol Market, allowing our clients with actionable intelligence and reliable forecasts tailored to emerging regional needs.
Yes, we provide customisation as per your requirements. To learn more, feel free to contact us on sales@6wresearch.com
1 Executive Summary |
2 Introduction |
2.1 Key Highlights of the Report |
2.2 Report Description |
2.3 Market Scope & Segmentation |
2.4 Research Methodology |
2.5 Assumptions |
3 United Kingdom (UK) N-propanol Market Overview |
3.1 United Kingdom (UK) Country Macro Economic Indicators |
3.2 United Kingdom (UK) N-propanol Market Revenues & Volume, 2022 & 2032F |
3.3 United Kingdom (UK) N-propanol Market - Industry Life Cycle |
3.4 United Kingdom (UK) N-propanol Market - Porter's Five Forces |
3.5 United Kingdom (UK) N-propanol Market Revenues & Volume Share, By Type, 2022 & 2032F |
3.6 United Kingdom (UK) N-propanol Market Revenues & Volume Share, By Application, 2022 & 2032F |
4 United Kingdom (UK) N-propanol Market Dynamics |
4.1 Impact Analysis |
4.2 Market Drivers |
4.2.1 Increasing demand from end-use industries such as pharmaceuticals, cosmetics, and paints coatings. |
4.2.2 Growing awareness about the benefits of n-propanol as a solvent and intermediate in various applications. |
4.2.3 Technological advancements leading to improved production processes and quality of n-propanol. |
4.3 Market Restraints |
4.3.1 Fluctuating prices of raw materials impacting the production cost of n-propanol. |
4.3.2 Stringent regulations regarding the use and disposal of chemicals, affecting the market growth. |
4.3.3 Competition from alternative solvents and chemicals in the market. |
5 United Kingdom (UK) N-propanol Market Trends |
6 United Kingdom (UK) N-propanol Market, By Types |
6.1 United Kingdom (UK) N-propanol Market, By Type |
6.1.1 Overview and Analysis |
6.1.2 United Kingdom (UK) N-propanol Market Revenues & Volume, By Type, 2022-2032F |
6.1.3 United Kingdom (UK) N-propanol Market Revenues & Volume, By Ethylene Hydrogenation Method, 2022-2032F |
6.1.4 United Kingdom (UK) N-propanol Market Revenues & Volume, By Allyl Alcohol Hydrogenation Method, 2022-2032F |
6.1.5 United Kingdom (UK) N-propanol Market Revenues & Volume, By Other Compounds Byproduct Method, 2022-2032F |
6.2 United Kingdom (UK) N-propanol Market, By Application |
6.2.1 Overview and Analysis |
6.2.2 United Kingdom (UK) N-propanol Market Revenues & Volume, By Coatings, 2022-2032F |
6.2.3 United Kingdom (UK) N-propanol Market Revenues & Volume, By Food Additive, 2022-2032F |
6.2.4 United Kingdom (UK) N-propanol Market Revenues & Volume, By Pharmaceutical, 2022-2032F |
6.2.5 United Kingdom (UK) N-propanol Market Revenues & Volume, By Cosmetics, 2022-2032F |
6.2.6 United Kingdom (UK) N-propanol Market Revenues & Volume, By Others, 2022-2032F |
7 United Kingdom (UK) N-propanol Market Import-Export Trade Statistics |
7.1 United Kingdom (UK) N-propanol Market Export to Major Countries |
7.2 United Kingdom (UK) N-propanol Market Imports from Major Countries |
8 United Kingdom (UK) N-propanol Market Key Performance Indicators |
8.1 Research and development investment in new applications and formulations of n-propanol. |
8.2 Adoption rate of eco-friendly manufacturing practices in the production of n-propanol. |
8.3 Number of partnerships or collaborations for expanding distribution channels and market reach. |
9 United Kingdom (UK) N-propanol Market - Opportunity Assessment |
9.1 United Kingdom (UK) N-propanol Market Opportunity Assessment, By Type, 2022 & 2032F |
9.2 United Kingdom (UK) N-propanol Market Opportunity Assessment, By Application, 2022 & 2032F |
10 United Kingdom (UK) N-propanol Market - Competitive Landscape |
10.1 United Kingdom (UK) N-propanol Market Revenue Share, By Companies, 2025 |
10.2 United Kingdom (UK) N-propanol Market Competitive Benchmarking, By Operating and Technical Parameters |
11 Company Profiles |
12 Recommendations |
13 Disclaimer |
Global Go To Market Strategy - 2030
Export potential enables firms to identify high-growth global markets with greater confidence by combining advanced trade intelligence with a structured quantitative methodology. The framework analyzes emerging demand trends and country-level import patterns while integrating macroeconomic and trade datasets such as GDP and population forecasts, bilateral import–export flows, tariff structures, elasticity differentials between developed and developing economies, geographic distance, and import demand projections. Using weighted trade values from 2020–2024 as the base period to project country-to-country export potential for 2030, these inputs are operationalized through calculated drivers such as gravity model parameters, tariff impact factors, and projected GDP per-capita growth. Through an analysis of hidden potentials, demand hotspots, and market conditions that are most favorable to success, this method enables firms to focus on target countries, maximize returns, and global expansion with data, backed by accuracy.
By factoring in the projected importer demand gap that is currently unmet and could be potential opportunity, it identifies the potential for the Exporter (Country) among 190 countries, against the general trade analysis, which identifies the biggest importer or exporter.
To discover high-growth global markets and optimize your business strategy:
Click Here
Pricing
- Single User License$ 1,995
- Department License$ 2,400
- Site License$ 3,120
- Global License$ 3,795

Leadership Perspectives from Industry Events
Search
Thought Leadership and Analyst Meet


Our Clients
6WResearch In News
- India Air Conditioner Market Set for Strong Rebound in 2026 After Weather-Led Correction and GST-Driven Recovery: 6Wresearch
- ADAS in India: How Automatic Emergency Braking, Blind Spot Detection & Driver Monitoring are Transforming Road Safety
- Doha a strategic location for EV manufacturing hub: IPA Qatar
- Demand for luxury TVs surging in the GCC, says Samsung
- Empowering Growth: The Thriving Journey of Bangladesh’s Cable Industry
- Demand for luxury TVs surging in the GCC, says Samsung
Latest Reports
- Nicaragua RPG Gaming Market (2026-2032)
- New Zealand RPG Gaming Market (2026-2032)
- Netherlands RPG Gaming Market (2026-2032)
- Nauru RPG Gaming Market (2026-2032)
- Namibia RPG Gaming Market (2026-2032)
- Mozambique RPG Gaming Market (2026-2032)
- Montenegro RPG Gaming Market (2026-2032)
- Mongolia RPG Gaming Market (2026-2032)
- Monaco RPG Gaming Market (2026-2032)
- Micronesia RPG Gaming Market (2026-2032)
Industry Events and Analyst Meet

EV India Expo 2026

HIMTEX 2026

India Refining Summit 2026

India EV Show 2026

EV tech India Expo 2026
Whitepaper
- Middle East & Africa Commercial Security Market Click here to view more.
- Middle East & Africa Fire Safety Systems & Equipment Market Click here to view more.
- GCC Drone Market Click here to view more.
- Middle East Lighting Fixture Market Click here to view more.
- GCC Physical & Perimeter Security Market Click here to view more.