United States (US) Anthranilic Acid Market (2026-2032) Outlook | Size, Growth, Revenue, Analysis, Trends, Forecast, Value, Companies, Industry & Share
Market Forecast By Product (Pharmaceutical Grade, Industrial Grade), By Applications (Dye, Pharmaceutical, Others) And Competitive Landscape
| Product Code: ETC312541 | Publication Date: Aug 2022 | Updated Date: Jul 2026 | Product Type: Market Research Report | |
| Publisher: 6Wresearch | Author: Shubham Padhi | No. of Pages: 75 | No. of Figures: 35 | No. of Tables: 20 |
United States (US) Anthranilic Acid Market Size, Share & Growth Rate
The United States (US) Anthranilic Acid Market was estimated at USD 126 Million in 2025 and is projected to reach USD 147 Million by 2032, growing at a CAGR of 2.2% from 2026 to 2032. This growth trajectory is largely attributed to the burgeoning pharmaceutical sector, where anthranilic acid serves as a crucial precursor in the synthesis of various medications, particularly anti-inflammatory and anti-hypertensive drugs. Coupled with increasing agricultural activities and rising R&D investments, the demand for anthranilic acid is expected to steadily escalate in the coming years.
United States (US) Anthranilic Acid Market Year-wise Growth Rate and Key Drivers
This graph highlights how the United States (US) Anthranilic Acid Market has steadily grown over the years, supported by major growth factors.
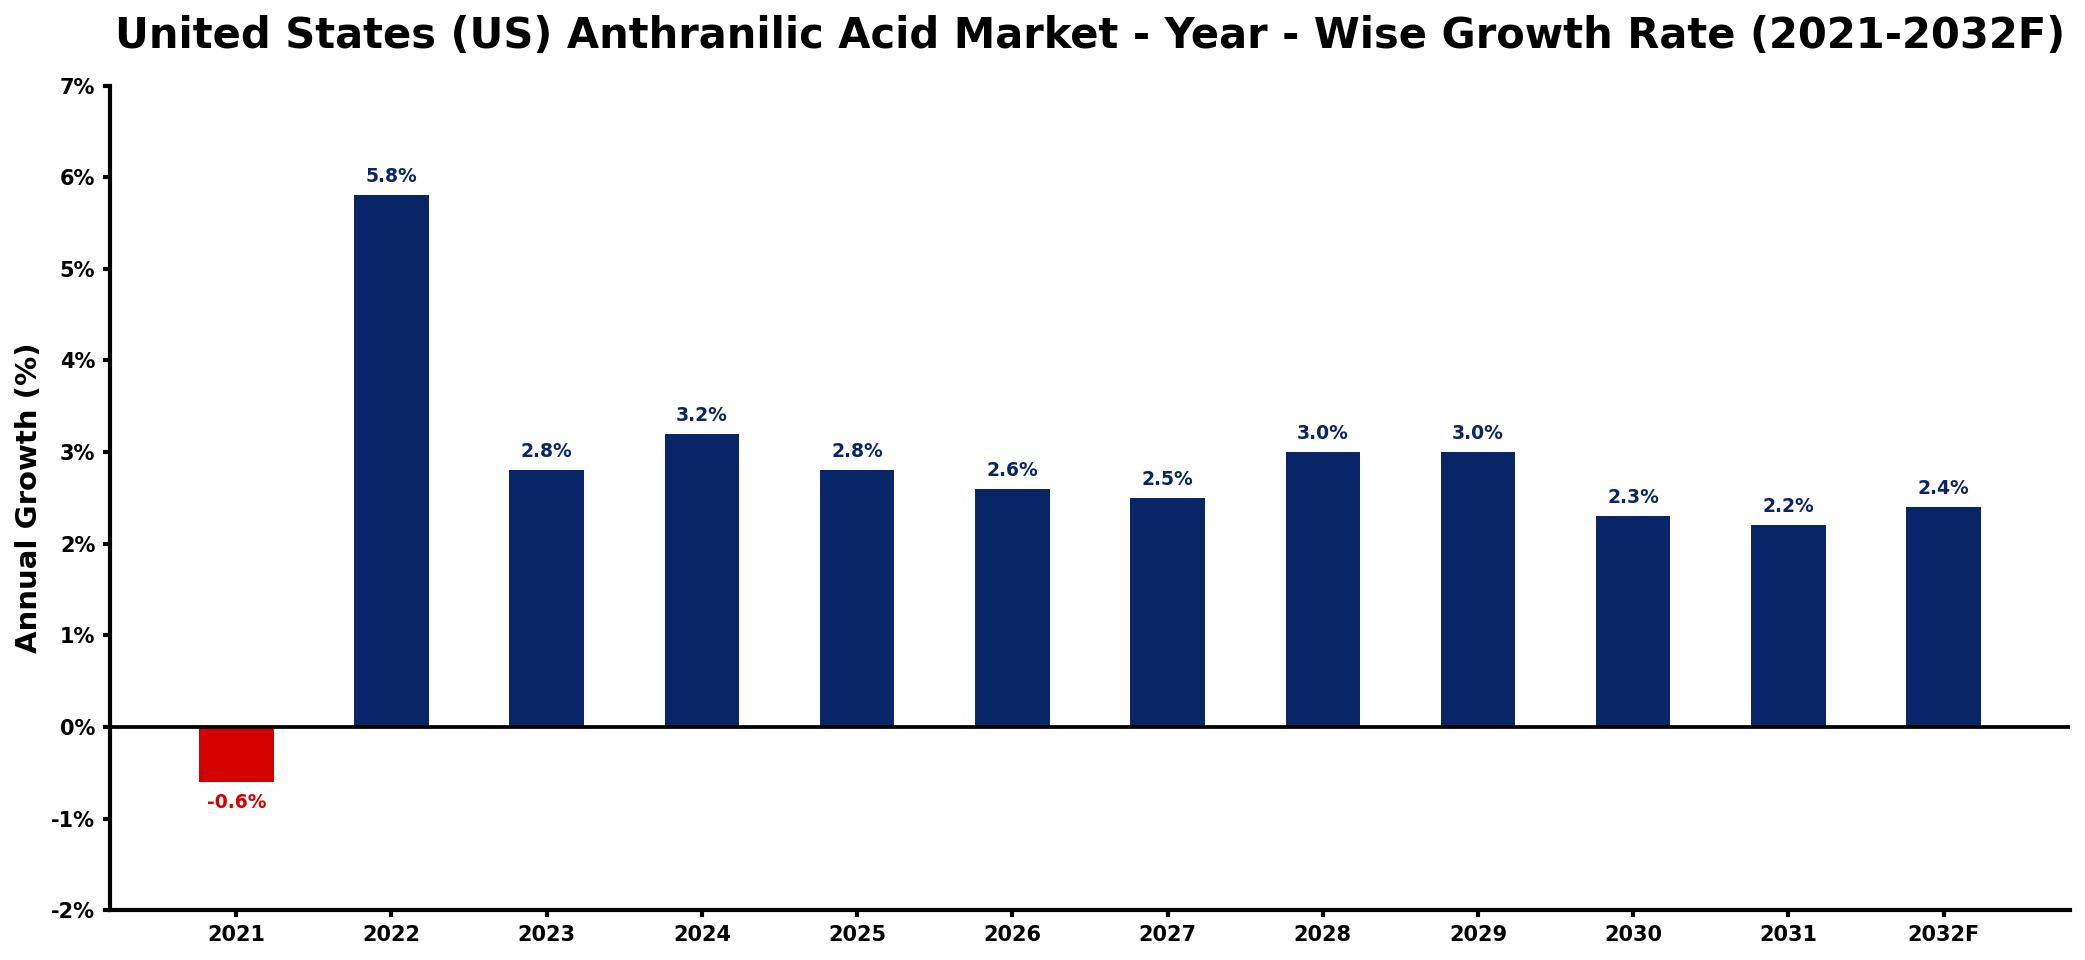
The table below presents the year‑wise growth rates along with the key drivers influencing the market
| Year | Growth Rate | Major Drivers |
| 2021 | -0.6% | Decreased demand from manufacturing sector |
| 2022 | 5.8% | Increased investment in specialty chemicals |
| 2023 | 2.8% | Expansion of pharmaceutical applications market |
| 2024 | 3.2% | Growth in agrochemical sector usage |
| 2025 | 2.8% | Rise in consumer health products |
| 2026 | 2.6% | Emergence of new industrial applications |
| 2027 | 2.5% | Increased focus on sustainable practices |
| 2028 | 3.0% | Development of innovative formulations |
| 2029 | 3.0% | Rising demand from food industry |
| 2030 | 2.3% | Growing popularity of natural ingredients |
| 2031 | 2.2% | Strengthened regulatory support initiatives |
| 2032 | 2.4% | increased production capacity utilization |
Note: Market size estimations and growth projections presented in this report are based on 6Wresearch's proprietary forecasting methodology, utilizing the latest available industry data, government publications, and primary research inputs.
United States (US) Anthranilic Acid Market Synopsis
The driving force behind the US Anthranilic Acid market is the pharmaceutical industry's expanding footprint. With a heightened focus on developing new medications, the reliance on anthranilic acid as a key ingredient in various therapeutic products is more pronounced than ever. This trend is further bolstered by a growing interest in environmentally friendly chemicals, which positions anthranilic acid favorably as a bio-based chemical.
In addition to pharmaceuticals, the utilization of anthranilic acid in agrochemicals and dyes is enhancing its market appeal. The agricultural sector's increasing demand for effective pesticides and herbicides, paired with the ongoing evolution of dye production techniques, further stimulates the market's growth potential. Despite facing challenges such as regulatory hurdles, the market is adapting dynamically.
United States (US) Anthranilic Acid Market Key Takeaways
- Robust growth driven by demand from pharmaceuticals, agrochemicals, and dyes.
- Anthranilic acid is critical for producing a variety of medications, including analgesics and anti-inflammatory drugs.
- Increased focus on sustainable and bio-based chemical practices is shaping market dynamics.
- Investment in R&D is essential for companies to maintain competitiveness and product innovation.
- Regulatory compliance remains crucial, given environmental and safety standards.
Evaluation of Restraints in United States (US) Anthranilic Acid Market
While the US Anthranilic Acid market exhibits positive growth prospects, several restraints could inhibit its advancement. Notably, fluctuating raw material prices pose a significant threat, impacting production costs and profitability. Additionally, the presence of alternative chemicals that can perform similar functions raises competitive pressures. Regulatory complexities, particularly concerning environmental safety and compliance, add further challenges that companies must navigate to sustain their market position.
United States (US) Anthranilic Acid Market Trends
Current trends in the US Anthranilic Acid market highlight a shift towards sustainable practices and eco-friendly products. An increasing number of manufacturers are investing in innovative production techniques aimed at reducing environmental impact, thereby enhancing the attractiveness of anthranilic acid as a sustainable solution. Furthermore, advancements in pharmaceutical formulations that leverage anthranilic acid for new therapeutic applications are driving a continuous evolution in market demand.
United States (US) Anthranilic Acid Market Opportunities
The US Anthranilic Acid market presents a wealth of investment opportunities, particularly in the pharmaceuticals and agrochemicals sectors. The aging population and increasing healthcare expenditures are stimulating demand for new pharmaceutical products, creating a robust environment for anthranilic acid as an essential ingredient. Additionally, the agricultural sector's growth and focus on crop protection provide fertile ground for further applications of anthranilic acid in pesticide production. Investors can leverage these trends by strategically positioning their products and services within this expanding landscape.
Government Initiatives in the United States (US) Anthranilic Acid Market
While there are no specific policies targeting the Anthranilic Acid Market in the US, it operates under the broader framework of regulations established by agencies like the Environmental Protection Agency (EPA) and the Food and Drug Administration (FDA). These regulations are designed to ensure product safety and environmental protection, compelling companies to comply with strict standards in chemical manufacturing and labeling. Furthermore, public spending and incentives directed towards research and development in sustainable chemicals contribute positively to the market's growth environment.
Future Insights of the United States (US) Anthranilic Acid Market
Looking ahead to 2026-2032, the US Anthranilic Acid market is well-positioned for growth, driven primarily by its expanding applications in the pharmaceutical, agrochemical, and dye industries. The pharmaceutical sector's ongoing demand for innovative medications, particularly anti-inflammatory and anti-microbial drugs, is a substantial growth driver. Moreover, as agricultural practices evolve and sustainability becomes paramount, the role of anthranilic acid in producing eco-friendly pesticides and dyes is expected to gain further traction, ensuring the market's resilient expansion.
United States (US) Anthranilic Acid Market Latest Developments (2025 - 2026)
Recent developments in the US Anthranilic Acid market indicate a strong momentum towards innovation and sustainability. Companies are increasingly focusing on research initiatives aimed at enhancing the quality and functionality of anthranilic acid. There is also a noticeable shift towards the use of greener production methods, reflecting a broader trend within the chemicals industry to prioritize environmental responsibility. As these changes continue to unfold, the market is likely to see evolving applications and heightened competitive dynamics.
United States (US) Anthranilic Acid Market - Key Attractiveness of the Report
- 10 Years of Market Numbers
- Historical Data Starting from 2022 to 2025
- Base Year: 2025
- Forecast Data until 2032
- Key Performance Indicators Impacting the Market
- Major Upcoming Developments and Projects
Key Highlights of the Report:
- United States (US) Anthranilic Acid Market Outlook
- Market Size of United States (US) Anthranilic Acid Market, 2025
- Forecast of United States (US) Anthranilic Acid Market, 2032
- Historical Data and Forecast of United States (US) Anthranilic Acid Revenues & Volume for the Period 2022-2032F
- United States (US) Anthranilic Acid Market Trend Evolution
- United States (US) Anthranilic Acid Market Drivers and Challenges
- United States (US) Anthranilic Acid Price Trends
- United States (US) Anthranilic Acid Porter's Five Forces
- United States (US) Anthranilic Acid Industry Life Cycle
- Historical Data and Forecast of United States (US) Anthranilic Acid Market Revenues & Volume By Product for the Period 2022-2032F
- Historical Data and Forecast of United States (US) Anthranilic Acid Market Revenues & Volume By Pharmaceutical Grade for the Period 2022-2032F
- Historical Data and Forecast of United States (US) Anthranilic Acid Market Revenues & Volume By Industrial Grade for the Period 2022-2032F
- Historical Data and Forecast of United States (US) Anthranilic Acid Market Revenues & Volume By Applications for the Period 2022-2032F
- Historical Data and Forecast of United States (US) Anthranilic Acid Market Revenues & Volume By Dye for the Period 2022-2032F
- Historical Data and Forecast of United States (US) Anthranilic Acid Market Revenues & Volume By Pharmaceutical for the Period 2022-2032F
- Historical Data and Forecast of United States (US) Anthranilic Acid Market Revenues & Volume By Others for the Period 2022-2032F
- United States (US) Anthranilic Acid Import Export Trade Statistics
- Market Opportunity Assessment By Product
- Market Opportunity Assessment By Applications
- United States (US) Anthranilic Acid Top Companies Market Share
- United States (US) Anthranilic Acid Competitive Benchmarking By Technical and Operational Parameters
- United States (US) Anthranilic Acid Company Profiles
- United States (US) Anthranilic Acid Key Strategic Recommendations
Frequently Asked Questions About the Market Study (FAQs):
The primary drivers include the rising demand from the pharmaceutical sector for drug production, increasing agricultural activities, and a focus on sustainable practices in chemical manufacturing.
The market is projected to grow from USD 126 Million in 2025 to USD 147 Million by 2032, reflecting a CAGR of 2.2% from 2026 to 2032.
Companies must navigate a complex regulatory landscape governed by the EPA and FDA, which mandates stringent safety and environmental standards for chemical manufacturing.
Anthranilic acid is predominantly used in pharmaceuticals, particularly in the production of anti-inflammatory and anti-hypertensive medications, as well as in agrochemicals and dyes.
There is an increasing emphasis on sustainable production methods, which enhances the market's appeal as anthranilic acid is recognized as a bio-based chemical solution.
6Wresearch actively monitors the United States (US) Anthranilic Acid Market and publishes its comprehensive annual report, highlighting emerging trends, growth drivers, revenue analysis, and forecast outlook. Our insights help businesses to make data-backed strategic decisions with ongoing market dynamics. Our analysts track relevent industries related to the United States (US) Anthranilic Acid Market, allowing our clients with actionable intelligence and reliable forecasts tailored to emerging regional needs.
Yes, we provide customisation as per your requirements. To learn more, feel free to contact us on sales@6wresearch.com
1 Executive Summary |
2 Introduction |
2.1 Key Highlights of the Report |
2.2 Report Description |
2.3 Market Scope & Segmentation |
2.4 Research Methodology |
2.5 Assumptions |
3 United States (US) Anthranilic Acid Market Overview |
3.1 United States (US) Country Macro Economic Indicators |
3.2 United States (US) Anthranilic Acid Market Revenues & Volume, 2022 & 2032F |
3.3 United States (US) Anthranilic Acid Market - Industry Life Cycle |
3.4 United States (US) Anthranilic Acid Market - Porter's Five Forces |
3.5 United States (US) Anthranilic Acid Market Revenues & Volume Share, By Product, 2022 & 2032F |
3.6 United States (US) Anthranilic Acid Market Revenues & Volume Share, By Applications, 2022 & 2032F |
4 United States (US) Anthranilic Acid Market Dynamics |
4.1 Impact Analysis |
4.2 Market Drivers |
4.2.1 Increasing demand for anthranilic acid in the pharmaceutical industry for the production of various drugs |
4.2.2 Growth in the agrochemical sector, where anthranilic acid is used as a key intermediate in the production of pesticides |
4.2.3 Rising research and development activities for the development of new applications for anthranilic acid |
4.3 Market Restraints |
4.3.1 Fluctuating prices of raw materials used in the production of anthranilic acid |
4.3.2 Stringent regulations related to the handling and disposal of anthranilic acid, impacting production costs |
4.3.3 Competition from alternative chemical compounds that can serve similar purposes in various industries |
5 United States (US) Anthranilic Acid Market Trends |
6 United States (US) Anthranilic Acid Market, By Types |
6.1 United States (US) Anthranilic Acid Market, By Product |
6.1.1 Overview and Analysis |
6.1.2 United States (US) Anthranilic Acid Market Revenues & Volume, By Product, 2022-2032F |
6.1.3 United States (US) Anthranilic Acid Market Revenues & Volume, By Pharmaceutical Grade, 2022-2032F |
6.1.4 United States (US) Anthranilic Acid Market Revenues & Volume, By Industrial Grade, 2022-2032F |
6.2 United States (US) Anthranilic Acid Market, By Applications |
6.2.1 Overview and Analysis |
6.2.2 United States (US) Anthranilic Acid Market Revenues & Volume, By Dye, 2022-2032F |
6.2.3 United States (US) Anthranilic Acid Market Revenues & Volume, By Pharmaceutical, 2022-2032F |
6.2.4 United States (US) Anthranilic Acid Market Revenues & Volume, By Others, 2022-2032F |
7 United States (US) Anthranilic Acid Market Import-Export Trade Statistics |
7.1 United States (US) Anthranilic Acid Market Export to Major Countries |
7.2 United States (US) Anthranilic Acid Market Imports from Major Countries |
8 United States (US) Anthranilic Acid Market Key Performance Indicators |
8.1 Research and development investment in anthranilic acid applications |
8.2 Number of new drug formulations utilizing anthranilic acid |
8.3 Adoption rate of anthranilic acid in emerging industries such as cosmetics and dyes. |
9 United States (US) Anthranilic Acid Market - Opportunity Assessment |
9.1 United States (US) Anthranilic Acid Market Opportunity Assessment, By Product, 2022 & 2032F |
9.2 United States (US) Anthranilic Acid Market Opportunity Assessment, By Applications, 2022 & 2032F |
10 United States (US) Anthranilic Acid Market - Competitive Landscape |
10.1 United States (US) Anthranilic Acid Market Revenue Share, By Companies, 2025 |
10.2 United States (US) Anthranilic Acid Market Competitive Benchmarking, By Operating and Technical Parameters |
11 Company Profiles |
12 Recommendations |
13 Disclaimer |
Global Go To Market Strategy - 2030
Export potential enables firms to identify high-growth global markets with greater confidence by combining advanced trade intelligence with a structured quantitative methodology. The framework analyzes emerging demand trends and country-level import patterns while integrating macroeconomic and trade datasets such as GDP and population forecasts, bilateral import–export flows, tariff structures, elasticity differentials between developed and developing economies, geographic distance, and import demand projections. Using weighted trade values from 2020–2024 as the base period to project country-to-country export potential for 2030, these inputs are operationalized through calculated drivers such as gravity model parameters, tariff impact factors, and projected GDP per-capita growth. Through an analysis of hidden potentials, demand hotspots, and market conditions that are most favorable to success, this method enables firms to focus on target countries, maximize returns, and global expansion with data, backed by accuracy.
By factoring in the projected importer demand gap that is currently unmet and could be potential opportunity, it identifies the potential for the Exporter (Country) among 190 countries, against the general trade analysis, which identifies the biggest importer or exporter.
To discover high-growth global markets and optimize your business strategy:
Click Here
Pricing
- Single User License$ 1,995
- Department License$ 2,400
- Site License$ 3,120
- Global License$ 3,795

Leadership Perspectives from Industry Events
Search
Thought Leadership and Analyst Meet


Our Clients
6WResearch In News
- India Air Conditioner Market Set for Strong Rebound in 2026 After Weather-Led Correction and GST-Driven Recovery: 6Wresearch
- ADAS in India: How Automatic Emergency Braking, Blind Spot Detection & Driver Monitoring are Transforming Road Safety
- Doha a strategic location for EV manufacturing hub: IPA Qatar
- Demand for luxury TVs surging in the GCC, says Samsung
- Empowering Growth: The Thriving Journey of Bangladesh’s Cable Industry
- Demand for luxury TVs surging in the GCC, says Samsung
Latest Reports
- Nicaragua RPG Gaming Market (2026-2032)
- New Zealand RPG Gaming Market (2026-2032)
- Netherlands RPG Gaming Market (2026-2032)
- Nauru RPG Gaming Market (2026-2032)
- Namibia RPG Gaming Market (2026-2032)
- Mozambique RPG Gaming Market (2026-2032)
- Montenegro RPG Gaming Market (2026-2032)
- Mongolia RPG Gaming Market (2026-2032)
- Monaco RPG Gaming Market (2026-2032)
- Micronesia RPG Gaming Market (2026-2032)
Industry Events and Analyst Meet

EV India Expo 2026

HIMTEX 2026

India Refining Summit 2026

India EV Show 2026

EV tech India Expo 2026
Whitepaper
- Middle East & Africa Commercial Security Market Click here to view more.
- Middle East & Africa Fire Safety Systems & Equipment Market Click here to view more.
- GCC Drone Market Click here to view more.
- Middle East Lighting Fixture Market Click here to view more.
- GCC Physical & Perimeter Security Market Click here to view more.