United States (US) Bolts Market (2026-2032) | Size, Trends, Revenue, Share, Outlook, Industry, Companies, Growth, Forecast, Analysis & Value
Market Forecast By Product (M6, M8, M10, M12, M14, M16, M18, Others), By Applications (Construction, Petrochemical, Heavy Machine Equipment, Automotive, Aerospace, Home Appliances, Lawn and Garden, Others), By Grade (GR 5.8, GR 8.8, GR10.9, GR 12.9, Others) And Competitive Landscape
| Product Code: ETC041022 | Publication Date: Jan 2021 | Updated Date: Mar 2026 | Product Type: Report | |
| Publisher: 6Wresearch | Author: Ravi Bhandari | No. of Pages: 70 | No. of Figures: 35 | No. of Tables: 5 |
United States Bolts Market Year-wise Growth Rate (2021-2031F)
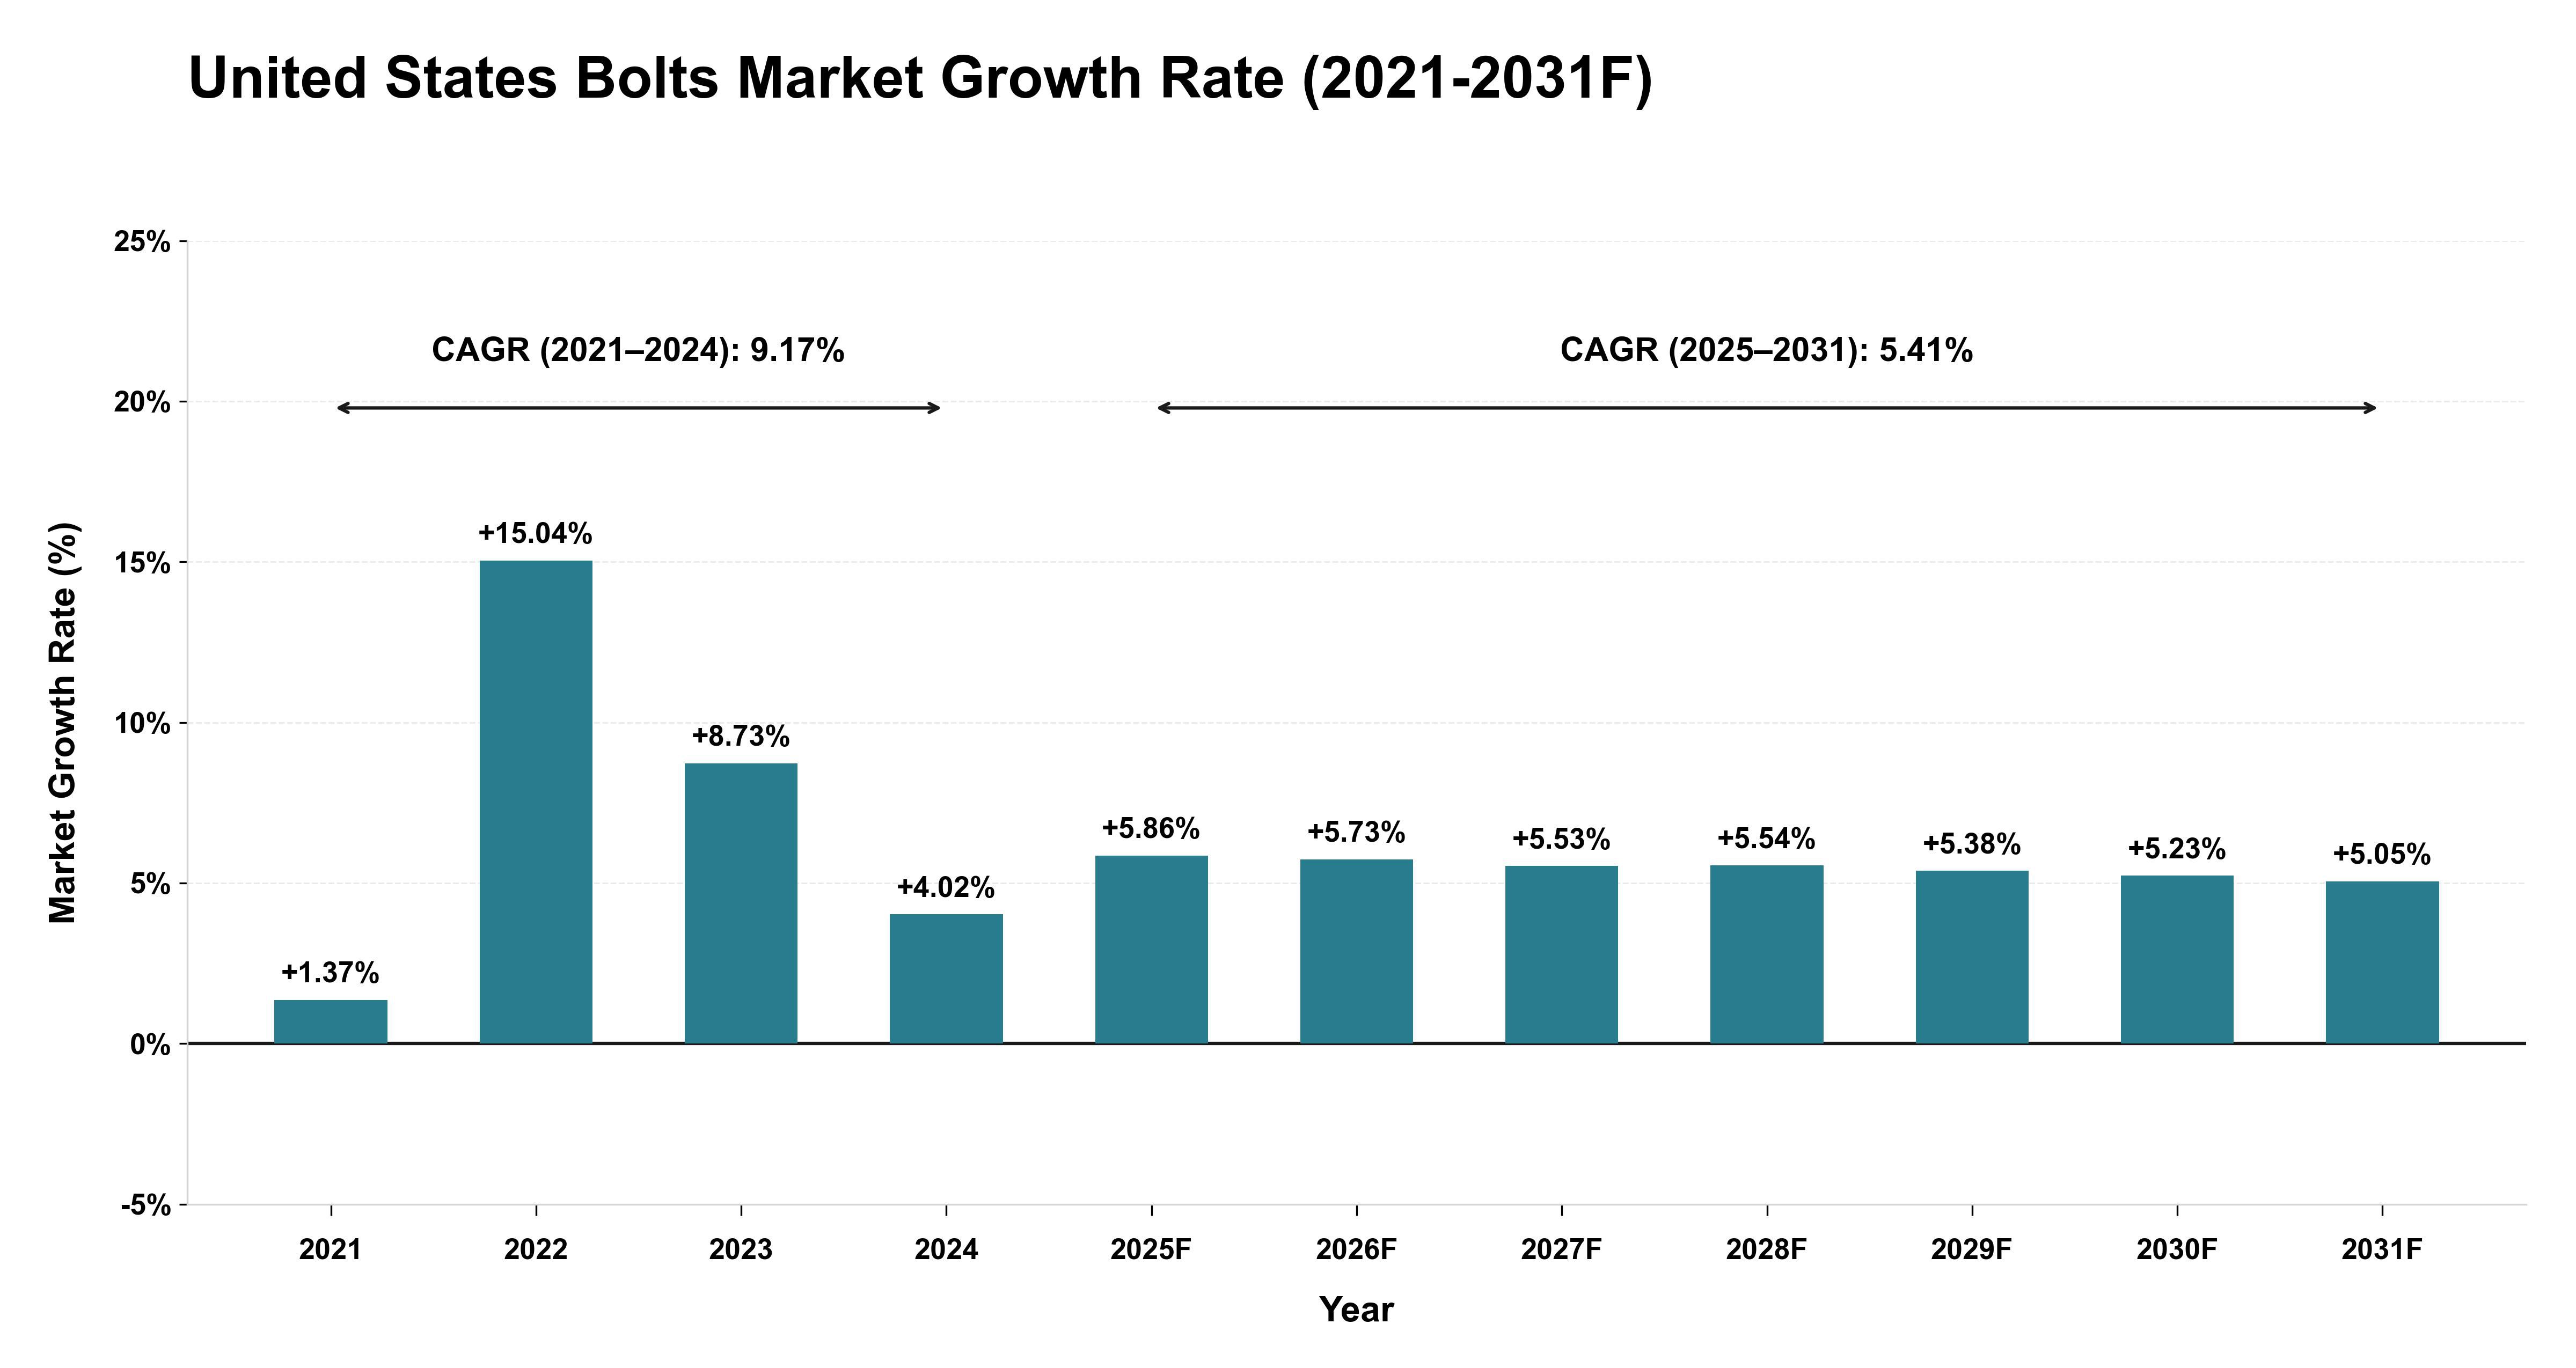
Over the historical period (2021-2024), the United States Bolts Market exhibited a robust growth trajectory with varying annual growth rates, starting with a modest increase in 2021 at 1.37% and peaking in 2022 with a significant surge of 15.04%, followed by steady growth in 2023 at 8.73%. However, the growth rate slightly decelerated in 2024 to 4.02%. This fluctuation can be attributed to fluctuations in construction activity, infrastructure projects, and manufacturing demands during this period. Looking ahead to the forecast period (2025-2031), the market is expected to maintain positive growth momentum, albeit at a slower pace, with an average CAGR of 5.41%. This moderation reflects a more stabilized market environment, where demand for bolts is likely to remain steady across industries, such as construction, automotive, and machinery, indicating a mature market with consistent but moderate growth potential driven by ongoing maintenance and replacement needs rather than new large-scale projects.
Key Highlights of the Report:
- United States (US) Bolts Market Outlook
- Market Size of United States (US) Bolts Market, 2025
- Forecast of United States (US) Bolts Market, 2032
- Historical Data and Forecast of United States (US) Bolts Revenues & Volume for the Period 2022 - 2032F
- United States (US) Bolts Market Trend Evolution
- United States (US) Bolts Market Drivers and Challenges
- United States (US) Bolts Price Trends
- United States (US) Bolts Porter's Five Forces
- United States (US) Bolts Industry Life Cycle
- Historical Data and Forecast of United States (US) Bolts Market Revenues & Volume By Product for the Period 2022 - 2032F
- Historical Data and Forecast of United States (US) Bolts Market Revenues & Volume By M6 for the Period 2022 - 2032F
- Historical Data and Forecast of United States (US) Bolts Market Revenues & Volume By M8 for the Period 2022 - 2032F
- Historical Data and Forecast of United States (US) Bolts Market Revenues & Volume By M10 for the Period 2022 - 2032F
- Historical Data and Forecast of United States (US) Bolts Market Revenues & Volume By M12 for the Period 2022 - 2032F
- Historical Data and Forecast of United States (US) Bolts Market Revenues & Volume By M14 for the Period 2022 - 2032F
- Historical Data and Forecast of United States (US) Bolts Market Revenues & Volume By M16 for the Period 2022 - 2032F
- Historical Data and Forecast of United States (US) Bolts Market Revenues & Volume By M18 for the Period 2022 - 2032F
- Historical Data and Forecast of United States (US) M6 Bolts Market Revenues & Volume By Others for the Period 2022 - 2032F
- Historical Data and Forecast of United States (US) Bolts Market Revenues & Volume By Applications for the Period 2022 - 2032F
- Historical Data and Forecast of United States (US) Bolts Market Revenues & Volume By Construction for the Period 2022 - 2032F
- Historical Data and Forecast of United States (US) Bolts Market Revenues & Volume By Petrochemical for the Period 2022 - 2032F
- Historical Data and Forecast of United States (US) Bolts Market Revenues & Volume By Heavy Machine Equipment for the Period 2022 - 2032F
- Historical Data and Forecast of United States (US) Bolts Market Revenues & Volume By Automotive for the Period 2022 - 2032F
- Historical Data and Forecast of United States (US) Bolts Market Revenues & Volume By Aerospace for the Period 2022 - 2032F
- Historical Data and Forecast of United States (US) Bolts Market Revenues & Volume By Home Appliances for the Period 2022 - 2032F
- Historical Data and Forecast of United States (US) Bolts Market Revenues & Volume By Lawn and Garden for the Period 2022 - 2032F
- Historical Data and Forecast of United States (US) Bolts Market Revenues & Volume By Others for the Period 2022 - 2032F
- Historical Data and Forecast of United States (US) Bolts Market Revenues & Volume By Grade for the Period 2022 - 2032F
- Historical Data and Forecast of United States (US) Bolts Market Revenues & Volume By GR 5.8 for the Period 2022 - 2032F
- Historical Data and Forecast of United States (US) Bolts Market Revenues & Volume By GR 8.8 for the Period 2022 - 2032F
- Historical Data and Forecast of United States (US) Bolts Market Revenues & Volume By GR10.9 for the Period 2022 - 2032F
- Historical Data and Forecast of United States (US) Bolts Market Revenues & Volume By GR 12.9 for the Period 2022 - 2032F
- Historical Data and Forecast of United States (US) Bolts Market Revenues & Volume By Others for the Period 2022 - 2032F
- United States (US) Bolts Import Export Trade Statistics
- Market Opportunity Assessment By Product
- Market Opportunity Assessment By Applications
- Market Opportunity Assessment By Grade
- United States (US) Bolts Top Companies Market Share
- United States (US) Bolts Competitive Benchmarking By Technical and Operational Parameters
- United States (US) Bolts Company Profiles
- United States (US) Bolts Key Strategic Recommendations
Frequently Asked Questions About the Market Study (FAQs):
6Wresearch actively monitors the United States (US) Bolts Market and publishes its comprehensive annual report, highlighting emerging trends, growth drivers, revenue analysis, and forecast outlook. Our insights help businesses to make data-backed strategic decisions with ongoing market dynamics. Our analysts track relevent industries related to the United States (US) Bolts Market, allowing our clients with actionable intelligence and reliable forecasts tailored to emerging regional needs.
Yes, we provide customisation as per your requirements. To learn more, feel free to contact us on sales@6wresearch.com
1 Executive Summary |
2 Introduction |
2.1 Key Highlights of the Report |
2.2 Report Description |
2.3 Market Scope & Segmentation |
2.4 Research Methodology |
2.5 Assumptions |
3 United States (US) Bolts Market Overview |
3.1 United States (US) Country Macro Economic Indicators |
3.2 United States (US) Bolts Market Revenues & Volume, 2022 & 2032F |
3.3 United States (US) Bolts Market - Industry Life Cycle |
3.4 United States (US) Bolts Market - Porter's Five Forces |
3.5 United States (US) Bolts Market Revenues & Volume Share, By Product, 2022 & 2032F |
3.6 United States (US) Bolts Market Revenues & Volume Share, By Applications, 2022 & 2032F |
3.7 United States (US) Bolts Market Revenues & Volume Share, By Grade, 2022 & 2032F |
4 United States (US) Bolts Market Dynamics |
4.1 Impact Analysis |
4.2 Market Drivers |
4.2.1 Increasing construction and infrastructure development projects in the US |
4.2.2 Growth in automotive and aerospace industries driving demand for bolts |
4.2.3 Rising adoption of energy-efficient technologies leading to increased demand for specialized bolts |
4.3 Market Restraints |
4.3.1 Fluctuating raw material prices impacting production costs |
4.3.2 Intense competition among bolt manufacturers leading to pricing pressures |
4.3.3 Volatility in global trade policies affecting import/export of bolts |
5 United States (US) Bolts Market Trends |
6 United States (US) Bolts Market, By Types |
6.1 United States (US) Bolts Market, By Product |
6.1.1 Overview and Analysis |
6.1.2 United States (US) Bolts Market Revenues & Volume, By Product, 2022 - 2032F |
6.1.3 United States (US) Bolts Market Revenues & Volume, By M6, 2022 - 2032F |
6.1.4 United States (US) Bolts Market Revenues & Volume, By M8, 2022 - 2032F |
6.1.5 United States (US) Bolts Market Revenues & Volume, By M10, 2022 - 2032F |
6.1.6 United States (US) Bolts Market Revenues & Volume, By M12, 2022 - 2032F |
6.1.7 United States (US) Bolts Market Revenues & Volume, By M14, 2022 - 2032F |
6.1.8 United States (US) Bolts Market Revenues & Volume, By M16, 2022 - 2032F |
6.1.9 United States (US) Bolts Market Revenues & Volume, By Others, 2022 - 2032F |
6.1.10 United States (US) Bolts Market Revenues & Volume, By Others, 2022 - 2032F |
6.2 United States (US) Bolts Market, By Applications |
6.2.1 Overview and Analysis |
6.2.2 United States (US) Bolts Market Revenues & Volume, By Construction, 2022 - 2032F |
6.2.3 United States (US) Bolts Market Revenues & Volume, By Petrochemical, 2022 - 2032F |
6.2.4 United States (US) Bolts Market Revenues & Volume, By Heavy Machine Equipment, 2022 - 2032F |
6.2.5 United States (US) Bolts Market Revenues & Volume, By Automotive, 2022 - 2032F |
6.2.6 United States (US) Bolts Market Revenues & Volume, By Aerospace, 2022 - 2032F |
6.2.7 United States (US) Bolts Market Revenues & Volume, By Home Appliances, 2022 - 2032F |
6.2.8 United States (US) Bolts Market Revenues & Volume, By Others, 2022 - 2032F |
6.2.9 United States (US) Bolts Market Revenues & Volume, By Others, 2022 - 2032F |
6.3 United States (US) Bolts Market, By Grade |
6.3.1 Overview and Analysis |
6.3.2 United States (US) Bolts Market Revenues & Volume, By GR 5.8, 2022 - 2032F |
6.3.3 United States (US) Bolts Market Revenues & Volume, By GR 8.8, 2022 - 2032F |
6.3.4 United States (US) Bolts Market Revenues & Volume, By GR10.9, 2022 - 2032F |
6.3.5 United States (US) Bolts Market Revenues & Volume, By GR 12.9, 2022 - 2032F |
6.3.6 United States (US) Bolts Market Revenues & Volume, By Others, 2022 - 2032F |
7 United States (US) Bolts Market Import-Export Trade Statistics |
7.1 United States (US) Bolts Market Export to Major Countries |
7.2 United States (US) Bolts Market Imports from Major Countries |
8 United States (US) Bolts Market Key Performance Indicators |
8.1 Average lead time for bolt production and delivery |
8.2 Percentage of revenue from new product innovations |
8.3 Customer satisfaction index for bolt quality and performance |
8.4 Percentage of revenue from repeat customers |
8.5 Rate of adoption of sustainable practices in bolt manufacturing |
9 United States (US) Bolts Market - Opportunity Assessment |
9.1 United States (US) Bolts Market Opportunity Assessment, By Product, 2022 & 2032F |
9.2 United States (US) Bolts Market Opportunity Assessment, By Applications, 2022 & 2032F |
9.3 United States (US) Bolts Market Opportunity Assessment, By Grade, 2022 & 2032F |
10 United States (US) Bolts Market - Competitive Landscape |
10.1 United States (US) Bolts Market Revenue Share, By Companies, 2025 |
10.2 United States (US) Bolts Market Competitive Benchmarking, By Operating and Technical Parameters |
11 Company Profiles |
12 Recommendations |
13 Disclaimer |
Global Go To Market Strategy - 2030
Export potential enables firms to identify high-growth global markets with greater confidence by combining advanced trade intelligence with a structured quantitative methodology. The framework analyzes emerging demand trends and country-level import patterns while integrating macroeconomic and trade datasets such as GDP and population forecasts, bilateral import–export flows, tariff structures, elasticity differentials between developed and developing economies, geographic distance, and import demand projections. Using weighted trade values from 2020–2024 as the base period to project country-to-country export potential for 2030, these inputs are operationalized through calculated drivers such as gravity model parameters, tariff impact factors, and projected GDP per-capita growth. Through an analysis of hidden potentials, demand hotspots, and market conditions that are most favorable to success, this method enables firms to focus on target countries, maximize returns, and global expansion with data, backed by accuracy.
By factoring in the projected importer demand gap that is currently unmet and could be potential opportunity, it identifies the potential for the Exporter (Country) among 190 countries, against the general trade analysis, which identifies the biggest importer or exporter.
To discover high-growth global markets and optimize your business strategy:
Click Here
Pricing
- Single User License$ 1,995
- Department License$ 2,400
- Site License$ 3,120
- Global License$ 3,795

Leadership Perspectives from Industry Events
Search
Thought Leadership and Analyst Meet


Our Clients
6WResearch In News
- India Air Conditioner Market Set for Strong Rebound in 2026 After Weather-Led Correction and GST-Driven Recovery: 6Wresearch
- ADAS in India: How Automatic Emergency Braking, Blind Spot Detection & Driver Monitoring are Transforming Road Safety
- Doha a strategic location for EV manufacturing hub: IPA Qatar
- Demand for luxury TVs surging in the GCC, says Samsung
- Empowering Growth: The Thriving Journey of Bangladesh’s Cable Industry
- Demand for luxury TVs surging in the GCC, says Samsung
Latest Reports
- Nicaragua RPG Gaming Market (2026-2032)
- New Zealand RPG Gaming Market (2026-2032)
- Netherlands RPG Gaming Market (2026-2032)
- Nauru RPG Gaming Market (2026-2032)
- Namibia RPG Gaming Market (2026-2032)
- Mozambique RPG Gaming Market (2026-2032)
- Montenegro RPG Gaming Market (2026-2032)
- Mongolia RPG Gaming Market (2026-2032)
- Monaco RPG Gaming Market (2026-2032)
- Micronesia RPG Gaming Market (2026-2032)
Industry Events and Analyst Meet

EV India Expo 2026

HIMTEX 2026

India Refining Summit 2026

India EV Show 2026

EV tech India Expo 2026
Whitepaper
- Middle East & Africa Commercial Security Market Click here to view more.
- Middle East & Africa Fire Safety Systems & Equipment Market Click here to view more.
- GCC Drone Market Click here to view more.
- Middle East Lighting Fixture Market Click here to view more.
- GCC Physical & Perimeter Security Market Click here to view more.