United States (US) Digital Photo Frame Market (2026-2032) | Industry, Trends, Growth, Outlook, Revenue, Companies, Value, Size, Share, Forecast & Analysis
Market Forecast By Product Type (Pan Touch Control Frame, Remote Control Frame), By Size (Standard Frame (4:3), Widescreen Frame (16:9)), By Inch (Up to 7, Between 7 to 15, Above 15), By Power Source (Electricity Power Source, Battery Power Source), By Application (Residential, Commercial) And Competitive Landscape
| Product Code: ETC012321 | Publication Date: Oct 2020 | Updated Date: Jun 2026 | Product Type: Report | |
| Publisher: 6Wresearch | Author: Bhawna Singh | No. of Pages: 70 | No. of Figures: 35 | No. of Tables: 5 |
United States (US) Digital Photo Frame Market Summary
The united states (us) digital photo frame market was estimated at USD 226 Million in 2025 and is projected to reach USD 265 Million by 2032, growing at a CAGR of 2.9% from 2026 to 2032.
United States (US) Digital Photo Frame Market Year-wise Growth Rate and Key Drivers
This graph highlights how the United States (US) Digital Photo Frame Market has steadily grown over the past five years, supported by major growth factors.
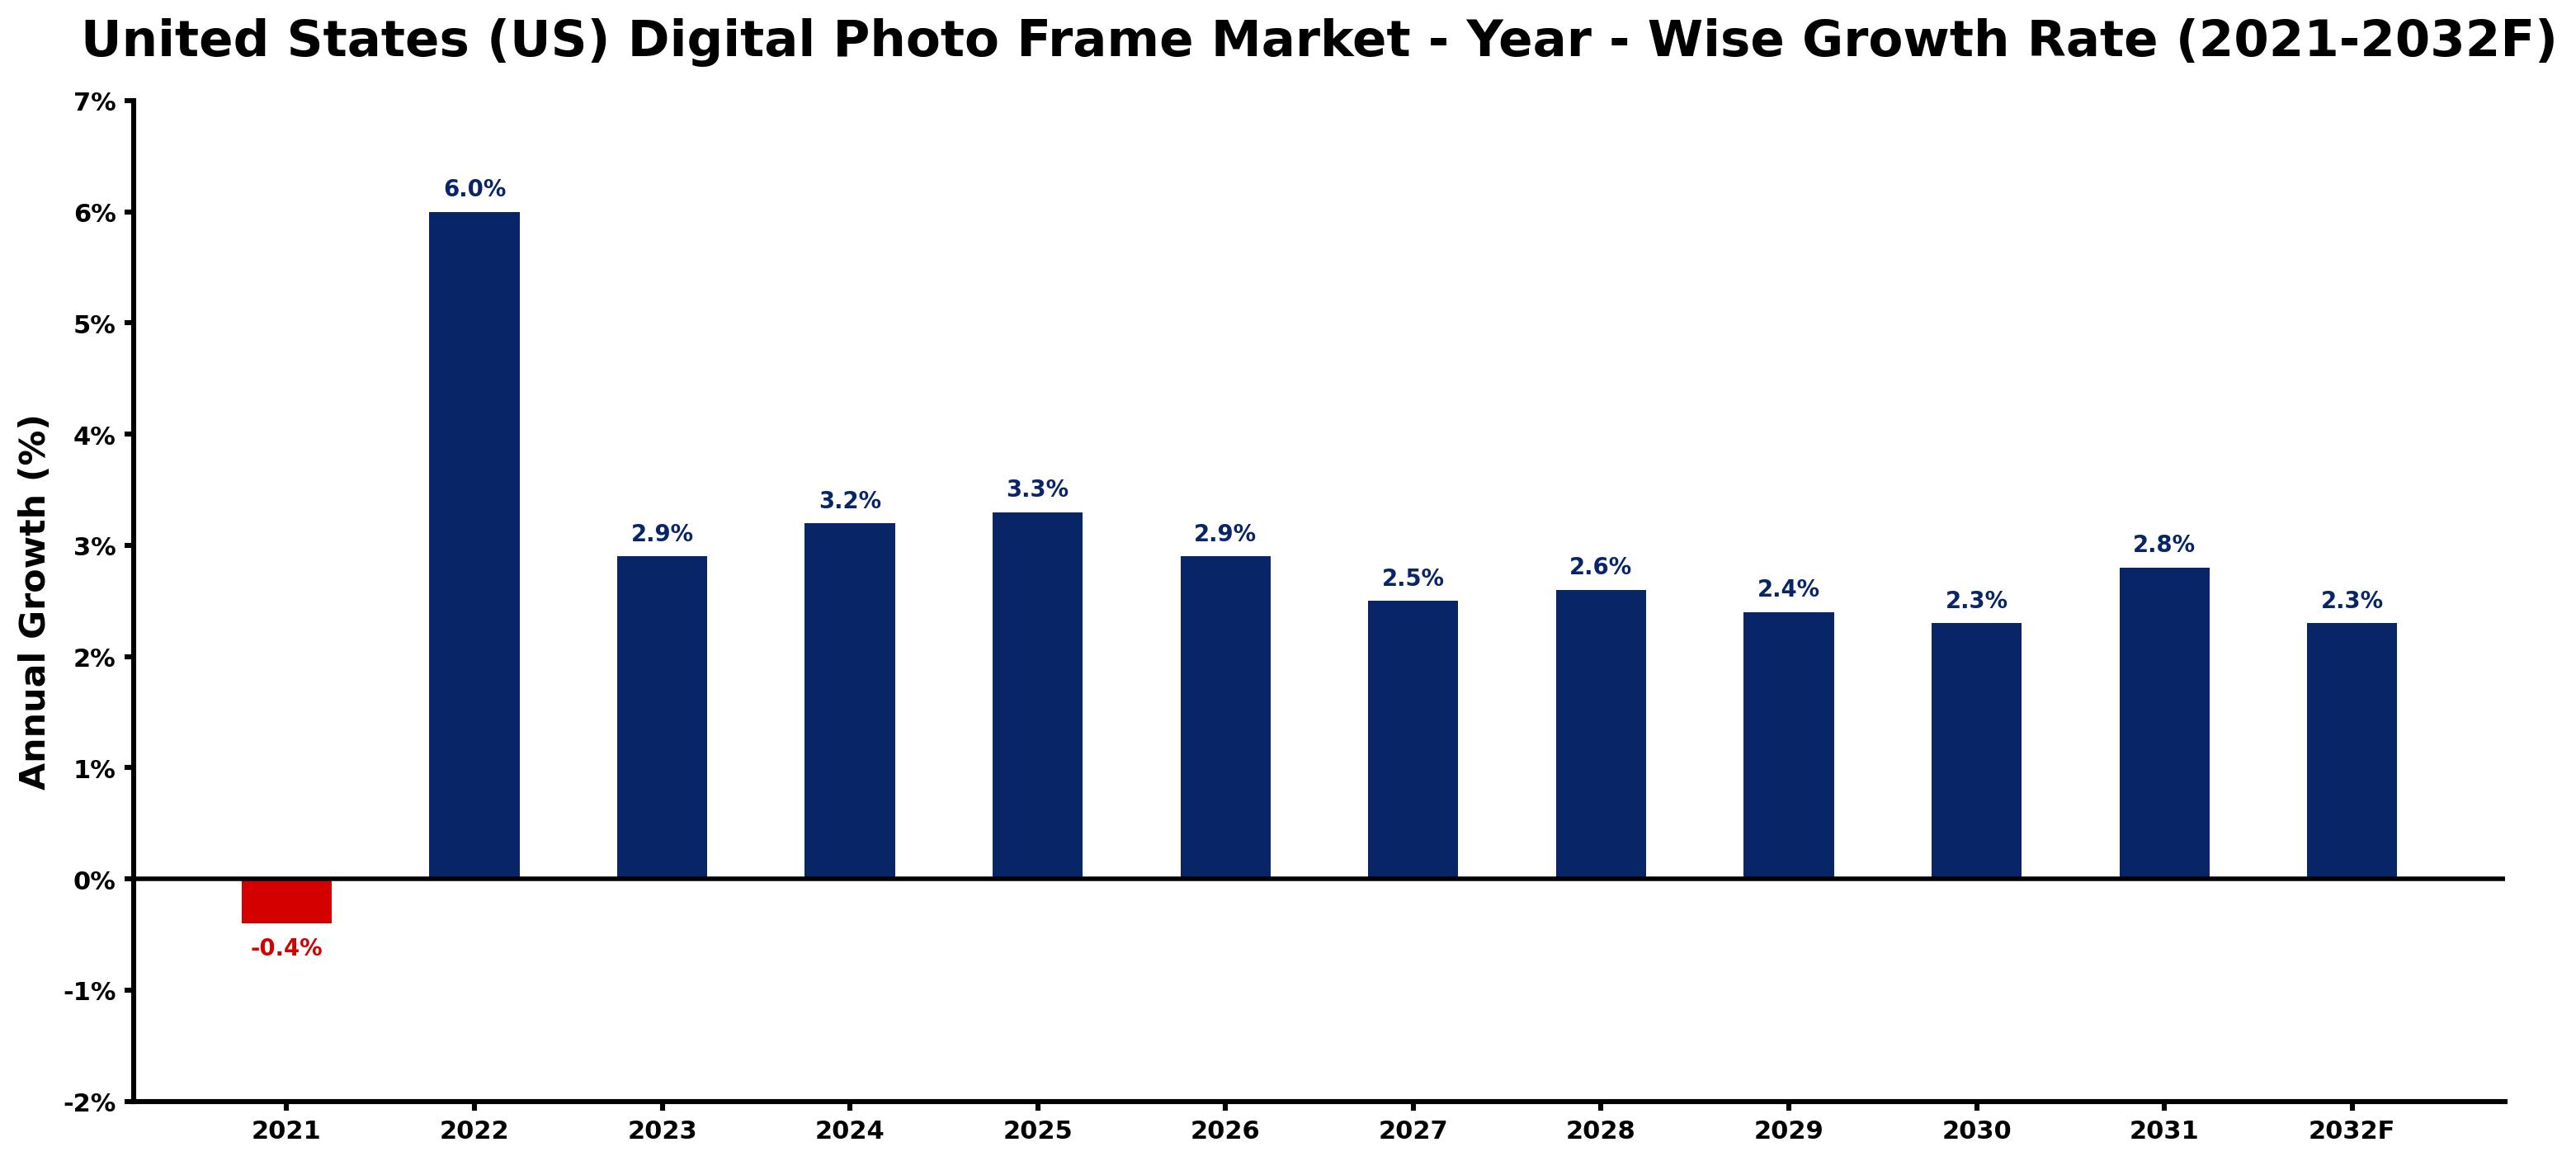
The table below presents the year wise growth rates along with the key drivers influencing the market
| Year | Growth Rate | Major Drivers |
| 2021 | -0.4% | Oversaturation of digital photo frame options led to market fatigue, diminishing consumer interest and sales. |
| 2022 | 6.0% | Social media usage flourished, amplifying the desire for physical photo displays. |
| 2023 | 2.9% | Technological improvements led to enhanced display quality and user-friendly interfaces. |
| 2024 | 3.2% | Consumer preferences shifted towards multifunctional digital devices, integrating more features. |
| 2025 | 3.3% | E-commerce expansion facilitated easier access to a variety of digital photo frames. |
| 2026 | 2.9% | Collaborations between tech companies and artists offered unique content for users. |
| 2027 | 2.5% | Aging demographics expressed interest in digital frames for family photo sharing. |
| 2028 | 2.6% | Sustainable manufacturing practices began appealing to environmentally conscious consumers. |
| 2029 | 2.4% | Home décor trends increasingly incorporated digital solutions, blending art and technology. |
| 2030 | 2.3% | Integration with smart home systems allowed seamless control of digital photo frames. |
| 2031 | 2.8% | Virtual reality experiences drove interest in immersive photo display options. |
| 2032 | 2.3% | Global travel and adventure sharing spurred a surge in personalized photo frame sales. |
Note - Market size estimations and growth projections presented in this report are based on 6Wresearch's advanced forecasting approach, validated with industry datasets as of June 2026.
United States (US) Digital Photo Frame Market Synopsis
The United States (US) Digital Photo Frame Market is projected to reach 2.9% and witness significant growth during the forecast period (2026-2032). This growth is fueled by the increasing integration of digital photography into everyday life, alongside a rising consumer interest in personalized home decor solutions. The digital photo frame sector is evolving, characterized by a wide variety of offerings with enhanced functionalities, catering to modern consumer needs.
United States (US) Digital Photo Frame Market Growth Drivers
The momentum within the United States Digital Photo Frame Market is driven by several key factors:
- Growing Popularity of Digital Photography: The surge in digital photography adoption has led consumers to seek innovative ways to display their photos, fuelling the demand for digital photo frames.
- Technological Advancements: Newer display technologies, such as high-resolution screens and smart connectivity features, are enhancing the appeal of digital frames, making them more desirable for consumers.
- Consumer Demand for Personalization: There is an increasing trend among consumers for personalized decor items, and digital photo frames allow users to customize their displays with varied settings and images.
- Smart Home Integration: The rise of smart home ecosystems encourages consumers to purchase digital photo frames that can connect with other devices and provide enhanced functionality.
- Convenience of Sharing and Management: The ability to easily share and manage photos through cloud services and Wi-Fi connectivity is driving interest, as users prefer intuitive devices that simplify photo sharing.
United States (US) Digital Photo Frame Market Trends and Opportunities
The United States Digital Photo Frame Market is poised to embrace several noteworthy trends in the upcoming years:
- Rise of Smart Frames: There is a discernible shift towards smart digital frames that provide features such as video playback, social media integration, and voice controls, appealing to tech-savvy consumers.
- Increased Demand for High-Resolution Displays: As technology progresses, consumers are favoring larger frames with better resolution to enhance the clarity and vibrancy of displayed images.
- Customizable User Experience: Innovations in software are allowing users to personalize slideshow settings and other functionalities through mobile applications, enhancing user engagement.
- Niche Market Development: Opportunities are emerging in niche markets, where consumers are looking for specialized digital frames for digital art displays and unique gifting options.
- Integration with Emerging Technologies: Aligning digital photo frames with the Internet of Things (IoT) and smart home technologies presents a chance for differentiation and innovation within the market.
United States (US) Digital Photo Frame Market Challenges and Restraints
While the United States Digital Photo Frame Market is poised for growth, it is not without challenges:
- Competition with Mobile Devices: The availability of sophisticated smartphones and tablets that already serve as photo display devices intensifies competition, leading to a decline in standalone frame sales.
- Consumer Preferences Shifting: As cloud storage and social media platforms gain traction, the need for traditional digital photo frames may diminish, affecting market dynamics.
- Rising Expectations for Technology: Manufacturers must continuously innovate to meet consumer demands for larger sizes, higher resolutions, and advanced features at affordable prices.
- Data Privacy Concerns: Increasing awareness and concern regarding data privacy and security may limit consumer acceptance of internet-connected digital photo frames.
- Economic Factors: Fluctuations in consumer spending, driven by economic conditions, can impact discretionary purchases, including digital photo frames.
United States (US) Digital Photo Frame Market Investment Opportunities
The evolving landscape of the United States Digital Photo Frame Market offers promising investment avenues:
- Investment in Innovative Technologies: Stakeholders can explore groundbreaking technologies such as cloud-based storage solutions and enhanced touchscreen interfaces to attract modern consumers.
- Customization Capabilities: Developing unique features that allow for personalization, like customizable interfaces and user-friendly apps, can lead to increased market share.
- Niche Product Development: Focus on targeted segments, such as digital frames designed for professional photographers or customizable gift options, can unlock new revenue streams.
- Collaborations with Smart Home Brands: Partnerships with existing smart home product manufacturers can amplify market reach and improve product integration into existing systems.
- Market Expansion: Exploring international markets or underserved demographic segments can present additional growth opportunities for innovative products.
United States (US) Digital Photo Frame Market Government Investment and Initiatives
The United States Digital Photo Frame Market is influenced by various government policies aimed at fostering technological advancement and sustainable practices:
- Regulations on Electronic Waste: Strict policies surrounding electronic waste disposal mandate manufacturers to develop eco-friendly practices, impacting product design and lifecycle.
- Trade Policies: Tariffs on imported components can affect the manufacturing costs, requiring companies to navigate trade barriers effectively to remain competitive.
- Incentives for Innovation: Government initiatives promoting technological innovation encourage investments in research and development, particularly in sustainable technologies.
- Data Protection Regulations: Compliance with data privacy laws is imperative for manufacturers, especially those introducing internet-connected devices into the market.
- Support for Small Enterprises: Programs aimed at supporting small and medium enterprises can promote local manufacturers in the digital photo frame sector, fostering competition and innovation.
United States (US) Digital Photo Frame Market Latest Developments (May 2025 - June 2026)
Recent developments in the United States Digital Photo Frame Market indicate a shift towards enhanced connectivity and user experience. Companies are increasingly focusing on integrating artificial intelligence and machine learning capabilities into digital frames to provide personalized photo management features. Moreover, the trend of integrating digital photo frames with smart home systems has gained traction, allowing seamless operation alongside other smart devices. The demand for multifunctional frames capable of displaying videos and connecting to various cloud services highlights the evolving consumer expectations. Initiatives aimed at sustainable product development are also becoming prevalent, with more manufacturers emphasizing eco-friendly materials.
United States (US) Digital Photo Frame Market - Key Attractiveness of the Report
- 10 Years of Market Numbers
- Historical Data Starting from 2022 to 2025
- Base Year: 2025
- Forecast Data until 2032
- Key Performance Indicators Impacting the Market
- Major Upcoming Developments and Projects
Key Highlights of the Report:
- United States (US) Digital Photo Frame Market Outlook
- Market Size of United States (US) Digital Photo Frame Market, 2025
- Forecast of United States (US) Digital Photo Frame Market, 2032F
- Historical Data and Forecast of United States (US) Digital Photo Frame Revenues & Volume for the Period 2022-2032F
- United States (US) Digital Photo Frame Market Trend Evolution
- United States (US) Digital Photo Frame Market Drivers and Challenges
- United States (US) Digital Photo Frame Price Trends
- United States (US) Digital Photo Frame Porter's Five Forces
- United States (US) Digital Photo Frame Industry Life Cycle
- Historical Data and Forecast of United States (US) Digital Photo Frame Market Revenues & Volume By Product Type for the Period 2022-2032F
- Historical Data and Forecast of United States (US) Digital Photo Frame Market Revenues & Volume By Pan Touch Control Frame for the Period 2022-2032F
- Historical Data and Forecast of United States (US) Digital Photo Frame Market Revenues & Volume By Remote Control Frame for the Period 2022-2032F
- Historical Data and Forecast of United States (US) Digital Photo Frame Market Revenues & Volume By Size for the Period 2022-2032F
- Historical Data and Forecast of United States (US) Digital Photo Frame Market Revenues & Volume By Standard Frame (4:3) for the Period 2022-2032F
- Historical Data and Forecast of United States (US) Digital Photo Frame Market Revenues & Volume By Widescreen Frame (16:9) for the Period 2022-2032F
- Historical Data and Forecast of United States (US) Digital Photo Frame Market Revenues & Volume By Inch for the Period 2022-2032F
- Historical Data and Forecast of United States (US) Digital Photo Frame Market Revenues & Volume By Up to 7 for the Period 2022-2032F
- Historical Data and Forecast of United States (US) Digital Photo Frame Market Revenues & Volume By Between 7 to 15 for the Period 2022-2032F
- Historical Data and Forecast of United States (US) Digital Photo Frame Market Revenues & Volume By Above 15 for the Period 2022-2032F
- Historical Data and Forecast of United States (US) Digital Photo Frame Market Revenues & Volume By Power Source for the Period 2022-2032F
- Historical Data and Forecast of United States (US) Digital Photo Frame Market Revenues & Volume By Electricity Power Source for the Period 2022-2032F
- Historical Data and Forecast of United States (US) Digital Photo Frame Market Revenues & Volume By Battery Power Source for the Period 2022-2032F
- Historical Data and Forecast of United States (US) Digital Photo Frame Market Revenues & Volume By Application for the Period 2022-2032F
- Historical Data and Forecast of United States (US) Digital Photo Frame Market Revenues & Volume By Residential for the Period 2022-2032F
- Historical Data and Forecast of United States (US) Digital Photo Frame Market Revenues & Volume By Commercial for the Period 2022-2032F
- Historical Data and Forecast of United States (US) Digital Photo Frame Market Revenues & Volume By Distribution Channel for the Period 2022-2032F
- Historical Data and Forecast of United States (US) Digital Photo Frame Market Revenues & Volume By Online for the Period 2022-2032F
- Historical Data and Forecast of United States (US) Digital Photo Frame Market Revenues & Volume By Offline for the Period 2022-2032F
- United States (US) Digital Photo Frame Import Export Trade Statistics
- Market Opportunity Assessment By Product Type
- Market Opportunity Assessment By Size
- Market Opportunity Assessment By Inch
- Market Opportunity Assessment By Power Source
- Market Opportunity Assessment By Application
- Market Opportunity Assessment By Distribution Channel
- United States (US) Digital Photo Frame Top Companies Market Share
- United States (US) Digital Photo Frame Competitive Benchmarking By Technical and Operational Parameters
- United States (US) Digital Photo Frame Company Profiles
- United States (US) Digital Photo Frame Key Strategic Recommendations
Frequently Asked Questions About the Market Study (FAQs):
The growth is primarily driven by the increasing popularity of digital photography, demand for personalized decor, and advancements in display technologies.
Consumer preferences are leaning towards smart features, higher resolutions, and customization options, which are shaping product innovation in the market.
The market faces challenges from competition with mobile devices, changing consumer preferences towards digital photo storage, and concerns around data privacy.
Opportunities lie in technological innovations, niche market development, and collaborations with smart home brands to enhance product offerings.
6Wresearch actively monitors the United States (US) Digital Photo Frame Market and publishes its comprehensive annual report, highlighting emerging trends, growth drivers, revenue analysis, and forecast outlook. Our insights help businesses to make data-backed strategic decisions with ongoing market dynamics. Our analysts track relevent industries related to the United States (US) Digital Photo Frame Market, allowing our clients with actionable intelligence and reliable forecasts tailored to emerging regional needs.
Yes, we provide customisation as per your requirements. To learn more, feel free to contact us on sales@6wresearch.com
1 Executive Summary |
2 Introduction |
2.1 Key Highlights of the Report |
2.2 Report Description |
2.3 Market Scope & Segmentation |
2.4 Research Methodology |
2.5 Assumptions |
3 United States (US) Digital Photo Frame Market Overview |
3.1 United States (US) Country Macro Economic Indicators |
3.2 United States (US) Digital Photo Frame Market Revenues & Volume, 2022 & 2032F |
3.3 United States (US) Digital Photo Frame Market - Industry Life Cycle |
3.4 United States (US) Digital Photo Frame Market - Porter's Five Forces |
3.5 United States (US) Digital Photo Frame Market Revenues & Volume Share, By Product Type, 2022 & 2032F |
3.6 United States (US) Digital Photo Frame Market Revenues & Volume Share, By Size, 2022 & 2032F |
3.7 United States (US) Digital Photo Frame Market Revenues & Volume Share, By Inch, 2022 & 2032F |
3.8 United States (US) Digital Photo Frame Market Revenues & Volume Share, By Power Source, 2022 & 2032F |
3.9 United States (US) Digital Photo Frame Market Revenues & Volume Share, By Application, 2022 & 2032F |
3.10 United States (US) Digital Photo Frame Market Revenues & Volume Share, By Distribution Channel, 2022 & 2032F |
4 United States (US) Digital Photo Frame Market Dynamics |
4.1 Impact Analysis |
4.2 Market Drivers |
4.2.1 Increasing adoption of digital technology among consumers |
4.2.2 Growing popularity of digital photo frames as gifts |
4.2.3 Rising demand for smart home devices |
4.2.4 Technological advancements in digital photo frame features |
4.3 Market Restraints |
4.3.1 Competition from smartphones and tablets with photo display capabilities |
4.3.2 High initial cost of digital photo frames |
4.3.3 Limited consumer awareness about the benefits of digital photo frames |
4.3.4 Fragmented market with numerous brands and products |
5 United States (US) Digital Photo Frame Market Trends |
6 United States (US) Digital Photo Frame Market, By Types |
6.1 United States (US) Digital Photo Frame Market, By Product Type |
6.1.1 Overview and Analysis |
6.1.2 United States (US) Digital Photo Frame Market Revenues & Volume, By Product Type, 2022-2032F |
6.1.3 United States (US) Digital Photo Frame Market Revenues & Volume, By Pan Touch Control Frame, 2022-2032F |
6.1.4 United States (US) Digital Photo Frame Market Revenues & Volume, By Remote Control Frame, 2022-2032F |
6.2 United States (US) Digital Photo Frame Market, By Size |
6.2.1 Overview and Analysis |
6.2.2 United States (US) Digital Photo Frame Market Revenues & Volume, By Standard Frame (4:3), 2022-2032F |
6.2.3 United States (US) Digital Photo Frame Market Revenues & Volume, By Widescreen Frame (16:9), 2022-2032F |
6.3 United States (US) Digital Photo Frame Market, By Inch |
6.3.1 Overview and Analysis |
6.3.2 United States (US) Digital Photo Frame Market Revenues & Volume, By Up to 7, 2022-2032F |
6.3.3 United States (US) Digital Photo Frame Market Revenues & Volume, By Between 7 to 15, 2022-2032F |
6.3.4 United States (US) Digital Photo Frame Market Revenues & Volume, By Above 15, 2022-2032F |
6.4 United States (US) Digital Photo Frame Market, By Power Source |
6.4.1 Overview and Analysis |
6.4.2 United States (US) Digital Photo Frame Market Revenues & Volume, By Electricity Power Source, 2022-2032F |
6.4.3 United States (US) Digital Photo Frame Market Revenues & Volume, By Battery Power Source, 2022-2032F |
6.5 United States (US) Digital Photo Frame Market, By Application |
6.5.1 Overview and Analysis |
6.5.2 United States (US) Digital Photo Frame Market Revenues & Volume, By Residential, 2022-2032F |
6.5.3 United States (US) Digital Photo Frame Market Revenues & Volume, By Commercial, 2022-2032F |
6.6 United States (US) Digital Photo Frame Market, By Distribution Channel |
6.6.1 Overview and Analysis |
6.6.2 United States (US) Digital Photo Frame Market Revenues & Volume, By Online, 2022-2032F |
6.6.3 United States (US) Digital Photo Frame Market Revenues & Volume, By Offline, 2022-2032F |
7 United States (US) Digital Photo Frame Market Import-Export Trade Statistics |
7.1 United States (US) Digital Photo Frame Market Export to Major Countries |
7.2 United States (US) Digital Photo Frame Market Imports from Major Countries |
8 United States (US) Digital Photo Frame Market Key Performance Indicators |
8.1 Average time spent on digital photo frame usage per household |
8.2 Number of digital photo frame units sold per quarter |
8.3 Percentage of households owning at least one digital photo frame |
8.4 Rate of new product innovations in the digital photo frame market |
8.5 Customer satisfaction levels with digital photo frame features and functionalities |
9 United States (US) Digital Photo Frame Market - Opportunity Assessment |
9.1 United States (US) Digital Photo Frame Market Opportunity Assessment, By Product Type, 2022 & 2032F |
9.2 United States (US) Digital Photo Frame Market Opportunity Assessment, By Size, 2022 & 2032F |
9.3 United States (US) Digital Photo Frame Market Opportunity Assessment, By Inch, 2022 & 2032F |
9.4 United States (US) Digital Photo Frame Market Opportunity Assessment, By Power Source, 2022 & 2032F |
9.5 United States (US) Digital Photo Frame Market Opportunity Assessment, By Application, 2022 & 2032F |
9.6 United States (US) Digital Photo Frame Market Opportunity Assessment, By Distribution Channel, 2022 & 2032F |
10 United States (US) Digital Photo Frame Market - Competitive Landscape |
10.1 United States (US) Digital Photo Frame Market Revenue Share, By Companies, 2025 |
10.2 United States (US) Digital Photo Frame Market Competitive Benchmarking, By Operating and Technical Parameters |
11 Company Profiles |
12 Recommendations |
13 Disclaimer |
Global Go To Market Strategy - 2030
Export potential enables firms to identify high-growth global markets with greater confidence by combining advanced trade intelligence with a structured quantitative methodology. The framework analyzes emerging demand trends and country-level import patterns while integrating macroeconomic and trade datasets such as GDP and population forecasts, bilateral import–export flows, tariff structures, elasticity differentials between developed and developing economies, geographic distance, and import demand projections. Using weighted trade values from 2020–2024 as the base period to project country-to-country export potential for 2030, these inputs are operationalized through calculated drivers such as gravity model parameters, tariff impact factors, and projected GDP per-capita growth. Through an analysis of hidden potentials, demand hotspots, and market conditions that are most favorable to success, this method enables firms to focus on target countries, maximize returns, and global expansion with data, backed by accuracy.
By factoring in the projected importer demand gap that is currently unmet and could be potential opportunity, it identifies the potential for the Exporter (Country) among 190 countries, against the general trade analysis, which identifies the biggest importer or exporter.
To discover high-growth global markets and optimize your business strategy:
Click Here
Pricing
- Single User License$ 1,995
- Department License$ 2,400
- Site License$ 3,120
- Global License$ 3,795

Leadership Perspectives from Industry Events
Search
Thought Leadership and Analyst Meet


Our Clients
6WResearch In News
- India Air Conditioner Market Set for Strong Rebound in 2026 After Weather-Led Correction and GST-Driven Recovery: 6Wresearch
- ADAS in India: How Automatic Emergency Braking, Blind Spot Detection & Driver Monitoring are Transforming Road Safety
- Doha a strategic location for EV manufacturing hub: IPA Qatar
- Demand for luxury TVs surging in the GCC, says Samsung
- Empowering Growth: The Thriving Journey of Bangladesh’s Cable Industry
- Demand for luxury TVs surging in the GCC, says Samsung
Latest Reports
- Nicaragua RPG Gaming Market (2026-2032)
- New Zealand RPG Gaming Market (2026-2032)
- Netherlands RPG Gaming Market (2026-2032)
- Nauru RPG Gaming Market (2026-2032)
- Namibia RPG Gaming Market (2026-2032)
- Mozambique RPG Gaming Market (2026-2032)
- Montenegro RPG Gaming Market (2026-2032)
- Mongolia RPG Gaming Market (2026-2032)
- Monaco RPG Gaming Market (2026-2032)
- Micronesia RPG Gaming Market (2026-2032)
Industry Events and Analyst Meet

EV India Expo 2026

HIMTEX 2026

India Refining Summit 2026

India EV Show 2026

EV tech India Expo 2026
Whitepaper
- Middle East & Africa Commercial Security Market Click here to view more.
- Middle East & Africa Fire Safety Systems & Equipment Market Click here to view more.
- GCC Drone Market Click here to view more.
- Middle East Lighting Fixture Market Click here to view more.
- GCC Physical & Perimeter Security Market Click here to view more.