United States (US) Electronics And Electrical Ceramics Market (2026-2032) Outlook | Analysis, Share, Size, Industry, Growth, Value, Revenue, Companies, Trends & Forecast
Market Forecast By End Use (Home Appliances, Power Grids, Medical Devices, Mobile Phones, Others), By Material (Alumina Electronics and Electrical Ceramics, Titanate Electronics and Electrical Ceramics, Zirconia Electronics and Electrical Ceramics, Silica Electronics and Electrical Ceramics, Others) And Competitive Landscape
| Product Code: ETC262621 | Publication Date: Aug 2022 | Updated Date: Jul 2026 | Product Type: Market Research Report | |
| Publisher: 6Wresearch | Author: Bhawna Singh | No. of Pages: 75 | No. of Figures: 35 | No. of Tables: 20 |
United States (US) Electronics And Electrical Ceramics Market Size, Share & Growth Rate
The United States (US) Electronics And Electrical Ceramics Market was estimated at USD 206 Million in 2025 and is projected to reach USD 243 Million by 2032, growing at a CAGR of 2.4% from 2026 to 2032. This growth trajectory is propelled by the escalating demand for high-performance electronic devices across sectors such as automotive, telecommunications, and healthcare. The transition towards advanced technologies, including 5G networks and electric vehicles, is driving the need for specialized ceramics that offer thermal stability and electrical insulation.
United States (US) Electronics And Electrical Ceramics Market Year-wise Growth Rate and Key Drivers
This graph highlights how the United States (US) Electronics And Electrical Ceramics Market has steadily grown over the years, supported by major growth factors.
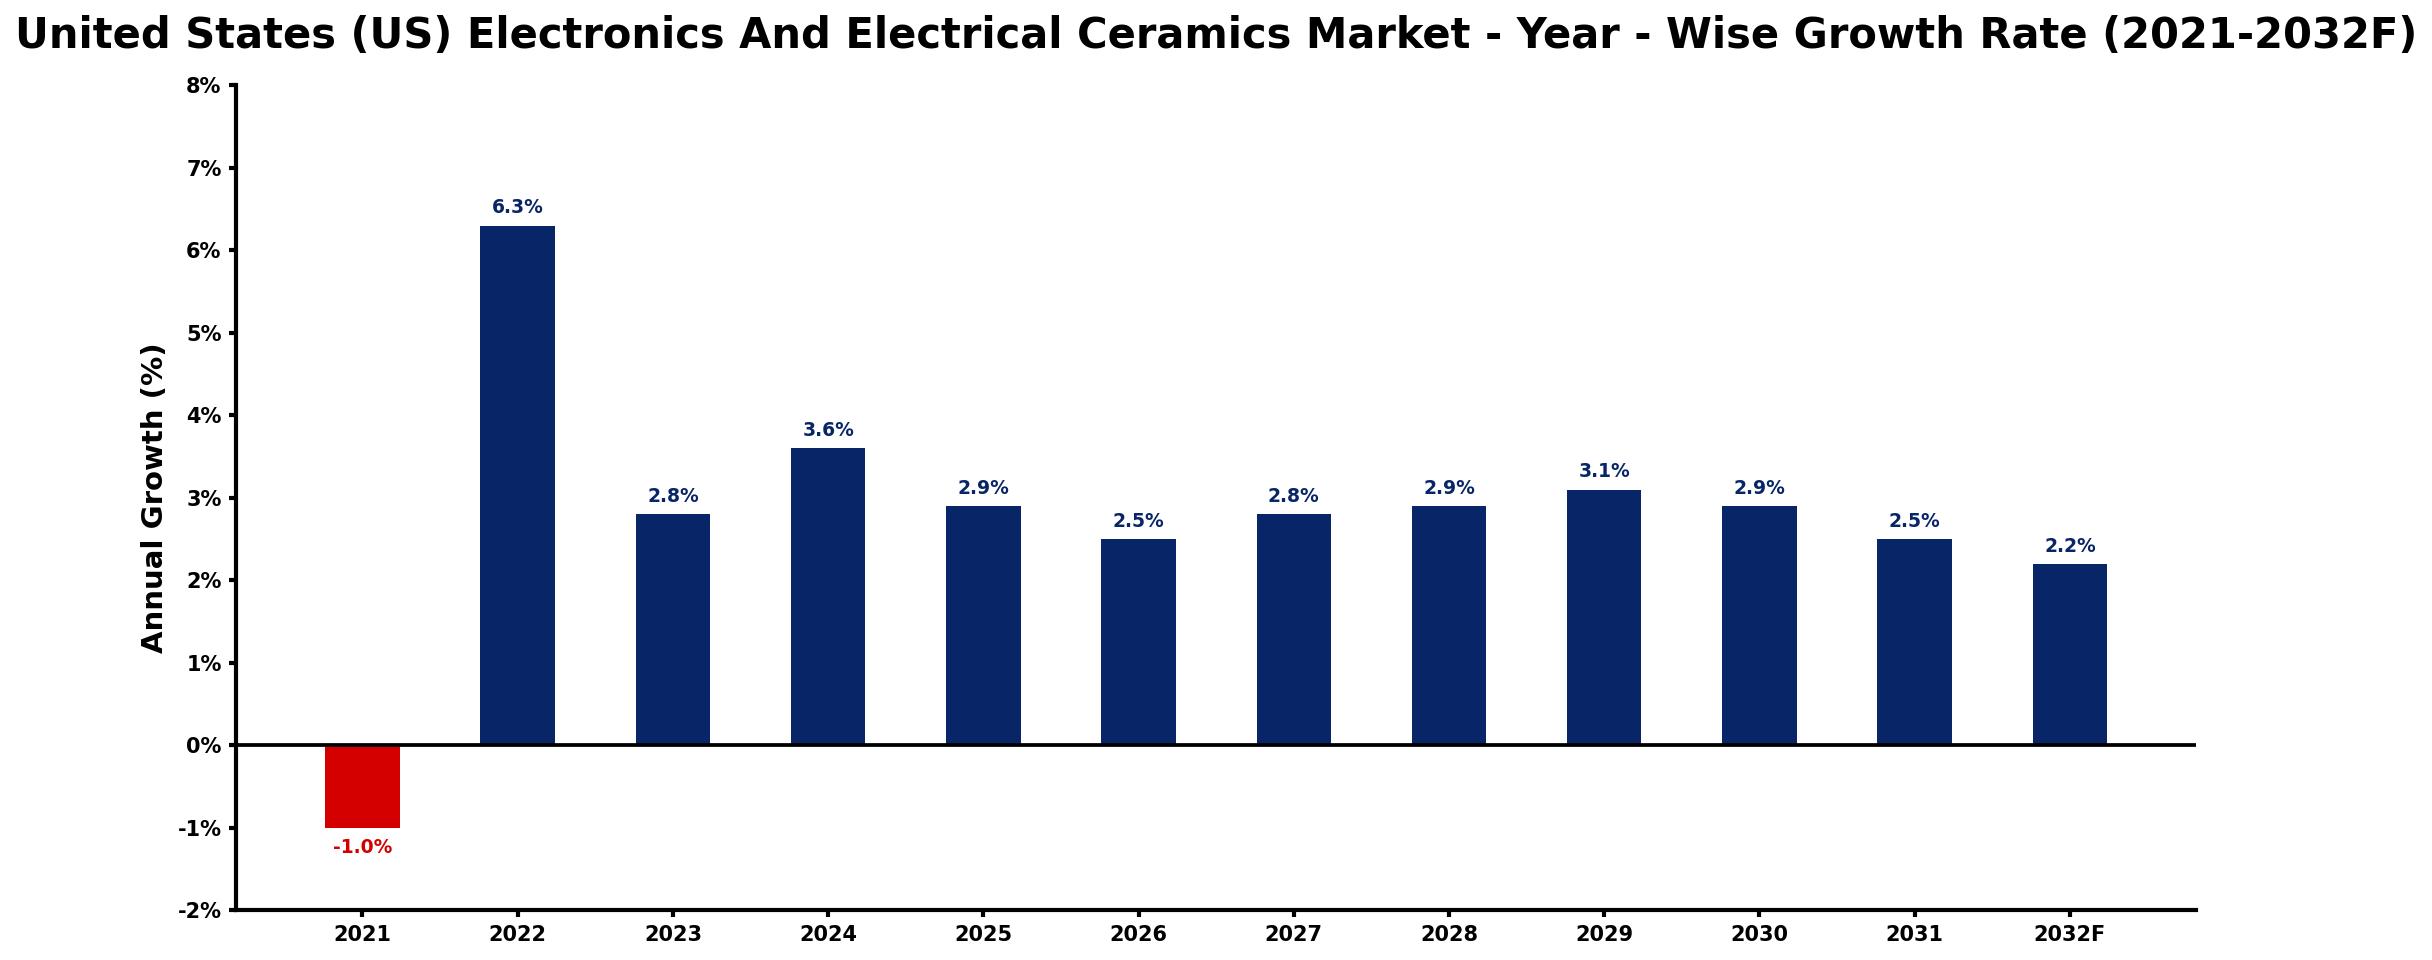
The table below presents the year‑wise growth rates along with the key drivers influencing the market
| Year | Growth Rate | Major Drivers |
| 2021 | -1.0% | decreased demand from manufacturing sector |
| 2022 | 6.3% | growing downstream application demand |
| 2023 | 2.8% | increased demand for renewable energy |
| 2024 | 3.6% | growing automotive technology adoption |
| 2025 | 2.9% | expansion in smart home applications |
| 2026 | 2.5% | enhanced demand for telecommunications infrastructure |
| 2027 | 2.8% | surge in medical technology investments |
| 2028 | 2.9% | growth in electric vehicle production |
| 2029 | 3.1% | increased focus on sustainability initiatives |
| 2030 | 2.9% | rising demand for energy storage |
| 2031 | 2.5% | expansion of industrial automation solutions |
| 2032 | 2.2% | growing need for advanced materials |
Note: Market size estimations and growth projections presented in this report are based on 6Wresearch's proprietary forecasting methodology, utilizing the latest available industry data, government publications, and primary research inputs.
United States (US) Electronics And Electrical Ceramics Market Synopsis
The surge in the adoption of IoT devices and smart technologies is fundamentally reshaping the US Electronics and Electrical Ceramics Market. As industries strive for greater efficiency and compact designs, the demand for advanced ceramics with high thermal conductivity and low dielectric loss is becoming paramount.
Moreover, the market is witnessing a progressive shift towards sustainable practices. Manufacturers are increasingly focusing on eco-friendly materials that align with stringent environmental regulations, thus presenting new avenues for innovation within this space.
United States (US) Electronics And Electrical Ceramics Market Key Takeaways
- The market is driven by the growing demand from diverse sectors, including telecommunications and healthcare.
- There is an increasing emphasis on miniaturization and enhanced performance of electronic components.
- Sustainable production practices are gaining traction, influencing material selection and manufacturing processes.
- Investment in research and development is crucial to keeping pace with technological advancements.
- Regulatory compliance remains a significant factor for companies operating in this competitive landscape.
Evaluation of Restraints in United States (US) Electronics And Electrical Ceramics Market
Despite the positive outlook, the US Electronics and Electrical Ceramics Market faces real constraints that could hinder growth. Increasing competition from international manufacturers poses a threat to domestic players, particularly as global supply chains become more integrated. The volatility in raw material prices can impact profit margins, while rapid technological changes require companies to consistently innovate and adapt. Additionally, regulatory challenges and environmental concerns regarding electronic waste disposal present ongoing obstacles for manufacturers seeking to expand their operations.
United States (US) Electronics And Electrical Ceramics Market Trends
Several trends are shaping the future of the US Electronics and Electrical Ceramics Market. One notable trend is the increasing demand for ceramics that exhibit superior thermal management and resistance to extreme conditions. As industries pivot towards more compact and efficient electronics, the use of high-performance ceramics is becoming increasingly critical. Moreover, the market is experiencing a burgeoning interest in additive manufacturing technologies, which allow for more intricate designs and custom solutions tailored to specific applications.
United States (US) Electronics And Electrical Ceramics Market Opportunities
Investment opportunities abound within the US Electronics and Electrical Ceramics Market, particularly in the realm of companies specializing in innovative ceramic materials. As the automotive sector embraces electric vehicles, the demand for ceramics that provide enhanced durability and insulation is poised to rise. Furthermore, businesses focusing on the development of manufacturing technologies and equipment are likely to benefit from the increasing need for precision in ceramic production.
Government Initiatives in the United States (US) Electronics And Electrical Ceramics Market
Government policies in the United States play a pivotal role in shaping the Electronics and Electrical Ceramics Market. Regulatory bodies such as the Environmental Protection Agency (EPA) ensure that manufacturers adhere to safety and environmental standards, while initiatives from the National Institute of Standards and Technology (NIST) support innovation and development in the field. Trade policies also impact the landscape, with efforts aimed at promoting domestic manufacturing and reducing dependency on international suppliers, ultimately fostering a more competitive environment.
Future Insights of the United States (US) Electronics And Electrical Ceramics Market
Looking ahead to 2026-2032, the US Electronics and Electrical Ceramics Market is set to experience significant transformations driven by the relentless pace of technological advancement. The integration of renewable energy sources and the proliferation of smart devices are expected to boost demand for specialized ceramics. Companies that focus on sustainability, efficiency, and innovation will likely lead the charge in this evolving landscape, positioning themselves strategically for long-term success.
United States (US) Electronics And Electrical Ceramics Market Latest Developments (2025 - 2026)
Recent developments within the Electronics and Electrical Ceramics Market indicate a strong push towards innovation in material science. Companies are investing in new manufacturing processes to enhance product performance and sustainability. Additionally, collaborations between industry players and research institutions are on the rise, aiming to develop next-generation ceramic materials that meet the demanding requirements of emerging technologies.
United States (US) Electronics And Electrical Ceramics Market - Key Attractiveness of the Report
- 10 Years of Market Numbers
- Historical Data Starting from 2022 to 2025
- Base Year: 2025
- Forecast Data until 2032
- Key Performance Indicators Impacting the Market
- Major Upcoming Developments and Projects
Key Highlights of the Report:
- United States (US) Electronics And Electrical Ceramics Market Outlook
- Market Size of United States (US) Electronics And Electrical Ceramics Market, 2025
- Forecast of United States (US) Electronics And Electrical Ceramics Market, 2032
- Historical Data and Forecast of United States (US) Electronics And Electrical Ceramics Revenues & Volume for the Period 2022-2032F
- United States (US) Electronics And Electrical Ceramics Market Trend Evolution
- United States (US) Electronics And Electrical Ceramics Market Drivers and Challenges
- United States (US) Electronics And Electrical Ceramics Price Trends
- United States (US) Electronics And Electrical Ceramics Porter's Five Forces
- United States (US) Electronics And Electrical Ceramics Industry Life Cycle
- Historical Data and Forecast of United States (US) Electronics And Electrical Ceramics Market Revenues & Volume By End Use for the Period 2022-2032F
- Historical Data and Forecast of United States (US) Electronics And Electrical Ceramics Market Revenues & Volume By Home Appliances for the Period 2022-2032F
- Historical Data and Forecast of United States (US) Electronics And Electrical Ceramics Market Revenues & Volume By Power Grids for the Period 2022-2032F
- Historical Data and Forecast of United States (US) Electronics And Electrical Ceramics Market Revenues & Volume By Medical Devices for the Period 2022-2032F
- Historical Data and Forecast of United States (US) Electronics And Electrical Ceramics Market Revenues & Volume By Mobile Phones for the Period 2022-2032F
- Historical Data and Forecast of United States (US) Electronics And Electrical Ceramics Market Revenues & Volume By Others for the Period 2022-2032F
- Historical Data and Forecast of United States (US) Electronics And Electrical Ceramics Market Revenues & Volume By Material for the Period 2022-2032F
- Historical Data and Forecast of United States (US) Electronics And Electrical Ceramics Market Revenues & Volume By Alumina Electronics and Electrical Ceramics for the Period 2022-2032F
- Historical Data and Forecast of United States (US) Electronics And Electrical Ceramics Market Revenues & Volume By Titanate Electronics and Electrical Ceramics for the Period 2022-2032F
- Historical Data and Forecast of United States (US) Electronics And Electrical Ceramics Market Revenues & Volume By Zirconia Electronics and Electrical Ceramics for the Period 2022-2032F
- Historical Data and Forecast of United States (US) Electronics And Electrical Ceramics Market Revenues & Volume By Silica Electronics and Electrical Ceramics for the Period 2022-2032F
- Historical Data and Forecast of United States (US) Electronics And Electrical Ceramics Market Revenues & Volume By Others for the Period 2022-2032F
- United States (US) Electronics And Electrical Ceramics Import Export Trade Statistics
- Market Opportunity Assessment By End Use
- Market Opportunity Assessment By Material
- United States (US) Electronics And Electrical Ceramics Top Companies Market Share
- United States (US) Electronics And Electrical Ceramics Competitive Benchmarking By Technical and Operational Parameters
- United States (US) Electronics And Electrical Ceramics Company Profiles
- United States (US) Electronics And Electrical Ceramics Key Strategic Recommendations
Frequently Asked Questions About the Market Study (FAQs):
The market is estimated at USD 206 Million in 2025 and is projected to reach USD 243 Million by 2032, reflecting a CAGR of 2.4% from 2026 to 2032.
Demand is particularly strong in the telecommunications, automotive, and healthcare sectors, where high-performance materials are essential for advanced electronic devices.
Increasingly stringent environmental regulations are prompting manufacturers to adopt eco-friendly materials and practices, which is reshaping material choices and production techniques in the market.
Innovations in additive manufacturing and enhanced material properties, such as improved thermal management and durability, are key technological drivers in the Electronics and Electrical Ceramics Market.
Government initiatives focus on regulatory compliance and support for domestic manufacturing, helping create a competitive environment and promoting innovation in the industry.
6Wresearch actively monitors the United States (US) Electronics And Electrical Ceramics Market and publishes its comprehensive annual report, highlighting emerging trends, growth drivers, revenue analysis, and forecast outlook. Our insights help businesses to make data-backed strategic decisions with ongoing market dynamics. Our analysts track relevent industries related to the United States (US) Electronics And Electrical Ceramics Market, allowing our clients with actionable intelligence and reliable forecasts tailored to emerging regional needs.
Yes, we provide customisation as per your requirements. To learn more, feel free to contact us on sales@6wresearch.com
1 Executive Summary |
2 Introduction |
2.1 Key Highlights of the Report |
2.2 Report Description |
2.3 Market Scope & Segmentation |
2.4 Research Methodology |
2.5 Assumptions |
3 United States (US) Electronics And Electrical Ceramics Market Overview |
3.1 United States (US) Country Macro Economic Indicators |
3.2 United States (US) Electronics And Electrical Ceramics Market Revenues & Volume, 2022 & 2032F |
3.3 United States (US) Electronics And Electrical Ceramics Market - Industry Life Cycle |
3.4 United States (US) Electronics And Electrical Ceramics Market - Porter's Five Forces |
3.5 United States (US) Electronics And Electrical Ceramics Market Revenues & Volume Share, By End Use, 2022 & 2032F |
3.6 United States (US) Electronics And Electrical Ceramics Market Revenues & Volume Share, By Material, 2022 & 2032F |
4 United States (US) Electronics And Electrical Ceramics Market Dynamics |
4.1 Impact Analysis |
4.2 Market Drivers |
4.2.1 Increasing demand for consumer electronics and gadgets |
4.2.2 Growth in the automotive industry leading to higher demand for electronic components |
4.2.3 Technological advancements driving the need for specialized ceramics in electronic applications |
4.3 Market Restraints |
4.3.1 Fluctuating raw material prices impacting production costs |
4.3.2 Intense competition from alternative materials such as plastics and metals |
5 United States (US) Electronics And Electrical Ceramics Market Trends |
6 United States (US) Electronics And Electrical Ceramics Market, By Types |
6.1 United States (US) Electronics And Electrical Ceramics Market, By End Use |
6.1.1 Overview and Analysis |
6.1.2 United States (US) Electronics And Electrical Ceramics Market Revenues & Volume, By End Use, 2022-2032F |
6.1.3 United States (US) Electronics And Electrical Ceramics Market Revenues & Volume, By Home Appliances, 2022-2032F |
6.1.4 United States (US) Electronics And Electrical Ceramics Market Revenues & Volume, By Power Grids, 2022-2032F |
6.1.5 United States (US) Electronics And Electrical Ceramics Market Revenues & Volume, By Medical Devices, 2022-2032F |
6.1.6 United States (US) Electronics And Electrical Ceramics Market Revenues & Volume, By Mobile Phones, 2022-2032F |
6.1.7 United States (US) Electronics And Electrical Ceramics Market Revenues & Volume, By Others, 2022-2032F |
6.2 United States (US) Electronics And Electrical Ceramics Market, By Material |
6.2.1 Overview and Analysis |
6.2.2 United States (US) Electronics And Electrical Ceramics Market Revenues & Volume, By Alumina Electronics and Electrical Ceramics, 2022-2032F |
6.2.3 United States (US) Electronics And Electrical Ceramics Market Revenues & Volume, By Titanate Electronics and Electrical Ceramics, 2022-2032F |
6.2.4 United States (US) Electronics And Electrical Ceramics Market Revenues & Volume, By Zirconia Electronics and Electrical Ceramics, 2022-2032F |
6.2.5 United States (US) Electronics And Electrical Ceramics Market Revenues & Volume, By Silica Electronics and Electrical Ceramics, 2022-2032F |
6.2.6 United States (US) Electronics And Electrical Ceramics Market Revenues & Volume, By Others, 2022-2032F |
7 United States (US) Electronics And Electrical Ceramics Market Import-Export Trade Statistics |
7.1 United States (US) Electronics And Electrical Ceramics Market Export to Major Countries |
7.2 United States (US) Electronics And Electrical Ceramics Market Imports from Major Countries |
8 United States (US) Electronics And Electrical Ceramics Market Key Performance Indicators |
8.1 Research and development investment in ceramic materials for electronics |
8.2 Adoption rate of electronics and electrical ceramics in key industries |
8.3 Innovation rate in the electronics and electrical ceramics sector |
9 United States (US) Electronics And Electrical Ceramics Market - Opportunity Assessment |
9.1 United States (US) Electronics And Electrical Ceramics Market Opportunity Assessment, By End Use, 2022 & 2032F |
9.2 United States (US) Electronics And Electrical Ceramics Market Opportunity Assessment, By Material, 2022 & 2032F |
10 United States (US) Electronics And Electrical Ceramics Market - Competitive Landscape |
10.1 United States (US) Electronics And Electrical Ceramics Market Revenue Share, By Companies, 2025 |
10.2 United States (US) Electronics And Electrical Ceramics Market Competitive Benchmarking, By Operating and Technical Parameters |
11 Company Profiles |
12 Recommendations |
13 Disclaimer |
Global Go To Market Strategy - 2030
Export potential enables firms to identify high-growth global markets with greater confidence by combining advanced trade intelligence with a structured quantitative methodology. The framework analyzes emerging demand trends and country-level import patterns while integrating macroeconomic and trade datasets such as GDP and population forecasts, bilateral import–export flows, tariff structures, elasticity differentials between developed and developing economies, geographic distance, and import demand projections. Using weighted trade values from 2020–2024 as the base period to project country-to-country export potential for 2030, these inputs are operationalized through calculated drivers such as gravity model parameters, tariff impact factors, and projected GDP per-capita growth. Through an analysis of hidden potentials, demand hotspots, and market conditions that are most favorable to success, this method enables firms to focus on target countries, maximize returns, and global expansion with data, backed by accuracy.
By factoring in the projected importer demand gap that is currently unmet and could be potential opportunity, it identifies the potential for the Exporter (Country) among 190 countries, against the general trade analysis, which identifies the biggest importer or exporter.
To discover high-growth global markets and optimize your business strategy:
Click Here
Pricing
- Single User License$ 1,995
- Department License$ 2,400
- Site License$ 3,120
- Global License$ 3,795

Leadership Perspectives from Industry Events
Search
Thought Leadership and Analyst Meet


Our Clients
6WResearch In News
- India Air Conditioner Market Set for Strong Rebound in 2026 After Weather-Led Correction and GST-Driven Recovery: 6Wresearch
- ADAS in India: How Automatic Emergency Braking, Blind Spot Detection & Driver Monitoring are Transforming Road Safety
- Doha a strategic location for EV manufacturing hub: IPA Qatar
- Demand for luxury TVs surging in the GCC, says Samsung
- Empowering Growth: The Thriving Journey of Bangladesh’s Cable Industry
- Demand for luxury TVs surging in the GCC, says Samsung
Latest Reports
- Nicaragua RPG Gaming Market (2026-2032)
- New Zealand RPG Gaming Market (2026-2032)
- Netherlands RPG Gaming Market (2026-2032)
- Nauru RPG Gaming Market (2026-2032)
- Namibia RPG Gaming Market (2026-2032)
- Mozambique RPG Gaming Market (2026-2032)
- Montenegro RPG Gaming Market (2026-2032)
- Mongolia RPG Gaming Market (2026-2032)
- Monaco RPG Gaming Market (2026-2032)
- Micronesia RPG Gaming Market (2026-2032)
Industry Events and Analyst Meet

EV India Expo 2026

HIMTEX 2026

India Refining Summit 2026

India EV Show 2026

EV tech India Expo 2026
Whitepaper
- Middle East & Africa Commercial Security Market Click here to view more.
- Middle East & Africa Fire Safety Systems & Equipment Market Click here to view more.
- GCC Drone Market Click here to view more.
- Middle East Lighting Fixture Market Click here to view more.
- GCC Physical & Perimeter Security Market Click here to view more.