United States (US) Fish Processing Market (2026-2032) | Companies, Size, Revenue, Share, Value, Forecast, Trends, Growth, Industry, Analysis & Outlook
Market Forecast By Source (Marine, Inland, Freshwater), By Application (Food, Feed, Biomedical, Others), By Processing (Frozen, Preserved, Others), By Equipment (Gutting, Scaling, Filleting, Deboning, Skinning, Curing & Smoking, Others) And Competitive Landscape
| Product Code: ETC042581 | Publication Date: Jan 2021 | Updated Date: Jun 2026 | Product Type: Report | |
| Publisher: 6Wresearch | Author: Ravi Bhandari | No. of Pages: 70 | No. of Figures: 35 | No. of Tables: 5 |
United States (US) Fish Processing Market Summary
The united states (us) fish processing market was estimated at USD 220 Million in 2025 and is projected to reach USD 261 Million by 2032, growing at a CAGR of 3.0% from 2026 to 2032.
United States (US) Fish Processing Market Year-wise Growth Rate and Key Drivers
This graph highlights how the United States (US) Fish Processing Market has steadily grown over the past five years, supported by major growth factors.
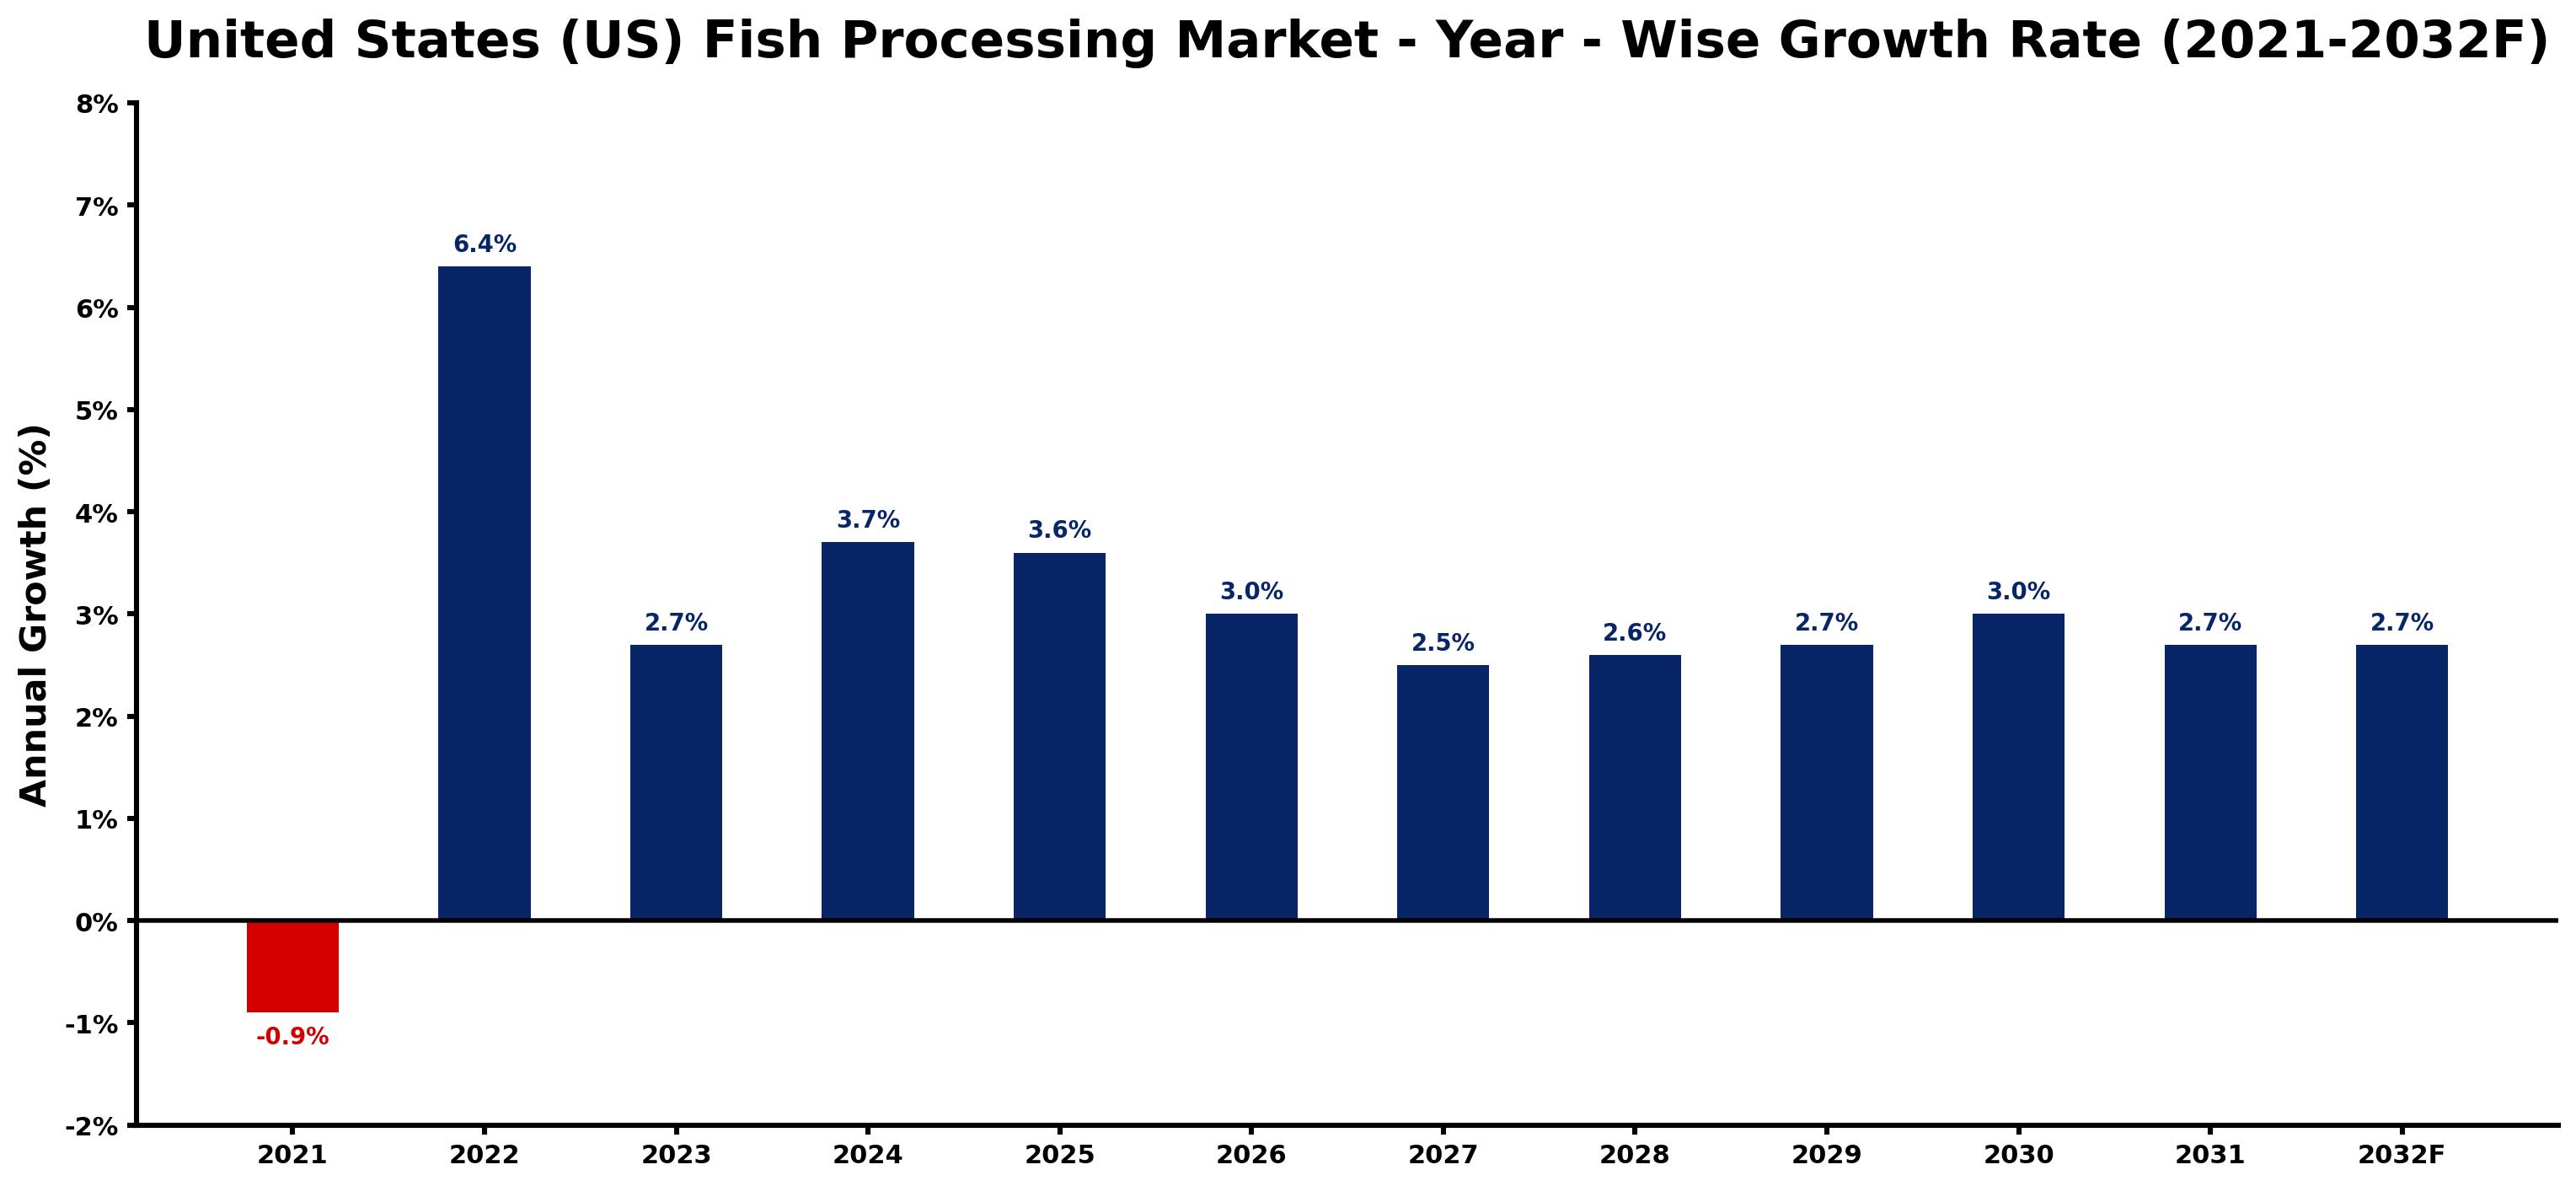
The table below presents the year wise growth rates along with the key drivers influencing the market
| Year | Growth Rate | Major Drivers |
| 2021 | -0.9% | Pandemicrelated supply chain disruptions hindered fish availability, leading to decreased processing activity and lower sales. |
| 2022 | 6.4% | Retail chains began prioritizing local sourcing, boosting demand for nearby fish processing facilities. |
| 2023 | 2.7% | Technological improvements in preservation methods enhanced product shelf life and market competitiveness. |
| 2024 | 3.7% | Health trends emphasized omega-3 benefits, attracting a larger customer base to processed fish products. |
| 2025 | 3.6% | Supply chain disruptions prompted companies to invest in more resilient processing operations. |
| 2026 | 3.0% | E-commerce channels emerged as a vital sales route for fish processing businesses, expanding reach. |
| 2027 | 2.5% | Sustainability certifications gained prominence, driving processors to adopt greener practices and technologies. |
| 2028 | 2.6% | Collaboration between fish farms and processors fostered innovation in product diversification and quality. |
| 2029 | 2.7% | Increased consumer awareness of seafood sourcing enhanced the importance of traceability in processing. |
| 2030 | 3.0% | Emerging markets began importing US processed fish, creating lucrative export opportunities for local firms. |
| 2031 | 2.7% | Enhanced food safety standards necessitated higher investments in processing technology and infrastructure. |
| 2032 | 2.7% | Market consolidation led to fewer but larger fish processing companies dominating the landscape. |
Note - Market size estimations and growth projections presented in this report are based on 6Wresearch's advanced forecasting approach, validated with industry datasets as of June 2026.
United States (US) Fish Processing Market Synopsis
The United States (US) Fish Processing Market is projected to reach 3.0% and witness significant growth during the forecast period (2026-2032). This market serves as a vital component of the nation's food industry, facilitating the filleting, freezing, canning, and packaging of an array of seafood products. As seafood consumption trends upward in the US, this sector is pivotal in supplying diverse fish products that align with consumer preferences.
United States (US) Fish Processing Market Trends and Opportunities
The United States (US) Fish Processing Market is currently experiencing transformative trends driven by both consumer demand and technological advancements. There is a notable shift towards sustainable and eco-friendly fishing practices. This shift is largely influenced by an increasing number of consumers who are becoming increasingly aware of environmental issues. Consequently, the market is witnessing heightened interest in certifications such as the Marine Stewardship Council (MSC), which fosters responsible sourcing practices.
Technological advancements are also reshaping the industry landscape. Innovations in processing equipment and automation are enhancing efficiency and the quality of fish products. This is vital as manufacturers aim to keep pace with growing consumer preferences for quality and convenience. The rise of value-added products, including ready-to-eat meals and seafood snacks, highlights the market's responsiveness to the evolving lifestyle choices of health-conscious consumers who prioritize convenience without compromising on nutrition.
United States (US) Fish Processing Market Challenges and Restraints
Despite its robust growth potential, the United States (US) Fish Processing Market faces significant challenges that could impede progress. Stringent regulatory requirements from government bodies such as the FDA and USDA impose complex compliance demands on processors. Maintaining adherence to these regulations not only increases operational costs but may also restrict innovation and flexibility within the industry.
Furthermore, the market contends with intensifying competition from imported seafood, which is often available at competitive prices due to lower labor and production costs in foreign markets. This competition can undermine local processors' pricing strategies and market share. Sustainability concerns, particularly regarding overfishing and bycatch, represent another challenge, particularly as consumers emphasize the ethical dimension of their seafood choices.
Additionally, fluctuations in fish populations and unpredictable weather patterns can disrupt raw material availability, complicating supply chain logistics and affecting profitability. Addressing these challenges will require a concerted effort from stakeholders to innovate operational practices while ensuring environmental and social responsibilities are met.
United States (US) Fish Processing Market Investment Opportunities
The United States (US) Fish Processing Market offers various investment opportunities that savvy investors can leverage. There is a growing demand for seafood products that has resulted in an increase in interest in value-added processing. This avenue enables companies to differentiate their offerings through innovative packaging and advanced processing techniques.
Investors should also explore expansion strategies targeting niche markets, particularly in sustainable and organic seafood products, which are gaining traction among consumers. The intersection of technology and automation represents another critical area for investment, as enhancing processing efficiency can lead to significant cost reductions and improved profit margins.
As consumer awareness of the health benefits of seafood rises, coupled with the trend toward convenience foods, there is considerable potential for growth and product innovation. Investors who recognize and capitalize on these trends will find ample opportunities in the dynamic landscape of the US fish processing market.
United States (US) Fish Processing Market Government Investment and Initiatives
Government policies play a pivotal role in shaping the United States (US) Fish Processing Market. Regulatory frameworks established by agencies such as the Food and Drug Administration (FDA) and the National Oceanic and Atmospheric Administration (NOAA) are critical in ensuring food safety and sustainable fishing practices. The FDA delineates standards for processing, packaging, and labeling fish products, thereby safeguarding consumer health against potential foodborne illnesses.
NOAA regulates commercial fishing activities, providing oversight aimed at preventing overfishing and ensuring the sustainability of fish stocks. This regulatory environment promotes a competitive fish processing industry that aligns with public health objectives and environmental stewardship.
Additionally, the US Department of Agriculture (USDA) offers inspection services to guarantee the quality and safety of fish products that reach consumers. Collectively, these initiatives foster an environment conducive to responsible industry growth while addressing the challenges of sustainability.
United States (US) Fish Processing Market Latest Developments (May 2025 - June 2026)
The United States (US) Fish Processing Market has seen notable developments from May 2025 to June 2026, marking significant shifts in industry dynamics. During this period, there has been an observable increase in the adoption of sustainable practices across the sector, as businesses align themselves with consumer expectations for responsibly sourced seafood.
Technological advancements have further accelerated efficiency in processing operations, with many companies investing in state-of-the-art equipment and automated systems. These developments support improved product quality and operational performance, aiding businesses in navigating the competitive landscape more effectively.
Additionally, the market has seen an emergence of innovative products catering to health-conscious consumers. This includes an increase in ready-to-eat seafood options, reflecting changing consumer lifestyles that prioritize convenience without compromising nutrition.
Overall, these developments signal a proactive approach from industry stakeholders in addressing the evolving marketplace, particularly as consumer preferences and regulatory landscapes continue to shift.
United States (US) Fish Processing Market - Key Attractiveness of the Report
- 10 Years of Market Numbers
- Historical Data Starting from 2022 to 2025
- Base Year: 2025
- Forecast Data until 2032
- Key Performance Indicators Impacting the Market
- Major Upcoming Developments and Projects
Key Highlights of the Report:
- United States (US) Fish Processing Market Outlook
- Market Size of United States (US) Fish Processing Market, 2025
- Forecast of United States (US) Fish Processing Market, 2032F
- Historical Data and Forecast of United States (US) Fish Processing Revenues & Volume for the Period 2022-2032F
- United States (US) Fish Processing Market Trend Evolution
- United States (US) Fish Processing Market Drivers and Challenges
- United States (US) Fish Processing Price Trends
- United States (US) Fish Processing Porter's Five Forces
- United States (US) Fish Processing Industry Life Cycle
- Historical Data and Forecast of United States (US) Fish Processing Market Revenues & Volume By Source for the Period 2022-2032F
- Historical Data and Forecast of United States (US) Fish Processing Market Revenues & Volume By Marine for the Period 2022-2032F
- Historical Data and Forecast of United States (US) Fish Processing Market Revenues & Volume By Inland for the Period 2022-2032F
- Historical Data and Forecast of United States (US) Fish Processing Market Revenues & Volume By Freshwater for the Period 2022-2032F
- Historical Data and Forecast of United States (US) Fish Processing Market Revenues & Volume By Application for the Period 2022-2032F
- Historical Data and Forecast of United States (US) Fish Processing Market Revenues & Volume By Food for the Period 2022-2032F
- Historical Data and Forecast of United States (US) Fish Processing Market Revenues & Volume By Feed for the Period 2022-2032F
- Historical Data and Forecast of United States (US) Fish Processing Market Revenues & Volume By Biomedical for the Period 2022-2032F
- Historical Data and Forecast of United States (US) Fish Processing Market Revenues & Volume By Others for the Period 2022-2032F
- Historical Data and Forecast of United States (US) Fish Processing Market Revenues & Volume By Processing for the Period 2022-2032F
- Historical Data and Forecast of United States (US) Fish Processing Market Revenues & Volume By Frozen for the Period 2022-2032F
- Historical Data and Forecast of United States (US) Fish Processing Market Revenues & Volume By Preserved for the Period 2022-2032F
- Historical Data and Forecast of United States (US) Fish Processing Market Revenues & Volume By Others for the Period 2022-2032F
- Historical Data and Forecast of United States (US) Fish Processing Market Revenues & Volume By Equipment for the Period 2022-2032F
- Historical Data and Forecast of United States (US) Fish Processing Market Revenues & Volume By Gutting for the Period 2022-2032F
- Historical Data and Forecast of United States (US) Fish Processing Market Revenues & Volume By Scaling for the Period 2022-2032F
- Historical Data and Forecast of United States (US) Fish Processing Market Revenues & Volume By Filleting for the Period 2022-2032F
- Historical Data and Forecast of United States (US) Fish Processing Market Revenues & Volume By Deboning for the Period 2022-2032F
- Historical Data and Forecast of United States (US) Fish Processing Market Revenues & Volume By Skinning for the Period 2022-2032F
- Historical Data and Forecast of United States (US) Fish Processing Market Revenues & Volume By Curing & Smoking for the Period 2022-2032F
- Historical Data and Forecast of United States (US) Fish Processing Market Revenues & Volume By Others for the Period 2022-2032F
- United States (US) Fish Processing Import Export Trade Statistics
- Market Opportunity Assessment By Source
- Market Opportunity Assessment By Application
- Market Opportunity Assessment By Processing
- Market Opportunity Assessment By Equipment
- United States (US) Fish Processing Top Companies Market Share
- United States (US) Fish Processing Competitive Benchmarking By Technical and Operational Parameters
- United States (US) Fish Processing Company Profiles
- United States (US) Fish Processing Key Strategic Recommendations
Frequently Asked Questions About the Market Study (FAQs):
The growth is primarily driven by increased seafood consumption, a shift towards sustainable practices, and technological advancements in processing.
Regulatory measures ensure food safety and sustainability, but compliance can add complexity and costs to operations.
Investment opportunities include value-added processing, innovative packaging, and technology enhancements aimed at improving operational efficiency.
Key challenges include stringent regulations, competition from imported seafood, and sustainability concerns related to overfishing and supply chain disruptions.
6Wresearch actively monitors the United States (US) Fish Processing Market and publishes its comprehensive annual report, highlighting emerging trends, growth drivers, revenue analysis, and forecast outlook. Our insights help businesses to make data-backed strategic decisions with ongoing market dynamics. Our analysts track relevent industries related to the United States (US) Fish Processing Market, allowing our clients with actionable intelligence and reliable forecasts tailored to emerging regional needs.
Yes, we provide customisation as per your requirements. To learn more, feel free to contact us on sales@6wresearch.com
1 Executive Summary |
2 Introduction |
2.1 Key Highlights of the Report |
2.2 Report Description |
2.3 Market Scope & Segmentation |
2.4 Research Methodology |
2.5 Assumptions |
3 United States (US) Fish Processing Market Overview |
3.1 United States (US) Country Macro Economic Indicators |
3.2 United States (US) Fish Processing Market Revenues & Volume, 2022 & 2032F |
3.3 United States (US) Fish Processing Market - Industry Life Cycle |
3.4 United States (US) Fish Processing Market - Porter's Five Forces |
3.5 United States (US) Fish Processing Market Revenues & Volume Share, By Source, 2022 & 2032F |
3.6 United States (US) Fish Processing Market Revenues & Volume Share, By Application, 2022 & 2032F |
3.7 United States (US) Fish Processing Market Revenues & Volume Share, By Processing, 2022 & 2032F |
3.8 United States (US) Fish Processing Market Revenues & Volume Share, By Equipment, 2022 & 2032F |
4 United States (US) Fish Processing Market Dynamics |
4.1 Impact Analysis |
4.2 Market Drivers |
4.2.1 Increasing demand for seafood products due to health benefits associated with consuming fish. |
4.2.2 Technological advancements in fish processing leading to improved efficiency and product quality. |
4.2.3 Growing consumer awareness about sustainable fishing practices and demand for eco-friendly products. |
4.3 Market Restraints |
4.3.1 Regulatory challenges and compliance requirements in the fish processing industry. |
4.3.2 Fluctuating raw material prices and supply chain disruptions impacting production costs. |
4.3.3 Competition from alternative protein sources and substitutes affecting market share. |
5 United States (US) Fish Processing Market Trends |
6 United States (US) Fish Processing Market, By Types |
6.1 United States (US) Fish Processing Market, By Source |
6.1.1 Overview and Analysis |
6.1.2 United States (US) Fish Processing Market Revenues & Volume, By Source, 2022-2032F |
6.1.3 United States (US) Fish Processing Market Revenues & Volume, By Marine, 2022-2032F |
6.1.4 United States (US) Fish Processing Market Revenues & Volume, By Inland, 2022-2032F |
6.1.5 United States (US) Fish Processing Market Revenues & Volume, By Freshwater, 2022-2032F |
6.2 United States (US) Fish Processing Market, By Application |
6.2.1 Overview and Analysis |
6.2.2 United States (US) Fish Processing Market Revenues & Volume, By Food, 2022-2032F |
6.2.3 United States (US) Fish Processing Market Revenues & Volume, By Feed, 2022-2032F |
6.2.4 United States (US) Fish Processing Market Revenues & Volume, By Biomedical, 2022-2032F |
6.2.5 United States (US) Fish Processing Market Revenues & Volume, By Others, 2022-2032F |
6.3 United States (US) Fish Processing Market, By Processing |
6.3.1 Overview and Analysis |
6.3.2 United States (US) Fish Processing Market Revenues & Volume, By Frozen, 2022-2032F |
6.3.3 United States (US) Fish Processing Market Revenues & Volume, By Preserved, 2022-2032F |
6.3.4 United States (US) Fish Processing Market Revenues & Volume, By Others, 2022-2032F |
6.4 United States (US) Fish Processing Market, By Equipment |
6.4.1 Overview and Analysis |
6.4.2 United States (US) Fish Processing Market Revenues & Volume, By Gutting, 2022-2032F |
6.4.3 United States (US) Fish Processing Market Revenues & Volume, By Scaling, 2022-2032F |
6.4.4 United States (US) Fish Processing Market Revenues & Volume, By Filleting, 2022-2032F |
6.4.5 United States (US) Fish Processing Market Revenues & Volume, By Deboning, 2022-2032F |
6.4.6 United States (US) Fish Processing Market Revenues & Volume, By Skinning, 2022-2032F |
6.4.7 United States (US) Fish Processing Market Revenues & Volume, By Curing & Smoking, 2022-2032F |
7 United States (US) Fish Processing Market Import-Export Trade Statistics |
7.1 United States (US) Fish Processing Market Export to Major Countries |
7.2 United States (US) Fish Processing Market Imports from Major Countries |
8 United States (US) Fish Processing Market Key Performance Indicators |
8.1 Percentage of fish processed using sustainable practices. |
8.2 Average processing time per unit of fish. |
8.3 Percentage of repeat customers indicating customer loyalty and satisfaction. |
9 United States (US) Fish Processing Market - Opportunity Assessment |
9.1 United States (US) Fish Processing Market Opportunity Assessment, By Source, 2022 & 2032F |
9.2 United States (US) Fish Processing Market Opportunity Assessment, By Application, 2022 & 2032F |
9.3 United States (US) Fish Processing Market Opportunity Assessment, By Processing, 2022 & 2032F |
9.4 United States (US) Fish Processing Market Opportunity Assessment, By Equipment, 2022 & 2032F |
10 United States (US) Fish Processing Market - Competitive Landscape |
10.1 United States (US) Fish Processing Market Revenue Share, By Companies, 2025 |
10.2 United States (US) Fish Processing Market Competitive Benchmarking, By Operating and Technical Parameters |
11 Company Profiles |
12 Recommendations |
13 Disclaimer |
Global Go To Market Strategy - 2030
Export potential enables firms to identify high-growth global markets with greater confidence by combining advanced trade intelligence with a structured quantitative methodology. The framework analyzes emerging demand trends and country-level import patterns while integrating macroeconomic and trade datasets such as GDP and population forecasts, bilateral import–export flows, tariff structures, elasticity differentials between developed and developing economies, geographic distance, and import demand projections. Using weighted trade values from 2020–2024 as the base period to project country-to-country export potential for 2030, these inputs are operationalized through calculated drivers such as gravity model parameters, tariff impact factors, and projected GDP per-capita growth. Through an analysis of hidden potentials, demand hotspots, and market conditions that are most favorable to success, this method enables firms to focus on target countries, maximize returns, and global expansion with data, backed by accuracy.
By factoring in the projected importer demand gap that is currently unmet and could be potential opportunity, it identifies the potential for the Exporter (Country) among 190 countries, against the general trade analysis, which identifies the biggest importer or exporter.
To discover high-growth global markets and optimize your business strategy:
Click Here
Pricing
- Single User License$ 1,995
- Department License$ 2,400
- Site License$ 3,120
- Global License$ 3,795

Leadership Perspectives from Industry Events
Search
Thought Leadership and Analyst Meet


Our Clients
6WResearch In News
- India Air Conditioner Market Set for Strong Rebound in 2026 After Weather-Led Correction and GST-Driven Recovery: 6Wresearch
- ADAS in India: How Automatic Emergency Braking, Blind Spot Detection & Driver Monitoring are Transforming Road Safety
- Doha a strategic location for EV manufacturing hub: IPA Qatar
- Demand for luxury TVs surging in the GCC, says Samsung
- Empowering Growth: The Thriving Journey of Bangladesh’s Cable Industry
- Demand for luxury TVs surging in the GCC, says Samsung
Latest Reports
- Nicaragua RPG Gaming Market (2026-2032)
- New Zealand RPG Gaming Market (2026-2032)
- Netherlands RPG Gaming Market (2026-2032)
- Nauru RPG Gaming Market (2026-2032)
- Namibia RPG Gaming Market (2026-2032)
- Mozambique RPG Gaming Market (2026-2032)
- Montenegro RPG Gaming Market (2026-2032)
- Mongolia RPG Gaming Market (2026-2032)
- Monaco RPG Gaming Market (2026-2032)
- Micronesia RPG Gaming Market (2026-2032)
Industry Events and Analyst Meet

EV India Expo 2026

HIMTEX 2026

India Refining Summit 2026

India EV Show 2026

EV tech India Expo 2026
Whitepaper
- Middle East & Africa Commercial Security Market Click here to view more.
- Middle East & Africa Fire Safety Systems & Equipment Market Click here to view more.
- GCC Drone Market Click here to view more.
- Middle East Lighting Fixture Market Click here to view more.
- GCC Physical & Perimeter Security Market Click here to view more.